Efficient project execution requires visibility into task progress, team performance, and workload balance. The Project Workflow Performance Dashboard in Google Sheets provides a complete, ready-to-use solution for tracking tasks, analyzing efficiency, and managing team workloads visually — all in one place.Project Workflow Performance Dashboard in Google Sheets
This Google Sheets-based dashboard helps project managers, team leaders, and executives monitor every aspect of their workflow — from overdue tasks to departmental workload distribution — through automated charts and performance indicators.Project Workflow Performance Dashboard in Google Sheets
What Is a Project Workflow Performance Dashboard in Google Sheets?
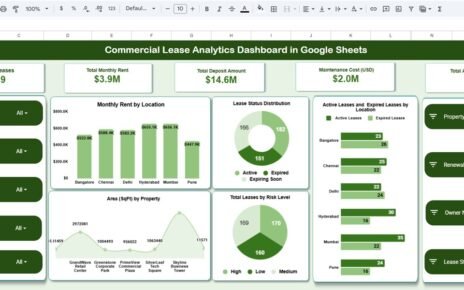
The Project Workflow Performance Dashboard is a centralized performance-tracking tool designed to measure workflow efficiency, identify task bottlenecks, and balance team workloads.Project Workflow Performance Dashboard in Google Sheets
It visualizes data using KPIs, charts, and summaries, enabling quick decision-making and continuous process improvement.
You can monitor progress in real time — view total tasks, completed work, overdue tasks, and performance efficiency instantly.
Dashboard Structure
Click to Buy Project Workflow Performance Dashboard in Google Sheets
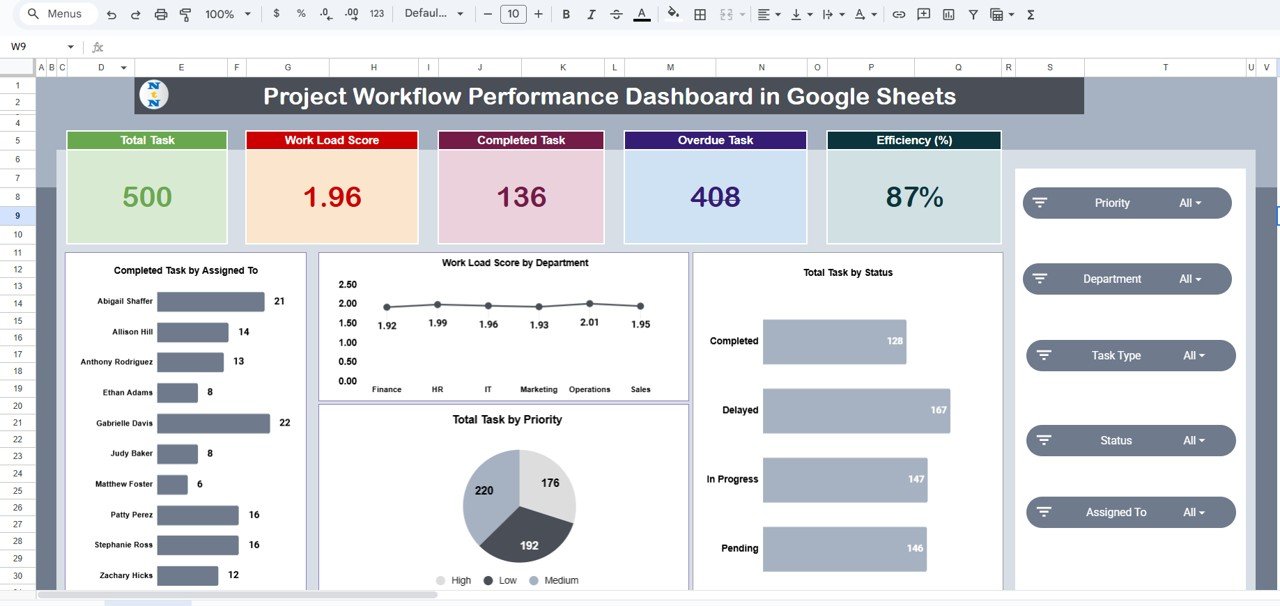
This is the main control panel that provides a complete snapshot of project workflow status, efficiency, and workload at a glance.Project Workflow Performance Dashboard in Google Sheets
Cards Displayed:
-
Total Tasks: Total number of tasks in the project workflow.
-
Workload Score: Weighted workload based on open and pending tasks.
-
Completed Tasks: Number of tasks completed successfully.
-
Overdue Tasks: Count of delayed or overdue activities.
-
Efficiency (%): Overall task completion rate.
Charts Included:
-
Completed Task by Assigned To
-
Workload Score by Department
-
Total Task by Status
-
Total Task by Priority
Click to Buy Project Workflow Performance Dashboard in Google Sheets
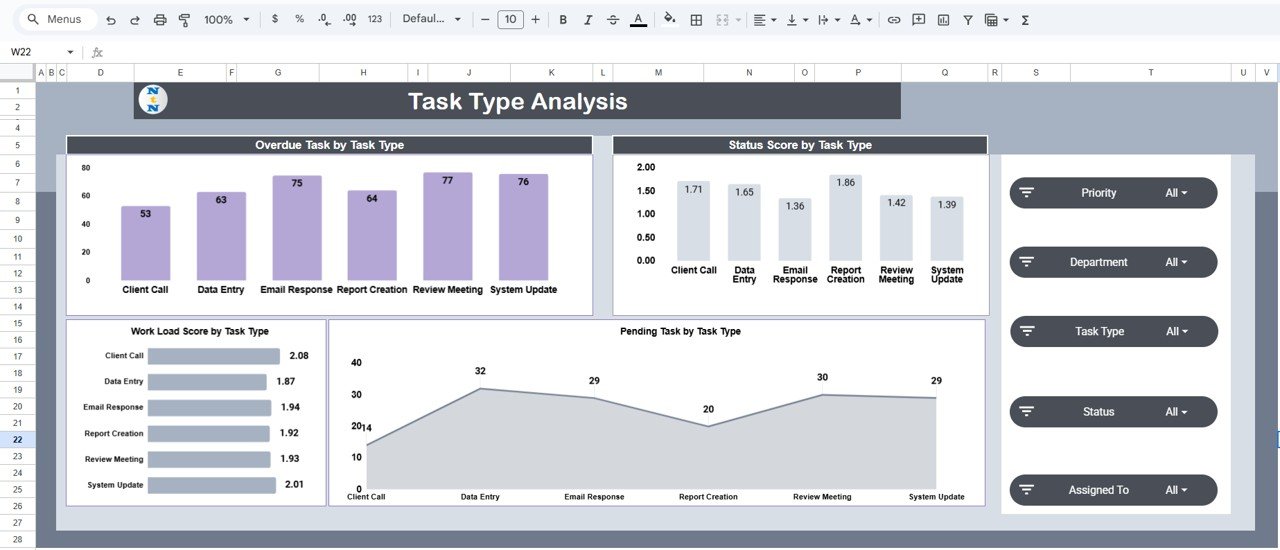
Task Type Analysis
This tab focuses on task performance and efficiency across different task categories.
Charts Included:
-
Overdue Task by Task Type
-
Status Score by Task Type
-
Pending Task by Task Type
-
Workload Score by Task Type
This view helps managers identify which task categories require additional attention or resources.
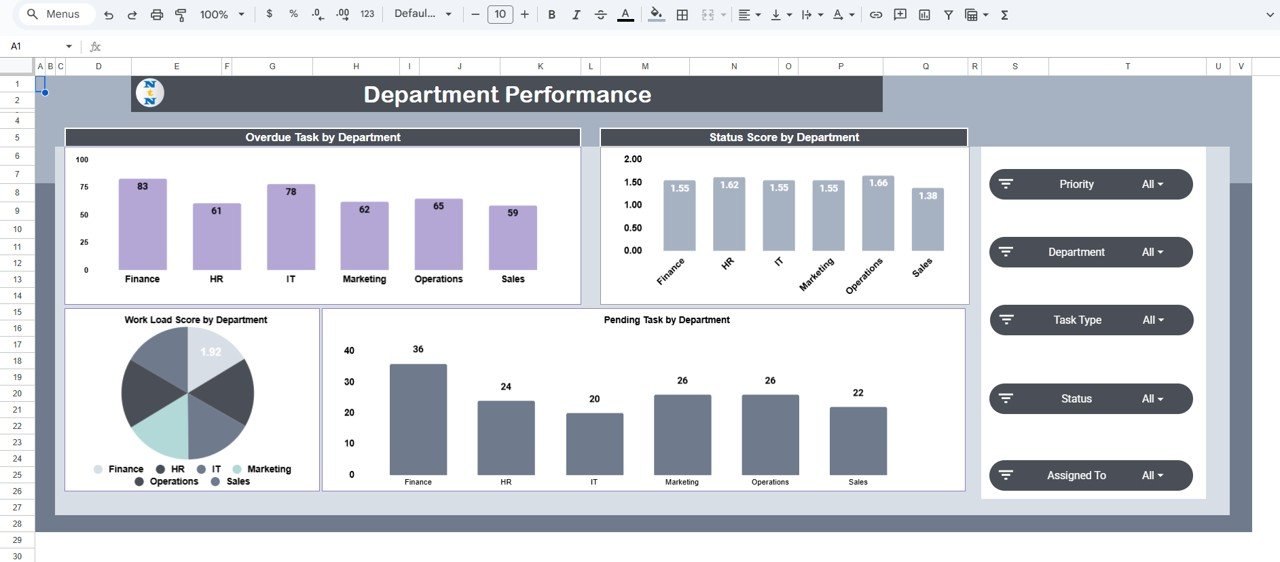
Department Performance
This section evaluates departmental efficiency, overdue tasks, and work distribution.
Charts Included:
-
Overdue Task by Department
-
Status Score by Department
-
Pending Task by Department
-
Workload Score by Department
It helps track which departments are meeting deadlines and which need workflow optimization.
Click to Buy Project Workflow Performance Dashboard in Google Sheets
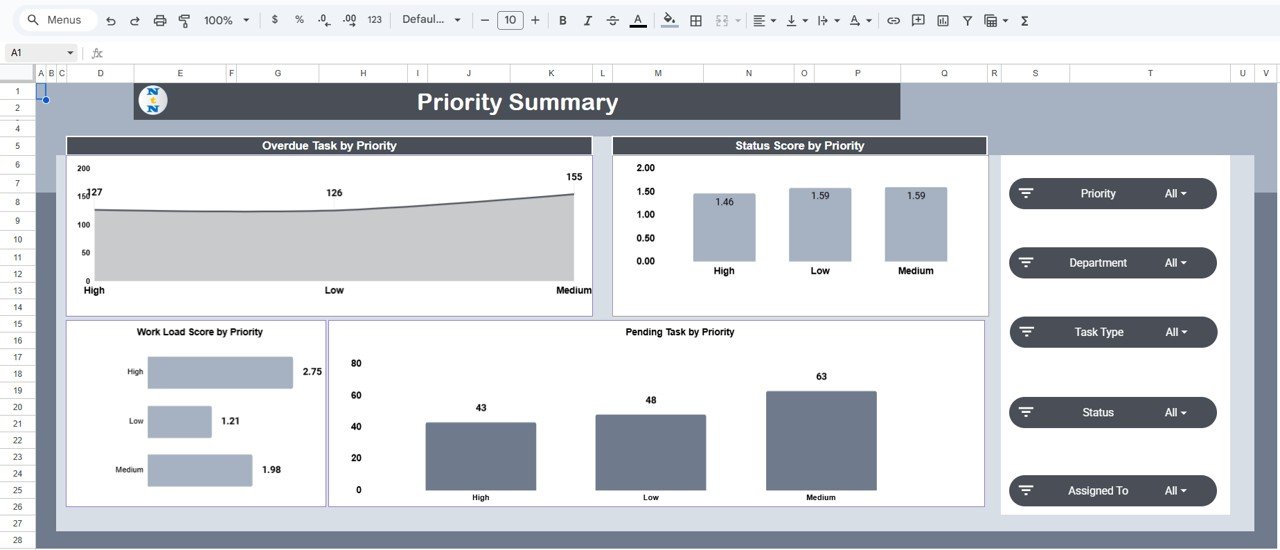
Priority Summary
Analyze project performance based on task priority levels (High, Medium, Low).
Charts Included:
-
Overdue Task by Priority
-
Status Score by Priority
-
Pending Task by Priority
-
Workload Score by Priority
This view helps prioritize critical work and identify risks caused by high-priority overdue tasks.
Click to Buy Project Workflow Performance Dashboard in Google Sheets
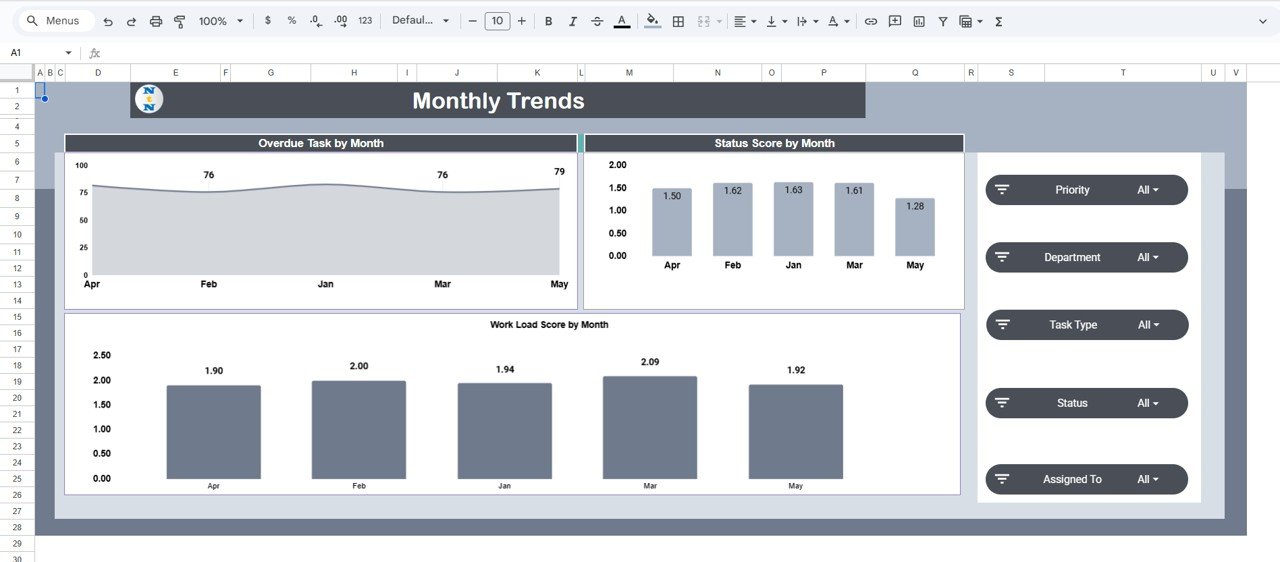
Monthly Trends
Displays workflow progress and performance over time.
Charts Included:
-
Overdue Task by Month
-
Status Score by Month
-
Workload Score by Month
This helps visualize improvement trends and seasonal fluctuations in performance.
Click to Buy Project Workflow Performance Dashboard in Google Sheets
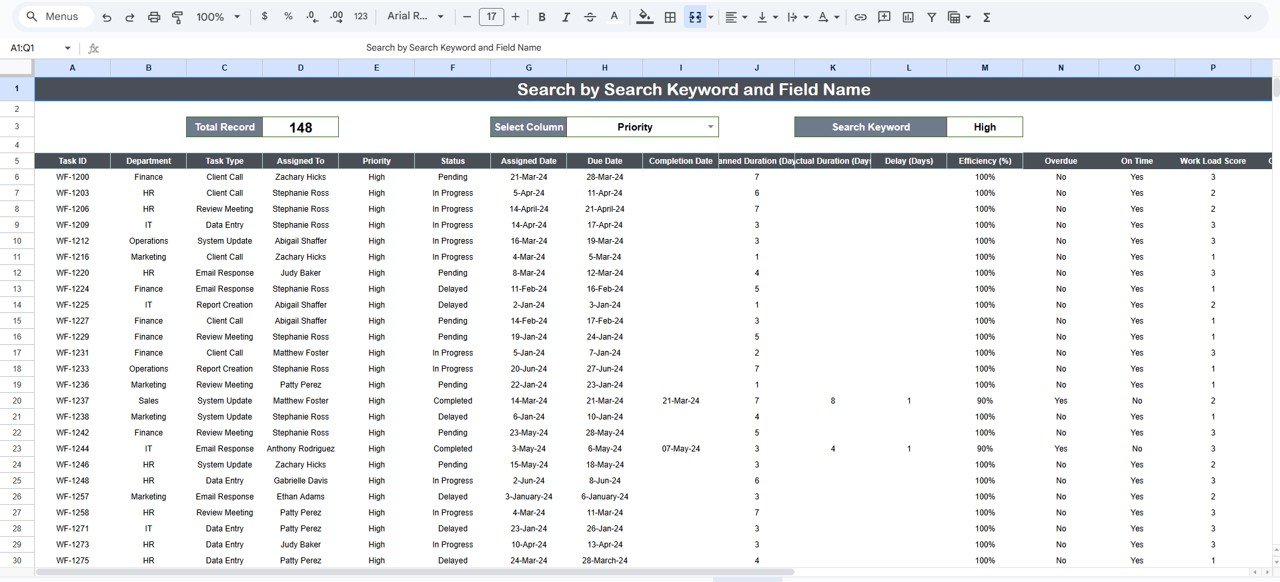
Search Sheet Tab
The Search Tab allows users to quickly locate any record by keyword or field name.
Search Features:
-
Search by Keyword (e.g., “Marketing” or “Design Task”)
-
Search by Field Name (e.g., Department, Assigned To, or Priority)
Example:
-
Searching “High Priority” lists all related high-priority tasks.
-
Searching “HR” retrieves all HR-related tasks.
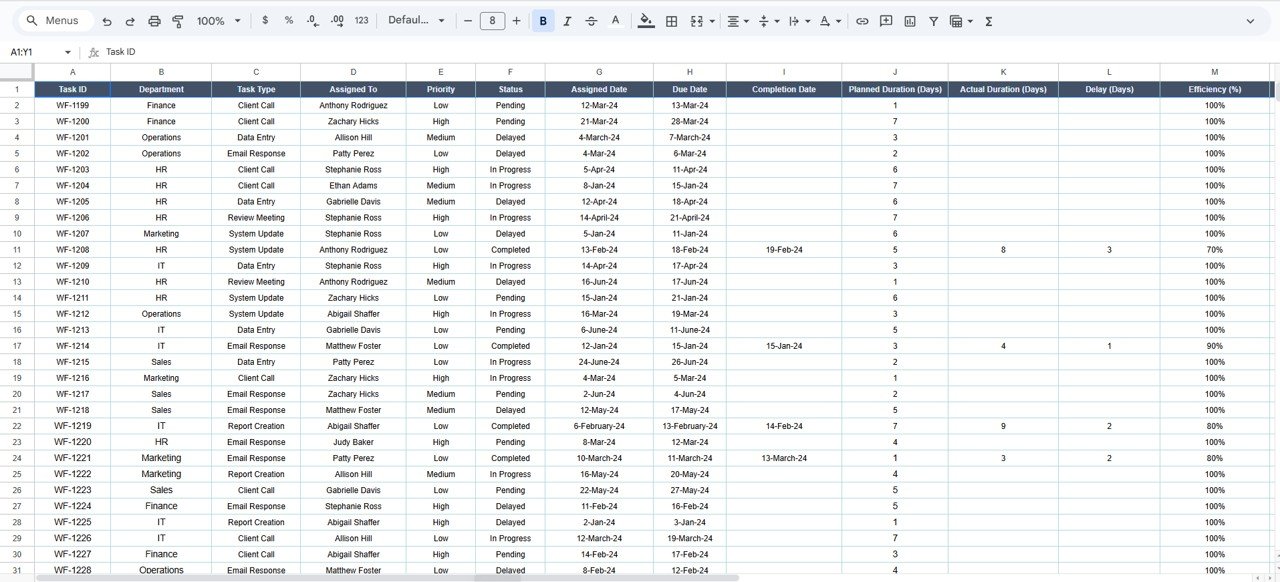
Data Sheet Tab
The Data Sheet is the foundation of the dashboard where all project details are recorded.
Advantages
Click to Buy Project Workflow Performance Dashboard in Google Sheets
-
📈 End-to-End Workflow Visibility: Tracks overall task progress, delays, and completion status.
-
🧠 Smart Workload Analytics: Identifies overburdened departments or employees.
-
⚙️ Automated Calculations: Saves manual effort through auto-calculated efficiency and variance metrics.
-
🧩 Customizable: Fully editable to match any team’s workflow structure.
-
☁️ Cloud-Based: Enables real-time collaboration and updates.
Opportunities for Improvement
-
Add a Gantt Chart for project timeline visualization.
-
Use conditional formatting for overdue and completed tasks.
-
Integrate with Google Forms for automated task submissions.
-
Include email reminders for upcoming deadlines.
-
Add a KPI Comparison Page for month-to-month performance tracking.
Best Practices
Click to Buy Project Workflow Performance Dashboard in Google Sheets
-
Update the Data Sheet daily to maintain real-time accuracy.
-
Review efficiency (%) weekly to identify performance dips.
-
Use the Workload Score to assign resources strategically.
-
Regularly archive completed tasks to improve sheet performance.
-
Customize chart filters to focus on specific teams or projects.
Conclusion
The Project Workflow Performance Dashboard in Google Sheets provides an all-in-one platform for tracking progress, workload, and efficiency.
With its automated charts, search filters, and department-level insights, this dashboard empowers project leaders to maintain control, improve productivity, and ensure projects are completed on time and within scope.
Visit our YouTube channel to learn step-by-step video tutorials
Youtube.com/@NeotechNavigators
Watch the step-by-step video Demo:
Click to Buy Project Workflow Performance Dashboard in Google Sheets