Managing multiple real estate properties efficiently requires clear visibility into costs, space utilization, client types, and overall performance. The Real Estate Property Portfolio Performance Dashboard in Google Sheets offers a ready-to-use, automated solution for real estate professionals, property managers, and investors to analyze portfolio health and performance in one place.Real Estate Property Portfolio Performance Dashboard in Google Sheets
This interactive dashboard transforms raw property data into powerful insights — enabling quick, data-driven decisions for portfolio optimization and client engagement.Real Estate Property Portfolio Performance Dashboard in Google Sheets
What Is a Real Estate Property Portfolio Performance Dashboard in Google Sheets?
Click to Buy Real Estate Property Portfolio Performance Dashboard in Google Sheets
The Real Estate Property Portfolio Performance Dashboard is a data analytics and visualization tool built in Google Sheets. It helps you evaluate property performance based on cost, area, rating, furnishing, and client category.
It consolidates your entire property portfolio into a single sheet, providing interactive charts and KPIs (Key Performance Indicators) that update automatically as you enter new data.
Whether you manage residential, commercial, or mixed-use properties, this dashboard offers a clear overview of profitability, utilization, and client trends.
Dashboard Structure
The file consists of multiple interactive sheet tabs:
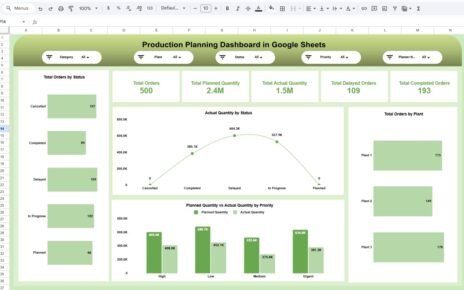
Dashboard Sheet Tab
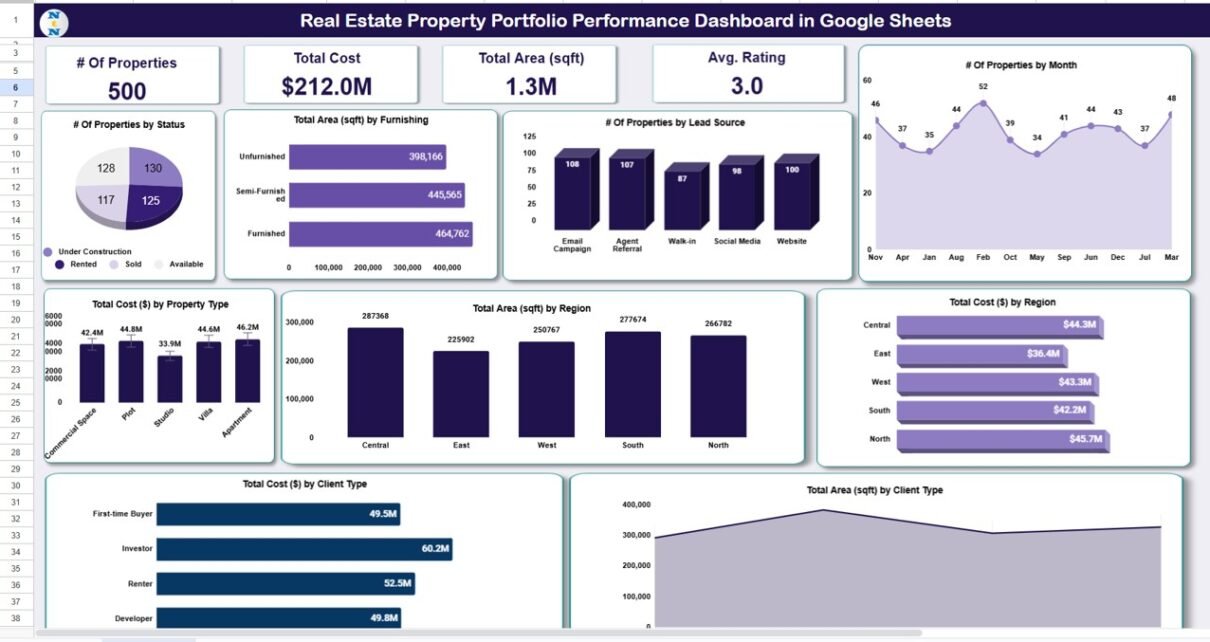
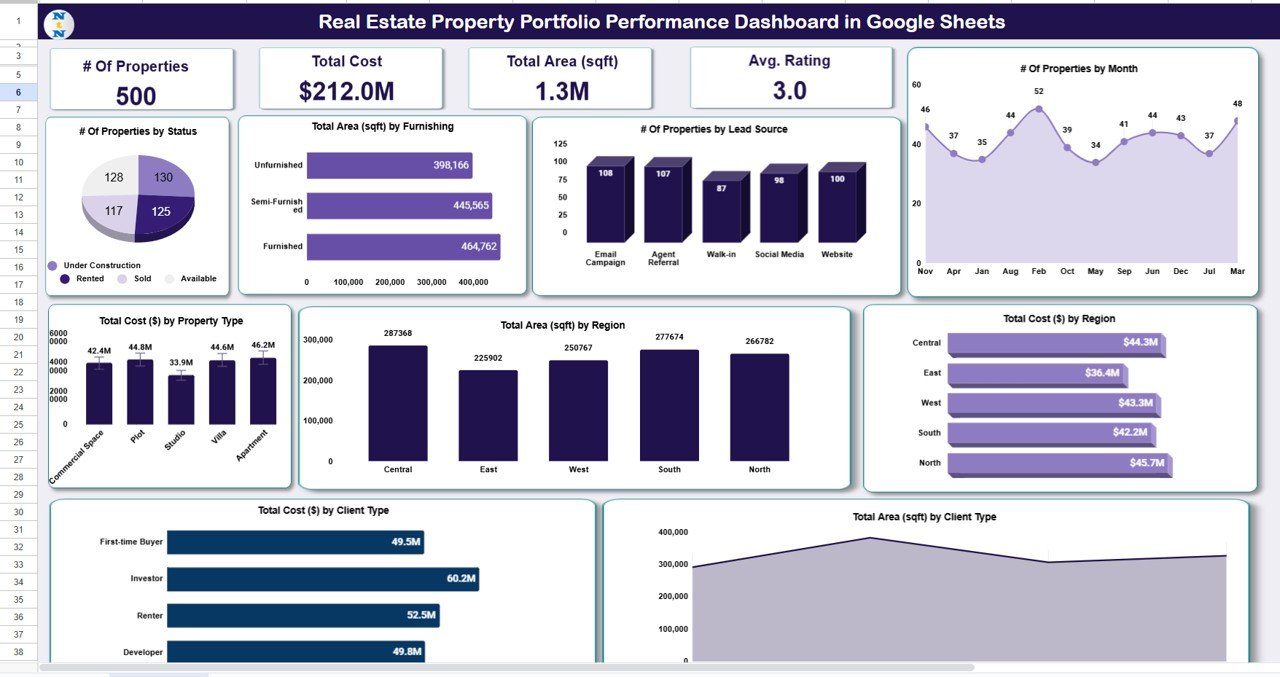
This is the main visual interface where all KPIs and charts are displayed.
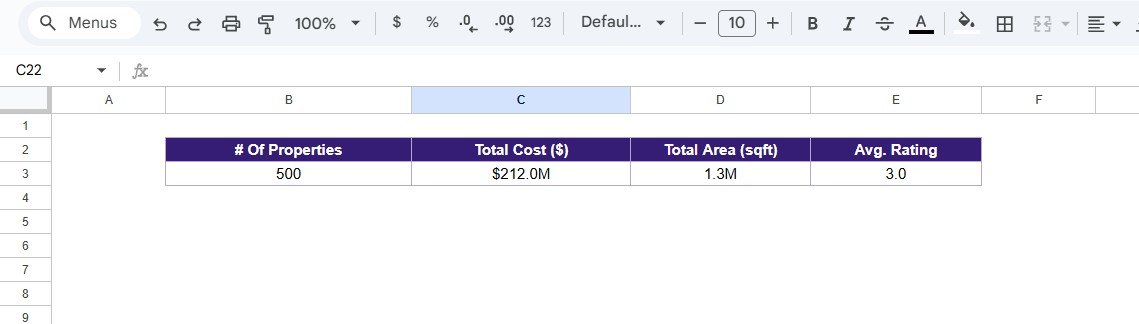
KPI Cards:
These cards summarize the key metrics of your real estate portfolio:
-
# of Properties: Total number of active and inactive properties in the portfolio.
-
Total Cost ($): Combined purchase or construction cost of all listed properties.
-
Total Area (sqft): Total built-up or usable area across properties.
-
Average Rating: Average performance or satisfaction rating based on client or internal evaluation.
Charts Included:
Click to Buy Real Estate Property Portfolio Performance Dashboard in Google Sheets
-
# of Properties by Status:
Visualizes property distribution by status (Available, Sold, Leased, or Under Construction). -
Total Area (sqft) by Furnishing:
Compares furnished, semi-furnished, and unfurnished properties by area. -
# of Properties by Lead Source:
Displays how clients discovered your properties — such as referrals, ads, online listings, or agents. -
# of Properties by Month:
Shows trends in new property acquisitions or deals closed each month. -
Total Cost ($) by Region:
Evaluates regional spending and identifies areas with high investment concentration. -
Total Area (sqft) by Region:
Breaks down total area across different cities or regions. -
Total Cost ($) by Property Type:
Shows cost distribution among property types like Apartments, Villas, Offices, or Retail Units. -
Total Cost ($) by Client Type:
Highlights total sales or investment costs across client types (Individual, Corporate, Investor, etc.). -
Total Area (sqft) by Client Type:
Analyzes which client segment occupies or owns the largest area.
Each chart dynamically updates as new entries are made in the data sheet.
Click to Buy Real Estate Property Portfolio Performance Dashboard in Google Sheets
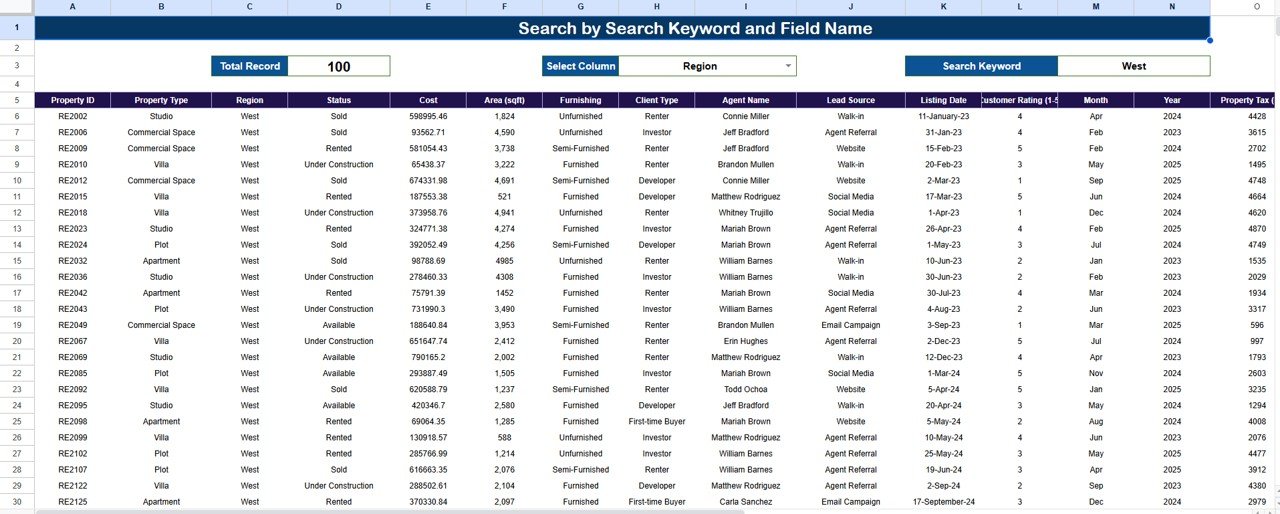
Search Sheet Tab
The Search Tab allows users to quickly locate any property or transaction record.
Search Functionality:
-
Search by Keyword: Enter any property name, region, or client name to filter records.
-
Search by Field Name: Narrow results by criteria such as Property Type, Status, or Lead Source.
Examples:
-
Searching “Villa” will display all villa properties.
-
Searching “Corporate” shows all corporate clients and their related transactions.
Click to Buy Real Estate Property Portfolio Performance Dashboard in Google Sheets
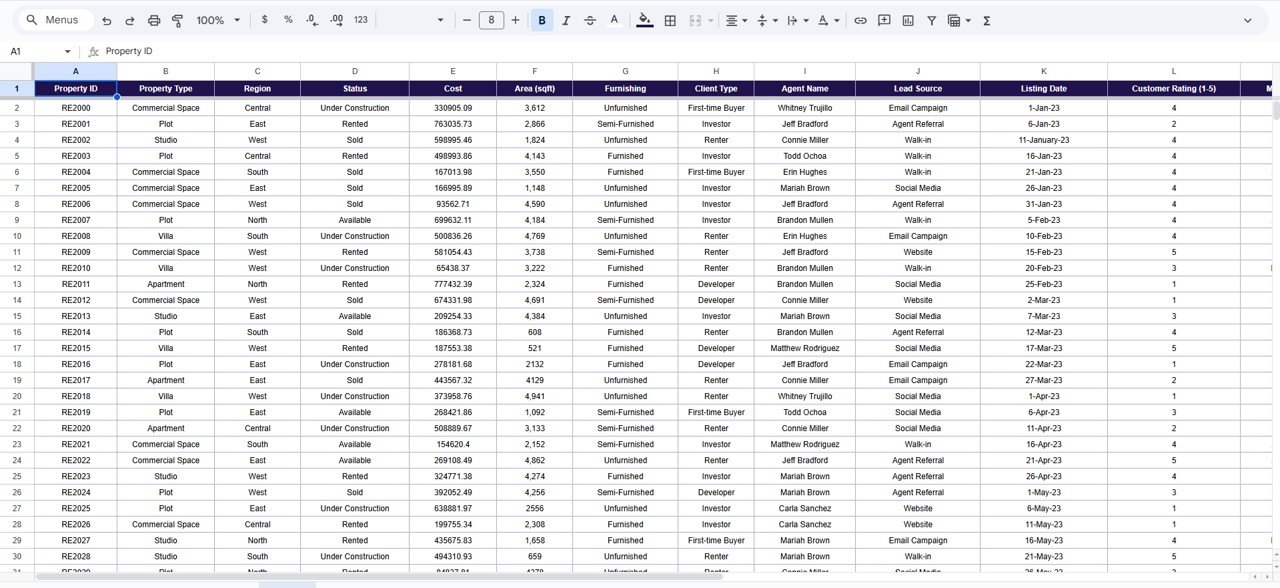
Data Sheet Tab
This is the data backbone of the dashboard — where all raw property details are stored.
Support Sheet Tab
This tab stores backend formulas, dropdown values, and reference data for maintaining consistent structure and chart logic. It ensures that your dashboard calculations stay accurate and organized.
Click to Buy Real Estate Property Portfolio Performance Dashboard in Google Sheets
Advantages
-
🏡 Portfolio at a Glance: Instantly view your total properties, cost, and performance metrics.
-
📈 Data-Driven Insights: Identify regional investment trends and cost distributions.
-
⚙️ Fully Automated: Charts and KPIs update automatically as data changes.
-
🧩 Customizable: Modify categories, add columns, or adjust chart types easily.
-
☁️ Collaborative: Work in real time with your property management or finance team.
Opportunities for Improvement
-
Add a Revenue Tracking Section to monitor rental and sales income.
-
Include a Profit Margin KPI comparing revenue vs. cost.
-
Integrate with Google Forms to automate data entry from brokers or clients.
-
Add Conditional Formatting to highlight top-rated or high-cost properties.
-
Create a Yearly Summary Dashboard for long-term trend analysis.
Best Practices
Click to Buy Real Estate Property Portfolio Performance Dashboard in Google Sheets
-
Keep property names and IDs unique for better data accuracy.
-
Regularly update property status (e.g., Sold, Available, Under Construction).
-
Review monthly charts to identify investment trends.
-
Use filters in the Data Sheet for specific region or client analysis.
-
Protect formula cells to maintain dashboard integrity.
Conclusion
The Real Estate Property Portfolio Performance Dashboard in Google Sheets is a powerful yet simple solution for property investors and managers.
It provides a real-time snapshot of property distribution, investment performance, and client trends, enabling smarter decisions and stronger portfolio control.
Whether you’re managing 10 properties or 1,000, this dashboard transforms raw data into meaningful visual insights that drive profitability and strategic growth.
Visit our YouTube channel to learn step-by-step video tutorials
Youtube.com/@NeotechNavigators
Watch the step-by-step video Demo:
Click to Buy Real Estate Property Portfolio Performance Dashboard in Google Sheets