Software development plays a major role in the digital growth of every organization. Teams push features, fix bugs, manage sprints, and handle code releases under strict timelines. Because development work moves fast, leaders need clear visibility into performance across all stages. A Software Development KPI Dashboard in Google Sheets solves this challenge with real-time insights. It helps all teams track productivity, quality, speed, cost, and delivery outcomes without any expensive tools.Software Development KPI Dashboard in Google Sheets
In this guide, you will learn everything about this dashboard. You will understand all KPIs, formulas, definitions, and units. You will also learn about the worksheet structure, navigation flow, advantages, improvement opportunities, best practices, and common questions. This guide helps you build, use, and maintain a powerful Google Sheets KPI dashboard for development teams.
Let’s begin with the basics.Software Development KPI Dashboard in Google Sheets
What Is a Software Development KPI Dashboard in Google Sheets?
Click to Buy Software Development KPI Dashboard in Google Sheets
A Software Development KPI Dashboard in Google Sheets is a smart reporting tool that tracks development performance through measurable KPIs. It shows month-wise and year-to-date performance for all development metrics. It updates automatically based on the actual numbers, targets, and previous-year data that you enter.
With this dashboard, you can track:
- Sprint performance
- Bug quality metrics
- Velocity trends
- Deployment success
- Developer productivity
- Release performance
- Code quality indicators
Because Google Sheets is simple and cloud-based, the dashboard becomes easy to update and maintain. Developers, team leads, engineering managers, and CTOs all use it to make fast decisions based on fresh data.
Key Worksheets in the Dashboard
Click to Buy Software Development KPI Dashboard in Google Sheets
This dashboard includes 6 worksheet tabs, and each one plays a unique role. Together, they build a complete performance monitoring system.
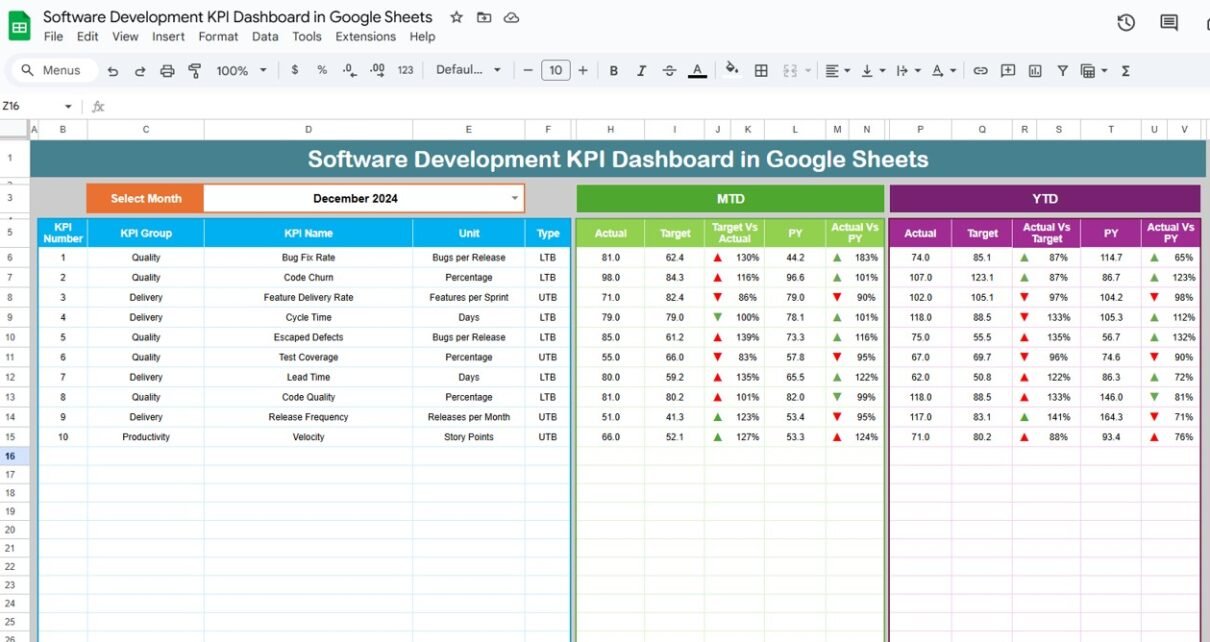
1. Dashboard Sheet Tab (Main Page)
This is the main and most important sheet. You select the month in cell D3, and the dashboard updates all values instantly.
The sheet displays:
-
MTD Actual
-
MTD Target
-
MTD Previous Year
-
Target vs Actual
-
Previous Year vs Actual
-
YTD Actual
-
YTD Target
-
YTD Previous Year
-
YTD vs Target
-
YTD vs Previous Year
Conditional formatting uses up/down arrows for performance status.
Green arrow = Good
Red arrow = Needs improvement
Because all visuals update for the selected month, this sheet becomes perfect for:
- Monthly reviews
- Sprint retrospectives
- Leadership meetings
- Resource planning
- Project execution updates

Click to Buy Software Development KPI Dashboard in Google Sheets
2. KPI Trend Sheet Tab
This sheet highlights the trend for each KPI. You select a KPI from the dropdown in cell C3, and the sheet displays:
- KPI Name
- KPI Group
- KPI Unit
- KPI Definition
- KPI Type (LTB or UTB)
- KPI Formula
- Month-wise trend graph
This helps teams identify bottlenecks, track improvements, and find root-cause patterns.

Click to Buy Software Development KPI Dashboard in Google Sheets
3. Actual Number Sheet Tab
In this sheet, you enter the MTD and YTD actual numbers for each KPI.
You choose the first month of the year in cell E1, and the sheet aligns the timeline.
You only add the numbers — everything else updates automatically.

4. Target Sheet Tab
This sheet stores all monthly KPI targets for both MTD and YTD.
You update targets when new goals are set for:
-
Productivity
-
Velocity
-
Code quality
-
Bug management
-
Deployment success
-
Development cost

Click to Buy Software Development KPI Dashboard in Google Sheets
5. Previous Year Number Sheet Tab
Here you store the previous year’s performance.
This data helps you understand yearly improvements through:
-
CY vs PY comparison
-
Long-term growth
-
Annual performance swings

6. KPI Definition Sheet Tab
This is the foundation of the dashboard.
It includes:
- KPI Name
- KPI Group
- Unit
- Formula
- KPI Definition
- KPI Type (UTB or LTB)
This keeps every KPI clear and easy to understand for all teams.

Click to Buy Software Development KPI Dashboard in Google Sheets
Advantages of the Software Development KPI Dashboard
- Better Sprint Planning: Teams plan future sprints with actual performance data.
- Higher Transparency: Everyone understands workload, productivity, and quality issues.
- Faster Problem Identification: Downward trends show issues early.
- Better DevOps Reliability: Teams track deployment success and reduce failures.
- Clear Productivity Insights: Velocity, merge time, and utilization show team performance.
- Strong Quality Control: Defect density and reopen rate highlight improvement areas.
- Customer Satisfaction Improves: Less customer-reported bugs increase user trust.
Opportunities for Improvement
- Add Automated Data Imports: Use APIs or scripts to bring data from JIRA or GitHub.
- Add Sprint-Wise Comparison: Track sprint-to-sprint improvement.
- Add Team-Wise Dashboards: Show performance by teams or developers.
- Add Complexity Score Metrics: Track complexity of stories to understand workload.
- Add Severity Levels for Bugs: Help teams prioritize critical defects.
- Integrate CI/CD Logs: Pull deployment success and failure data automatically.
Best Practices for Using This Dashboard
Click to Buy Software Development KPI Dashboard in Google Sheets
- Update Data Weekly: Keep actuals fresh for accurate insights.
- Use Clear KPI Definitions: Make sure developers understand every KPI.
- Review Previous-Year Data Monthly; Track long-term improvement.
- Use Visual Color Indicators; Arrows and colors communicate clearly.
- Track Trends, Not Just Monthly Values; Trends show real behavior.
- Set Clear Targets: Targets should be achievable but challenging.
Conclusion
A Software Development KPI Dashboard in Google Sheets helps teams improve performance, speed, and quality. It gives clear visibility into sprints, bugs, releases, and productivity metrics. Because it updates automatically and stays easy to maintain, teams use it daily to make better decisions. When paired with strong KPIs, smart processes, and consistent updates, this dashboard becomes a powerful engine for continuous improvement.
Frequently Asked Questions (FAQs)
Click to Buy Software Development KPI Dashboard in Google Sheets
1. What is the purpose of a Software Development KPI Dashboard?
It tracks productivity, quality, DevOps performance, and delivery speed.
2. Why use Google Sheets for KPIs?
It is simple, cloud-based, and updates automatically.
3. Can I add more KPIs?
Yes, the dashboard is fully customizable.
4. Who uses this dashboard?
Developers, team leads, product managers, and CTOs.
5. Does it require coding?
No, anyone can maintain it easily.
6. Can it track sprint performance?
Yes, sprint velocity and planned vs completed work are included.
7. Can I connect it with JIRA or GitHub?
Yes, using Apps Script or API connectors.
Visit our YouTube channel to learn step-by-step video tutorials
Youtube.com/@NeotechNavigators
Watch the step-by-step video tutorial:
Click to Buy Software Development KPI Dashboard in Google Sheets