Every business needs a clear view of revenue, expenses, profits, and losses. However, many companies still rely on scattered spreadsheets, manual calculations, or outdated formats. This slows down decision-making and increases the risk of mistakes. Because of this, Profit and Loss Templates in Google Sheets have become extremely popular among small businesses, startups, freelancers, and finance professionals.
A Profit and Loss (P&L) Template helps you track revenue, cost of goods sold, operating expenses, interest, taxes, and net profit—automatically. When you update monthly values, Google Sheets recalculates totals, visualizes trends, and presents a complete financial picture.
In this article, we will explain everything about the ready-to-use Profit and Loss Template in Google Sheets, its structure, dashboard sections, charts, and the value it brings to your financial management workflow.
What Is a Profit and Loss Template in Google Sheets?
A Profit and Loss Template is a spreadsheet tool that helps you record and calculate:
-
Revenue
-
Cost of Goods Sold (COGS)
-
Operating Expenses
-
Earnings
-
Taxes
-
Profit after tax
The Google Sheets version is popular because:
This ready-to-use template simplifies financial reporting and gives business owners a clear understanding of monthly and yearly performance.
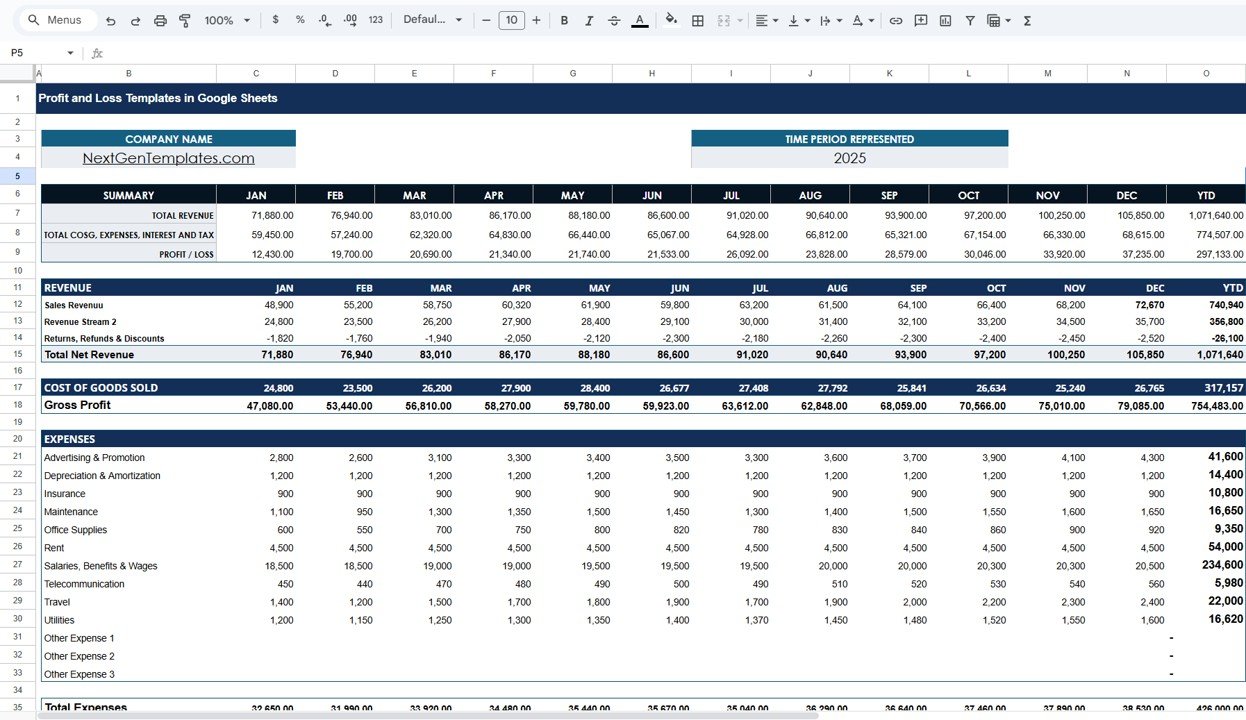
Template Sheet Tab – Complete Financial Table
Click to Buy Profit and Loss Templates in Google Sheets
The Template Sheet tab contains a full financial breakdown from January to December, including YTD totals.
Summary Section
-
Total Revenue
-
Total COGS, Expenses, Interest & Tax
-
Profit / Loss
Example from your template:
Revenue Section
This section breaks down all revenue types:
-
Sales Revenue
-
Revenue Stream 2
-
Returns, Refunds & Discounts
-
Total Net Revenue
The template automatically subtracts discounts and refunds.
Example YTD Summary:
Cost of Goods Sold (COGS)
The COGS section shows the direct cost required to produce goods.
The template calculates:
-
COGS: 317,157
-
Gross Profit: 754,483
Gross Profit becomes a key indicator of profitability before expenses.
Expenses Section
This section includes:
Advertising & Promotion
Depreciation & Amortization
Insurance
Maintenance
Office Supplies
Rent
Salaries & Benefits
Telecommunication
Travel
Utilities
Other Expenses
Example YTD Total Expenses: 426,000
The template calculates:
Earnings, Interest & Taxes
Structured fields include:
Earnings Before Interest & Taxes (EBIT)
Interest Expense
Profit Before Taxes
Income Taxes
Profit After Tax (Final Profit)
Click to Buy Profit and Loss Templates in Google Sheets
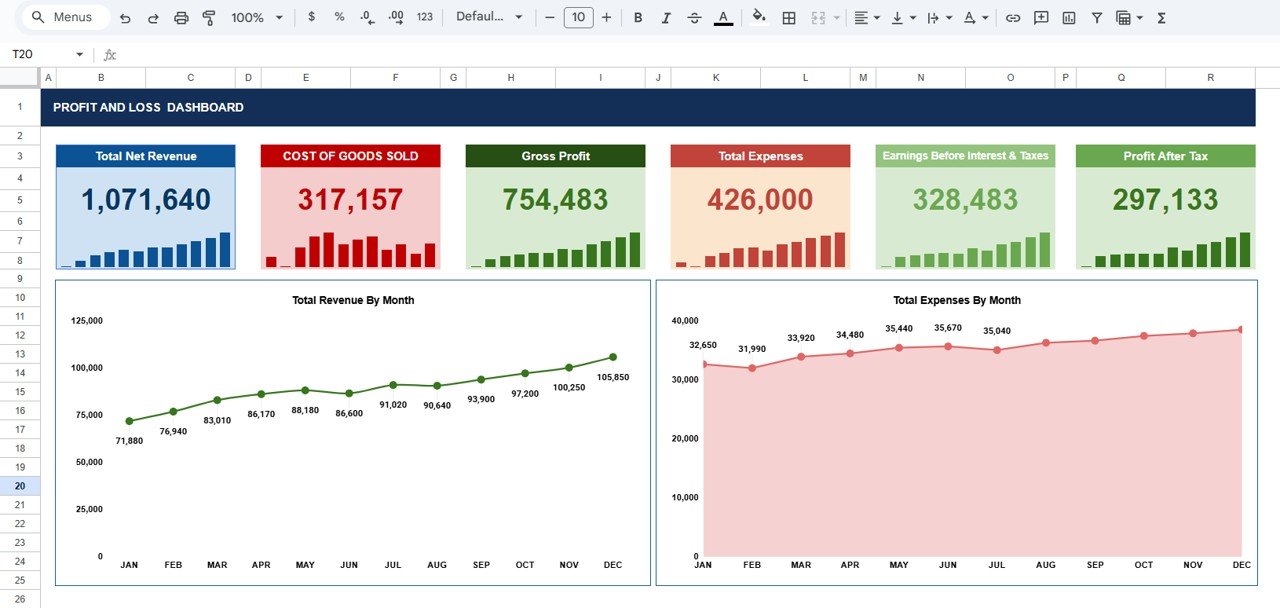
Dashboard Sheet Tab – Visual Financial Insights
The Dashboard provides a clean and interactive view of business performance. It includes financial cards and two key charts.
Dashboard Cards (KPIs)
Total Net Revenue
Shows total earnings after discounts.
Cost of Goods Sold
Displays direct cost needed to generate revenue.
Gross Profit
Indicates business profitability before expenses.
Total Expenses
Shows operational spending for the year.
Earnings Before Interest & Taxes (EBIT)
Measures operational efficiency.
Profit After Tax
Shows final profit remaining after all costs.
These cards help users understand financial performance instantly.
Dashboard Charts
The Dashboard includes two powerful charts:
Total Revenue by Month
This chart shows revenue trends across all 12 months.
It helps identify:
Seasonal peaks
Slow months
Revenue growth
Month-over-month improvement
Managers use this chart to plan sales strategies more effectively.
Total Expenses by Month
This chart visualizes monthly expenses.
It helps evaluate:
Spending spikes
Cost control
Budget planning
Operating efficiency
Together, these charts give a balanced overview of revenue vs. expenses.
Click to Buy Profit and Loss Templates in Google Sheets
Advantages of Using This Profit and Loss Template
Simple to Use
Anyone with basic spreadsheet knowledge can manage it.
Highly Customizable
Add new revenue or expense categories anytime.
Helps Identify Profit Trends
See which months perform best.
Supports Financial Planning
A clear P&L helps with forecasting and budgeting.
Enhances Operational Control
Track where money is spent and optimize cost centers.
Opportunities for Improvement
Click to Buy Profit and Loss Templates in Google Sheets
You can enhance the template with advanced features like:
Department-wise P&L
Track revenue and expenses by business unit.
Forecasting Models
Add 3-month or 12-month projections.
Automated Alerts
Highlight profit dips or high expenses.
Year-over-Year Comparison
Compare profitability across years.
Best Practices for Using Profit & Loss Templates
Update revenue and expenses monthly : Accurate numbers create accurate insights.
Categorize expenses consistently: Avoid naming variations like “Utilities” vs “Utility”.
Review Gross Profit every month: It helps track cost efficiency.
Compare Revenue vs Expenses: This ensures spending stays aligned with earnings.
Use charts for presentations: Visual insights help during management reviews.
Conclusion
Click to Buy Profit and Loss Templates in Google Sheets
A Profit and Loss Template in Google Sheets helps businesses track revenue, expenses, and profit with clarity and confidence. It offers automated calculations, insightful dashboards, and a simple layout that suits all business types. Whether you run a startup, a consultancy, a retail shop, or a large operation, this template ensures proper financial monitoring and smarter decision-making.
With a well-organized P&L structure and a clean dashboard, your business gains real-time visibility, better planning ability, and improved profitability management.
Frequently Asked Questions (FAQs)
1. Who should use this Profit and Loss Template?
Business owners, finance teams, startups, and freelancers.
2. Does it support real-time collaboration?
Yes, Google Sheets allows multi-user access.
3. Can I add more expense categories?
Yes, the template is fully customizable.
4. Does it calculate totals automatically?
Yes, all formulas are pre-built.
5. Is this template suitable for monthly reporting?
Absolutely—each month feeds into the YTD summary.
6. Do I need accounting knowledge?
Basic understanding is enough.
Watch the step-by-step video tutorial:
Visit our YouTube channel to learn step-by-step video tutorials