Managing a loan portfolio requires accuracy, visibility, and continuous monitoring. Banks, NBFCs, credit unions, and financial institutions must track loan performance, risk exposure, delinquency, recovery, and profitability on a regular basis. However, when teams rely on scattered reports or manual spreadsheets, decision-making becomes slow and error-prone.
That is exactly why a Loan Portfolio KPI Dashboard in Google Sheets becomes an essential tool. This ready-to-use dashboard provides a centralized, data-driven view of loan performance using clearly defined KPIs, dynamic month selection, trend analysis, and year-to-date tracking.
What Is a Loan Portfolio KPI Dashboard in Google Sheets?
Click to Buy Loan Portfolio KPI Dashboard in Google Sheets
A Loan Portfolio KPI Dashboard is a structured reporting system that tracks key metrics related to loan origination, outstanding balances, repayments, defaults, delinquency, and portfolio quality. It converts raw loan data into meaningful insights that support better credit decisions and risk management.
Because this dashboard is built in Google Sheets, it offers:
-
Real-time updates
-
Easy collaboration
-
No dependency on costly BI tools
-
Simple monthly and yearly comparisons
-
Clear visual indicators for performance
As a result, finance teams gain full control over portfolio monitoring.
Key Worksheets in the Dashboard
The dashboard includes 6 structured worksheet tabs, each designed for a specific purpose.
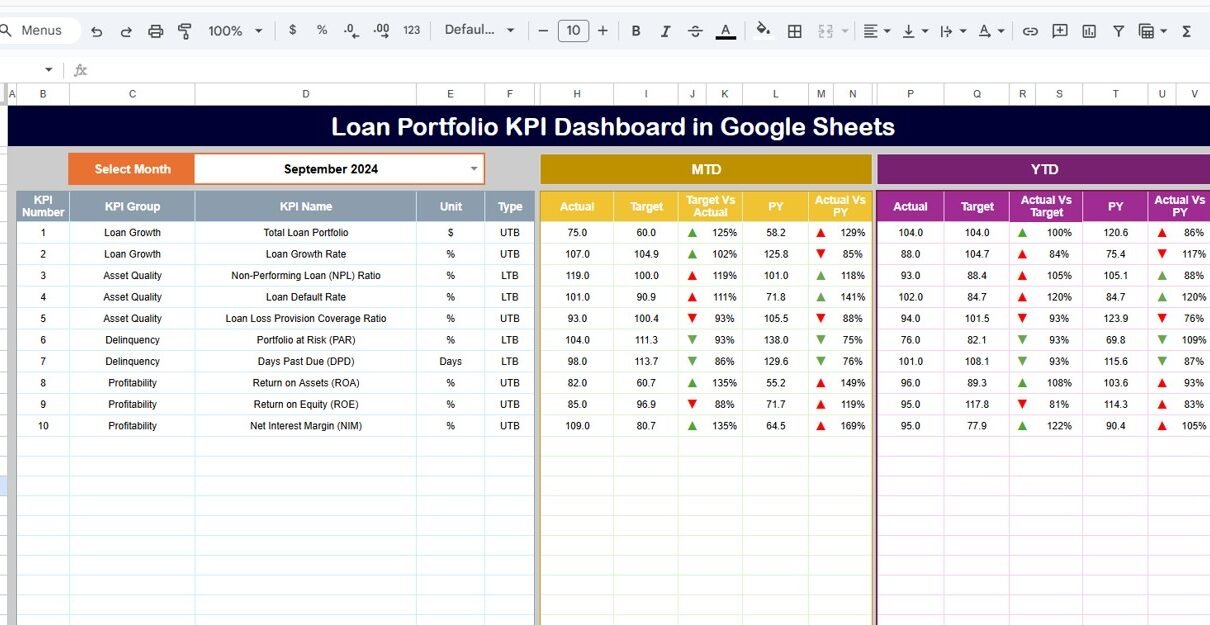
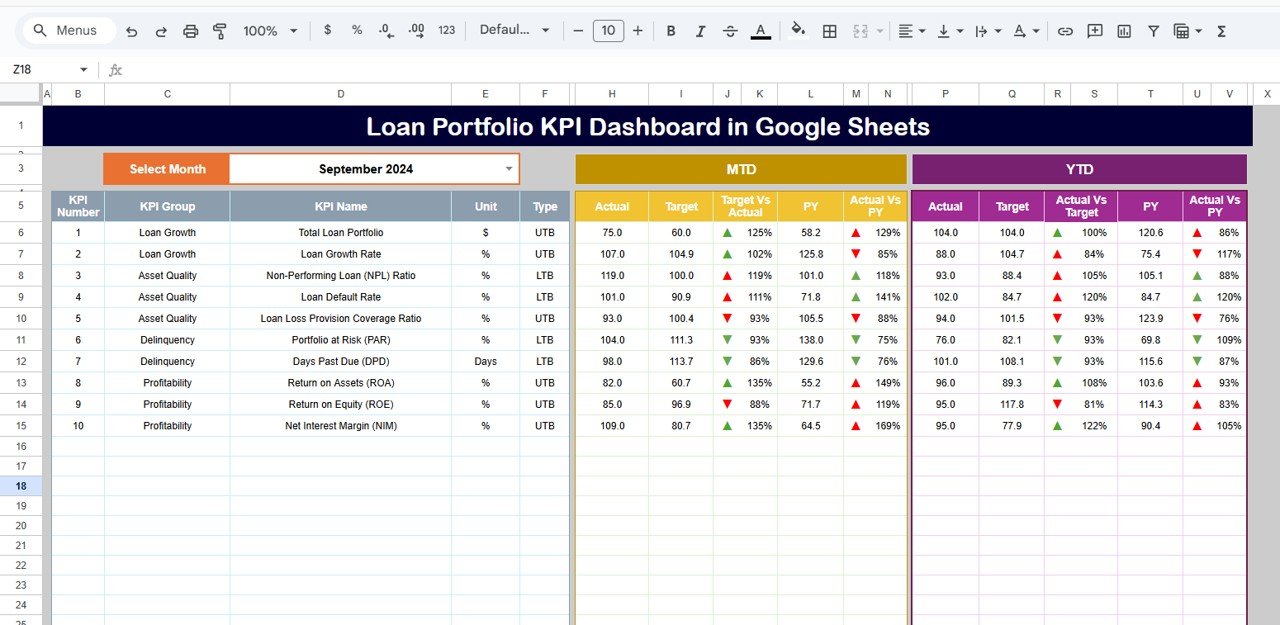
Dashboard Sheet Tab (Main Page)
This is the central monitoring page.
In cell D3, you select the month from a dropdown. Once selected, the entire dashboard updates automatically.
The dashboard displays:
MTD (Month-to-Date)
-
MTD Actual
-
MTD Target
-
MTD Previous Year
-
Target vs Actual
-
Previous Year vs Actual
YTD (Year-to-Date)
-
YTD Actual
-
YTD Target
-
YTD Previous Year
-
Target vs Actual
-
Previous Year vs Actual
Conditional formatting with up/down arrows highlights performance trends instantly:
-
Green arrow → favorable movement
-
Red arrow → unfavorable movement
This allows leadership to review loan health at a glance.
Click to Buy Loan Portfolio KPI Dashboard in Google Sheets
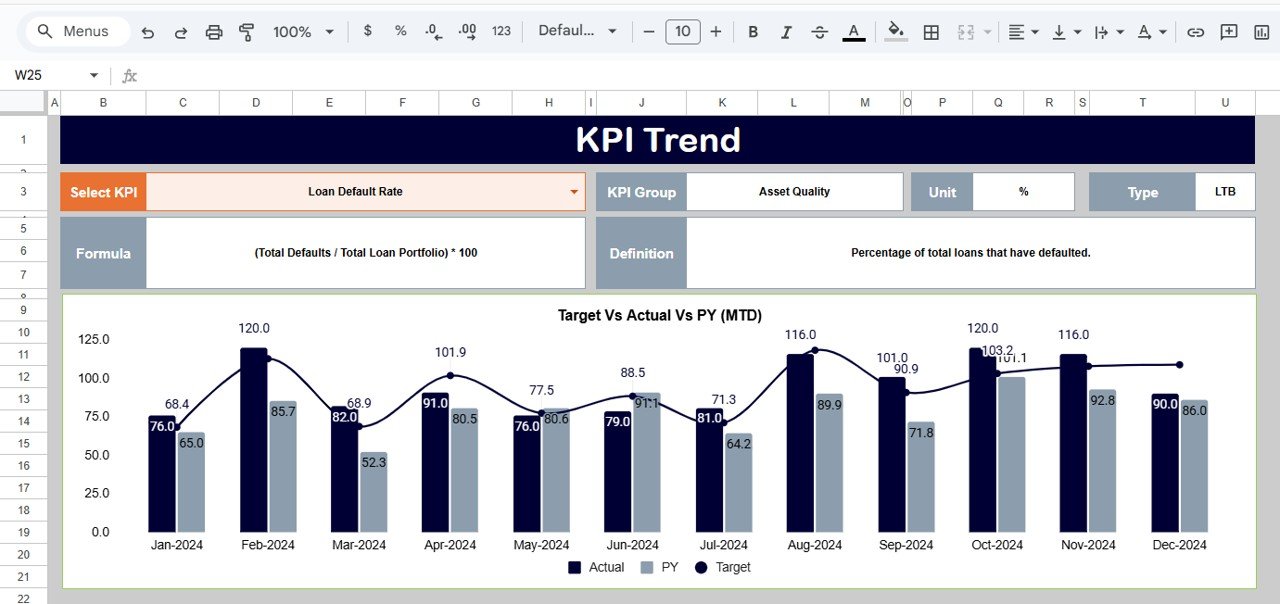
KPI Trend Sheet Tab
In this sheet, you select a KPI name from the dropdown in cell C3.
The sheet displays:
-
KPI Group
-
Unit
-
KPI Type (Lower the Better / Upper the Better)
-
KPI Formula
-
KPI Definition
Additionally, monthly trend charts help teams analyze performance patterns across the year.
Click to Buy Loan Portfolio KPI Dashboard in Google Sheets
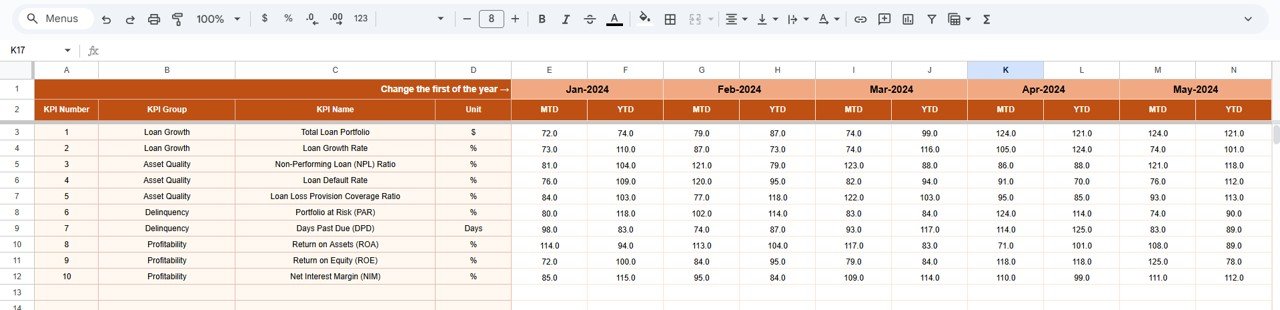
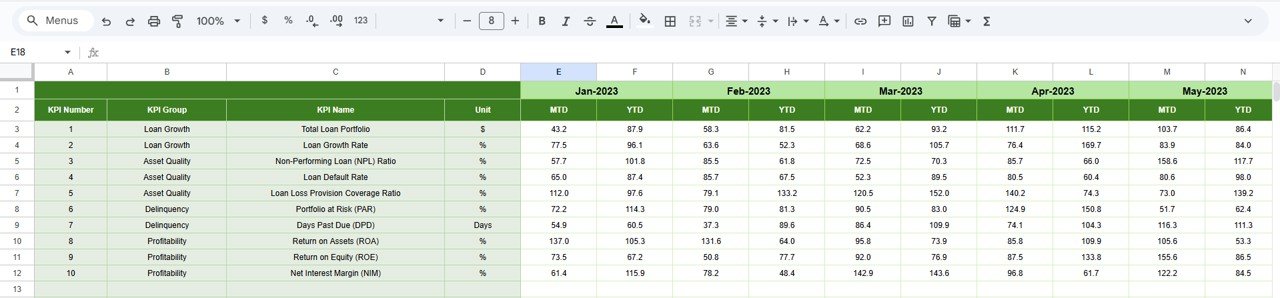
Actual Number Sheet Tab
This sheet stores MTD and YTD actual values for every KPI.
You define the first month of the year in cell E1, and the structure adjusts automatically.
All dashboard values pull directly from this sheet.
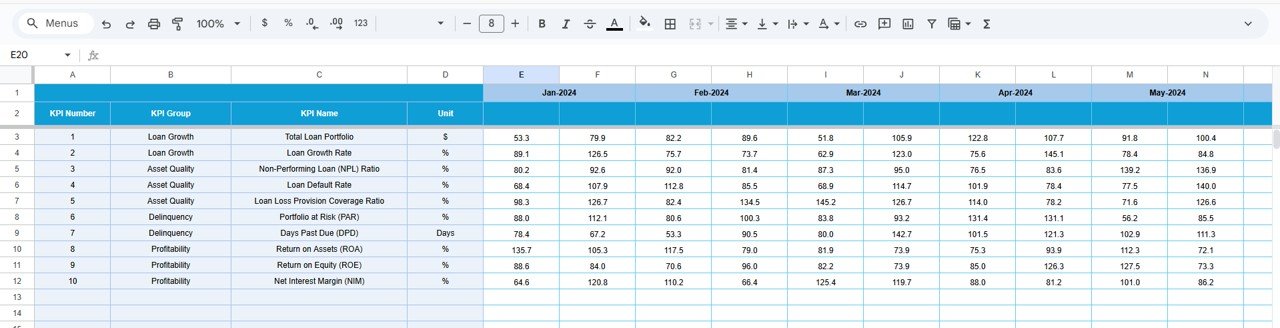
Target Sheet Tab
This sheet captures monthly and YTD targets for all KPIs.
Targets allow teams to benchmark performance and identify gaps early.
Click to Buy Loan Portfolio KPI Dashboard in Google Sheets
Previous Year Number Sheet Tab
This sheet stores last year’s KPI values.
The dashboard uses this data to show year-over-year performance and improvement trends.
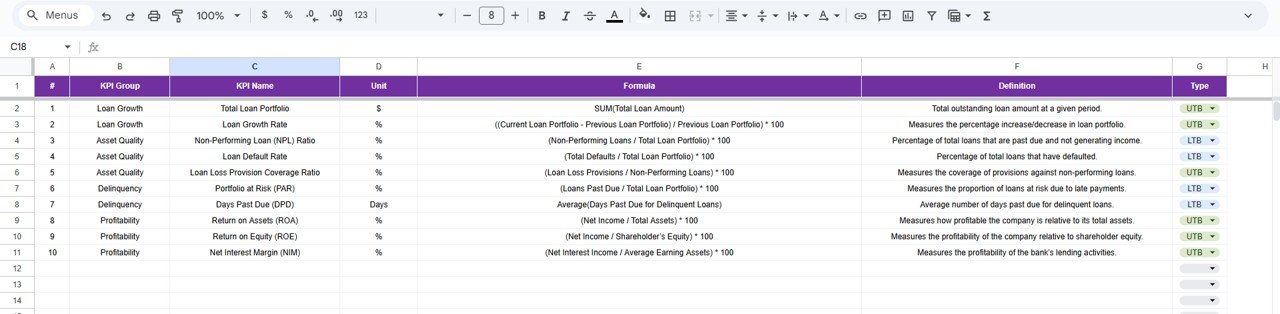
KPI Definition Sheet Tab
This is the control center of the dashboard.
It contains:
-
KPI Name
-
KPI Group
-
Unit
-
Formula
-
Definition
-
KPI Type (LTB / UTB)
This sheet ensures clarity, consistency, and standardization across reports.
Click to Buy Loan Portfolio KPI Dashboard in Google Sheets
Advantages of the Loan Portfolio KPI Dashboard
-
Centralized loan performance monitoring
-
Faster credit and risk decisions
-
Clear delinquency and default visibility
-
Strong year-over-year comparisons
-
Automated calculations and visuals
-
Easy reporting for management and regulators
Opportunities for Improvement
-
Integration with core banking systems
-
Automated delinquency alerts
-
Credit score-based segmentation
-
Region-wise loan performance tracking
-
Predictive default analytics
Best Practices for Using the Dashboard
Click to Buy Loan Portfolio KPI Dashboard in Google Sheets
-
Update actual data monthly without delay
-
Review PAR and NPL KPIs weekly
-
Set realistic but challenging targets
-
Compare current year vs previous year regularly
-
Use KPI trends during credit committee reviews
Conclusion
A Loan Portfolio KPI Dashboard in Google Sheets gives financial institutions a powerful, flexible, and cost-effective way to monitor loan performance. With clearly defined KPIs, automated calculations, and interactive visuals, the dashboard supports smarter lending decisions, better risk control, and stronger portfolio growth.
When used consistently, this dashboard becomes an essential management tool for banks, NBFCs, microfinance institutions, and credit teams.
Frequently Asked Questions (FAQs)
Click to Buy Loan Portfolio KPI Dashboard in Google Sheets
1. Who should use a Loan Portfolio KPI Dashboard?
Banks, NBFCs, MFIs, credit unions, and finance teams.
2. Can I customize KPIs?
Yes, KPIs can be added or modified easily.
3. Does it support MTD and YTD analysis?
Yes, both are fully supported.
4. Can I track previous year performance?
Yes, the dashboard includes year-over-year comparison.
5. Is Google Sheets secure for financial data?
Yes, when proper access controls are applied.
Visit our YouTube channel to learn step-by-step video tutorials
Youtube.com/@NeotechNavigators
Watch the step-by-step video tutorial: