Employee engagement plays a critical role in organizational success. Engaged employees work with passion, stay productive, collaborate better, and contribute positively to company growth. However, many organizations struggle to measure engagement effectively because data remains scattered across surveys, HR systems, and manual reports.Employee Engagement Dashboard in Google Sheets
That is exactly where an Employee Engagement Dashboard in Google Sheets becomes a powerful and practical solution.
This ready-to-use dashboard helps HR teams, managers, and leadership monitor engagement, satisfaction, recognition, training, and participation across employees, departments, locations, and job roles. Because it is built in Google Sheets, it remains simple, collaborative, and highly flexible.Employee Engagement Dashboard in Google Sheets
What Is an Employee Engagement Dashboard in Google Sheets?
An Employee Engagement Dashboard in Google Sheets is a centralized analytical tool that tracks employee engagement-related metrics and presents them in visual and easy-to-understand formats. Instead of reviewing multiple spreadsheets or survey files, this dashboard brings everything into one place.
The dashboard tracks key engagement dimensions such as:
- Engagement score
- Satisfaction score
- Recognition activity
- Training hours
- Project involvement
- Participation trends
Because Google Sheets supports real-time updates and collaboration, this dashboard works perfectly for both onsite and remote teams.
Why Employee Engagement Tracking Is Important
Employee engagement directly impacts productivity, retention, and organizational culture. When engagement levels drop, organizations face challenges such as:
- High employee turnover
- Low morale
- Poor collaboration
- Reduced productivity
- Increased absenteeism
By using a structured engagement dashboard, organizations gain clarity and act proactively instead of reacting too late.
Key Features of the Employee Engagement Dashboard
Click to Buy Employee Engagement Dashboard in Google Sheets
This dashboard is designed with clarity and usability in mind. It includes multiple analytical views that answer key HR and management questions.
Dashboard Highlights
- Ready-to-use structure
- Automated calculations
- Visual charts and KPI cards
- Department, location, and role-based analysis
- Monthly trend tracking
- Smart search functionality
Let’s explore each section in detail.
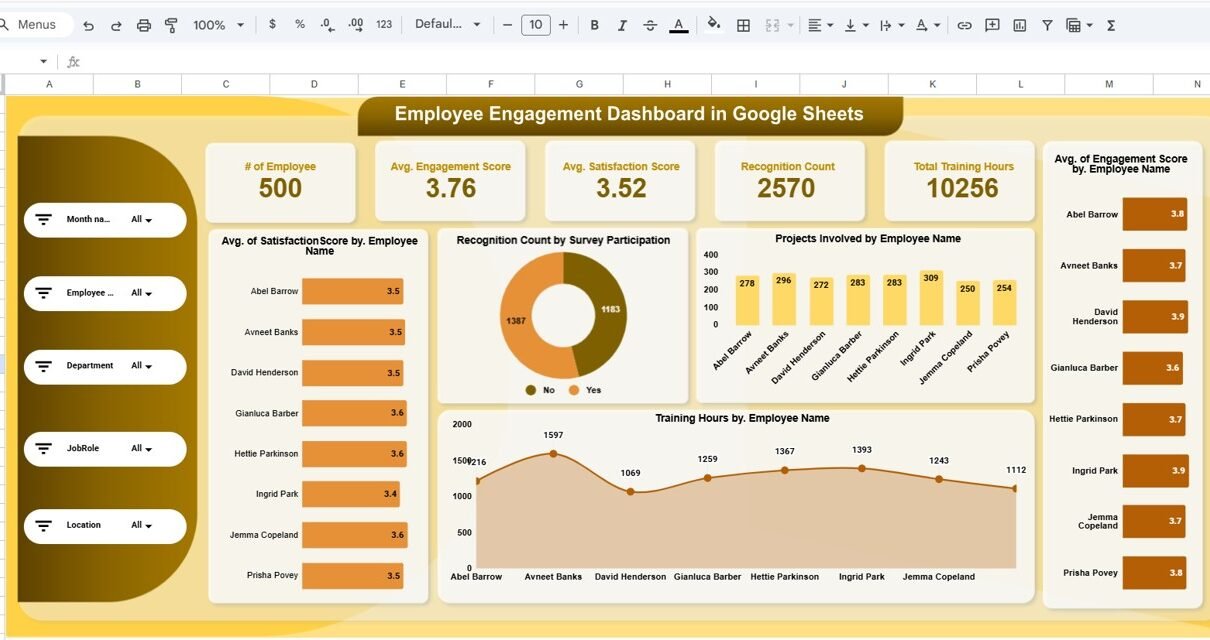
Overview Sheet Tab
The Overview sheet acts as the executive summary of employee engagement performance.
KPI Cards in the Overview Sheet
These cards provide instant insights at a glance:
1. Number of Employees
Shows the total employees included in the dashboard.
2. Average Engagement Score
Displays the overall engagement level across all employees.
3. Average Satisfaction Score
Reflects how satisfied employees feel with their work environment.
4. Recognition Count
Shows how often employees receive recognition.
5. Total Training Hours
Tracks total learning and development effort invested in employees.
These cards help leadership quickly understand workforce health.
Charts in the Overview Sheet
Average Satisfaction Score by Employee Name
Helps identify employees who feel highly satisfied or disengaged.
Recognition Count by Survey Participation
Shows the relationship between engagement and recognition.
Projects Involved by Employee Name
Tracks employee involvement and workload exposure.
Average Engagement Score by Employee Name
Highlights top-engaged and at-risk employees.
Training Hours by Employee Name
Shows skill development investment per employee.

Click to Buy Employee Engagement Dashboard in Google Sheets
Department Analysis Sheet
The Department Analysis sheet compares engagement metrics across departments.
Charts in Department Analysis
Average Satisfaction Score by Department
Helps identify departments with strong or weak satisfaction levels.
Projects Involved by Department
Shows workload distribution and involvement.
Average Engagement Score by Department
Highlights engagement gaps between teams.
Training Hours by Department
Shows how learning investment varies across departments.
This analysis helps HR teams focus interventions where they matter most.

Click to Buy Employee Engagement Dashboard in Google Sheets
Location Analysis Sheet
The Location Analysis sheet compares employee engagement across different office locations or regions.
Charts in Location Analysis
Average Satisfaction Score by Location
Shows location-specific morale and satisfaction.
Projects Involved by Location
Highlights workload and exposure by geography.
Training Hours by Location
Shows training access and participation by region.
Average Engagement Score by Location
Helps leadership understand regional engagement patterns.
This sheet proves especially useful for organizations with distributed or remote teams.

Click to Buy Employee Engagement Dashboard in Google Sheets
Job Role Analysis Sheet
The Job Role Analysis sheet focuses on engagement by job role or designation.
Charts in Job Role Analysis
Average Satisfaction Score by Job Role
Helps identify roles with high or low satisfaction.
Projects Involved by Job Role
Shows how responsibilities vary across roles.
Training Hours by Job Role
Tracks learning investment by function.
Average Engagement Score by Job Role
Highlights roles that may need better support or clarity.
This view helps HR teams align engagement initiatives with role-specific needs.

Click to Buy Employee Engagement Dashboard in Google Sheets
Monthly Trend Sheet
The Monthly Trend sheet helps organizations track engagement over time.
Charts in Monthly Trend
Average Satisfaction Score by Month
Tracks satisfaction movement month-over-month.
Projects Involved by Month
Shows workload trends across time.
Training Hours by Month
Monitors learning activity progression.
Average Engagement Score by Month
Identifies seasonal trends or improvement after initiatives.
This sheet supports long-term engagement strategy evaluation.

Click to Buy Employee Engagement Dashboard in Google Sheets
Search Functionality
The dashboard includes a Smart Search feature that allows users to search data instantly.
Search by:
-
Search Keyword
-
Field Name (Employee Name, Department, Location, Job Role, etc.)
This feature helps HR teams quickly find specific employees or patterns without manual filtering.

Click to Buy Employee Engagement Dashboard in Google Sheets
Advantages of Employee Engagement Dashboard in Google Sheets
Using this dashboard delivers multiple benefits:
Centralized Engagement Tracking
All engagement data stays in one structured location.
Real-Time Visibility
Charts and KPIs update instantly when data changes.
Improved Decision-Making
Leaders rely on data instead of assumptions.
Employee-Focused Strategy
HR teams identify disengagement early.
Cost-Effective Solution
Google Sheets eliminates the need for expensive tools.
Scalable for Any Organization
Works for small teams and large enterprises alike.
Opportunities for Improvement in Employee Engagement Tracking
Click to Buy Employee Engagement Dashboard in Google Sheets
Even with a powerful dashboard, continuous improvement remains essential.
Add Sentiment Analysis
Include open-text feedback analysis.
Track Engagement Action Plans
Link initiatives with engagement improvement.
Include Attrition Risk Indicators
Connect engagement scores with retention risk.
Automate Survey Imports
Pull data directly from survey tools.
Introduce Engagement Benchmarks
Compare performance against industry standards.
Best Practices for Using the Employee Engagement Dashboard
Click to Buy Employee Engagement Dashboard in Google Sheets
Conduct Surveys Regularly
Quarterly or biannual surveys provide consistency.
Ensure Data Confidentiality
Protect sensitive employee information.
Communicate Insights Transparently
Share trends without exposing individuals.
Act on Insights Quickly
Engagement improves only with timely action.
Combine Data with Conversations
Use dashboards to support real discussions, not replace them.
Conclusion
An Employee Engagement Dashboard in Google Sheets empowers organizations to understand, measure, and improve employee experience effectively. With clear KPIs, interactive charts, and structured analysis, the dashboard transforms raw survey data into meaningful insights.Employee Engagement Dashboard in Google Sheets
Because it is simple, flexible, and collaborative, this dashboard becomes a valuable tool for HR teams, managers, and leadership. When organizations track engagement consistently and act on insights, they build motivated teams, stronger culture, and long-term success.Employee Engagement Dashboard in Google Sheets
Frequently Asked Questions (FAQs)
Click to Buy Employee Engagement Dashboard in Google Sheets
Who should use this Employee Engagement Dashboard?
HR teams, managers, people analytics teams, and leadership.
Is Google Sheets secure for employee data?
Yes, with proper access controls and permissions.
Can I customize metrics and charts?
Yes, the dashboard is fully customizable.
Does it support remote employees?
Yes, location-based analysis works for remote teams.
How often should engagement be reviewed?
Monthly trend review with quarterly deep analysis works best.
Visit our YouTube channel to learn step-by-step video tutorials
Youtube.com/@NeotechNavigators
Watch the step-by-step video tutorial: