Understanding how customers interact with your business at every stage is critical for growth, retention, and satisfaction. However, many organizations struggle to visualize the full customer journey because data remains scattered across tools, teams, and reports. As a result, decision-makers often miss important insights.Customer Journey Mapping KPI Dashboard in Google Sheets
A Customer Journey Mapping KPI Dashboard in Google Sheets solves this problem effectively. It provides a structured, data-driven view of customer interactions, engagement, experience, and conversion across the entire journey. Because the dashboard works inside Google Sheets, it remains simple, flexible, and accessible to everyone.Customer Journey Mapping KPI Dashboard in Google Sheets
What Is a Customer Journey Mapping KPI Dashboard in Google Sheets?
A Customer Journey Mapping KPI Dashboard is a performance-tracking system that measures how customers move through different stages such as awareness, consideration, onboarding, usage, support, and retention.Customer Journey Mapping KPI Dashboard in Google Sheets
This dashboard converts raw customer data into clear KPIs, comparisons, and trends. It helps teams answer questions like:
- Where do customers drop off?
- Which journey stage creates friction?
- How does customer experience improve over time?
- Are targets getting met month-to-date and year-to-date?
Because the dashboard runs in Google Sheets, teams can collaborate easily and update data in real time.
Key Features of the Customer Journey Mapping KPI Dashboard
Click to Buy Customer Journey Mapping KPI Dashboard in Google Sheets
This ready-to-use dashboard includes:
- Structured KPI tracking
- Month selection using dropdown
- MTD, YTD, Target, and Previous Year comparison
- Trend analysis for each KPI
- Central KPI definition control
- Clean and scalable worksheet design
The dashboard uses 6 main worksheet tabs, each with a specific purpose.
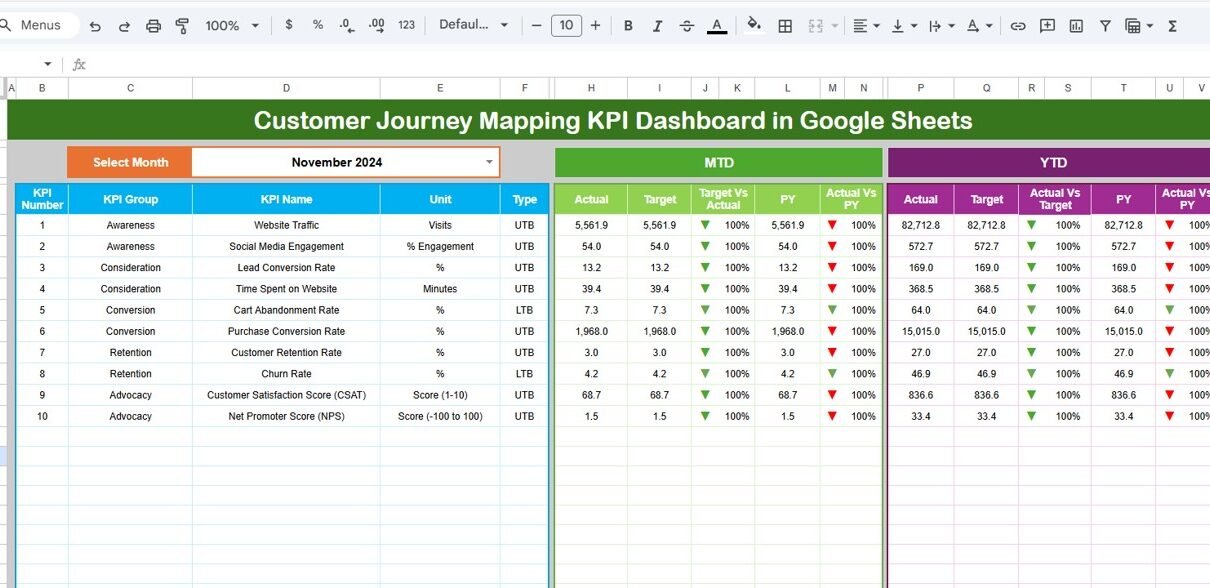
Dashboard Sheet Tab (Main Page)
The Dashboard Sheet acts as the command center.
Month Selector
-
Located in cell D3
-
Selecting a month instantly refreshes all KPI values
KPI Comparisons Displayed
For each KPI, the dashboard shows:
MTD (Month-to-Date):
- Actual
- Target
- Previous Year
- Target vs Actual
- Previous Year vs Actual
YTD (Year-to-Date):
- Actual
- Target
- Previous Year
- Target vs Actual
- Previous Year vs Actual
Conditional Formatting
- Green arrow → improvement
- Red arrow → decline
- Neutral indicator → stable
This allows leadership to understand customer journey performance within seconds.

Click to Buy Customer Journey Mapping KPI Dashboard in Google Sheets
KPI Trend Sheet Tab
The KPI Trend Sheet provides deep analysis for individual KPIs.
Features:
-
KPI selection dropdown in cell C3
Displays:
- KPI Group
- Unit
- KPI Type (LTB / UTB)
- Formula
- Definition
Monthly trend chart for the selected KPI
This sheet helps teams identify long-term behavior patterns and improvement opportunities.

Click to Buy Customer Journey Mapping KPI Dashboard in Google Sheets
Actual Number Sheet Tab
This sheet captures actual performance values.
How it works:
- Select the first month of the year in cell E1
- Enter MTD and YTD values for each KPI
- All dashboards and trends update automatically
This ensures accurate and consistent data entry.

Target Sheet Tab
The Target Sheet stores benchmark values.
Purpose:
-
Define monthly and annual goals
-
Compare performance against business expectations
-
Drive accountability and improvement
Targets can differ by KPI depending on strategic priorities.

Click to Buy Customer Journey Mapping KPI Dashboard in Google Sheets
Previous Year Number Sheet Tab
This sheet stores historical KPI values.
Benefits:
-
Enables year-over-year comparison
-
Shows improvement or decline clearly
-
Supports long-term experience analysis

KPI Definition Sheet Tab
This is the backbone of the entire dashboard.
It contains:
- KPI Name
- KPI Group
- Unit
- Formula
- Definition
- KPI Type (Lower the Better / Upper the Better)
Any update here automatically reflects across all sheets.

Click to Buy Customer Journey Mapping KPI Dashboard in Google Sheets
Advantages of Customer Journey Mapping KPI Dashboard
- Improves visibility across the full customer lifecycle
- Identifies friction points early
- Supports data-driven CX decisions
- Aligns marketing, sales, and support teams
- Tracks performance against targets clearly
- Requires no complex software
Opportunities for Improvement
Click to Buy Customer Journey Mapping KPI Dashboard in Google Sheets
- Add stage-wise journey scoring
- Integrate CRM data automatically
- Include persona-based analysis
- Add sentiment analysis KPIs
- Track omnichannel engagement
- Implement predictive churn indicators
Best Practices for Using the Dashboard
- Update actuals consistently every month
- Set realistic but challenging targets
- Review KPI trends quarterly
- Focus on journey stages with high drop-off
- Train teams on KPI definitions
- Use insights to redesign customer processes
Conclusion
Click to Buy Customer Journey Mapping KPI Dashboard in Google Sheets
A Customer Journey Mapping KPI Dashboard in Google Sheets helps organizations understand customers beyond transactions. It turns interactions into insights and insights into actions. With structured KPIs, monthly tracking, and trend analysis, teams gain clarity and control over customer experience.
Because the dashboard is easy to use, scalable, and data-driven, it becomes an essential tool for marketing, sales, customer success, and leadership teams aiming to deliver exceptional customer journeys.
Frequently Asked Questions (FAQs)
Q1. Who should use this dashboard?
Marketing teams, CX teams, sales leaders, and customer success managers.
Q2. Can KPIs be customized?
Yes, all KPIs are fully editable.
Q3. Is Google Sheets suitable for large data?
Yes, with proper structure and periodic archiving.
Q4. Does it support MTD and YTD tracking?
Yes, both are built into the dashboard.
Q5. Can I add automation later?
Yes, Google Apps Script can enhance automation.
Visit our YouTube channel to learn step-by-step video tutorials
Youtube.com/@NeotechNavigators
Watch the step-by-step video tutorial:
Click to Buy Customer Journey Mapping KPI Dashboard in Google Sheets