In today’s competitive business environment, customer advocacy plays a critical role in sustainable growth. When customers actively promote your brand, recommend your products, and share positive experiences, your marketing costs reduce and trust increases naturally. However, many organizations struggle to measure and manage customer advocacy because data remains scattered across surveys, CRM systems, and social platforms.Customer Advocacy KPI Dashboard in Google Sheets
That is exactly why a Customer Advocacy KPI Dashboard in Google Sheets becomes an essential solution.
This ready-to-use dashboard helps businesses track advocacy performance using structured KPIs, monthly and yearly comparisons, and trend analysis. Moreover, because it runs entirely in Google Sheets, it stays simple, collaborative, and cost-effective.Customer Advocacy KPI Dashboard in Google Sheets
In this article, we explain what the dashboard is, how it works, its worksheet structure, all KPIs with units and formulas, advantages, opportunities for improvement, best practices, and frequently asked questions.Customer Advocacy KPI Dashboard in Google Sheets
What Is a Customer Advocacy KPI Dashboard in Google Sheets?
Click to Buy Customer Advocacy KPI Dashboard in Google Sheets
A Customer Advocacy KPI Dashboard is a centralized analytics tool that tracks how strongly customers support, promote, and recommend your brand. Instead of reviewing raw survey data or scattered reports, this dashboard converts advocacy metrics into actionable insights.
Because it uses Google Sheets, teams can:
-
Update data easily
-
Track performance in real time
-
Collaborate across departments
-
Compare MTD, YTD, and previous-year performance
-
Identify trends and gaps quickly
As a result, leadership teams gain full visibility into advocacy health and improvement areas.
Key Features of the Customer Advocacy KPI Dashboard
This dashboard includes 6 structured worksheets, each designed for a specific purpose.
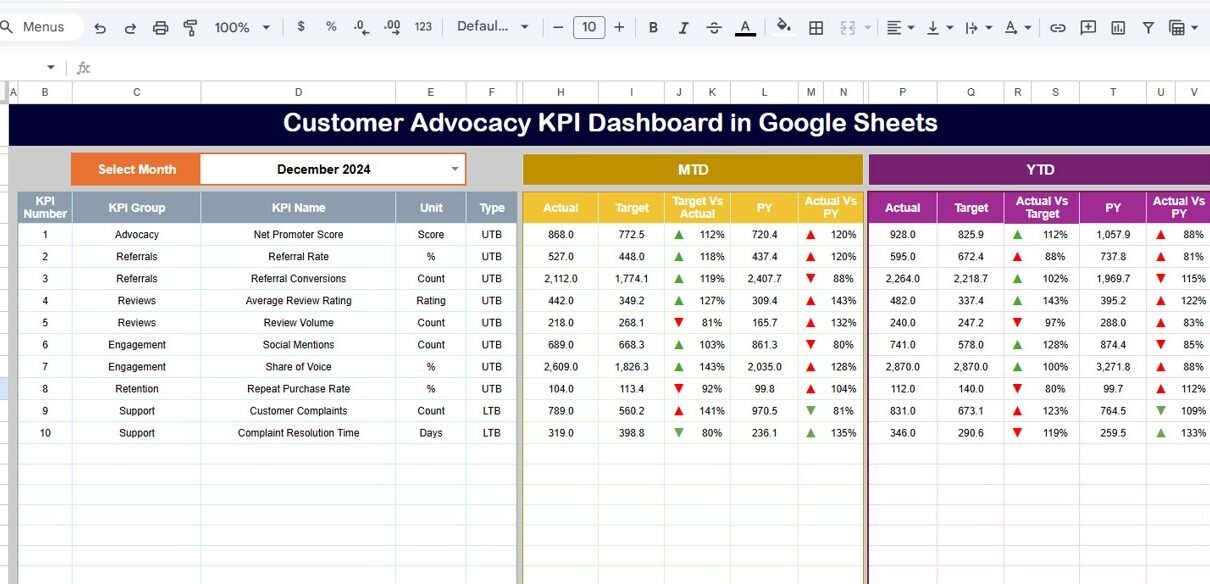
Dashboard Sheet Tab (Main Page)
This is the primary analysis page.
-
On cell D3, you select the month from a dropdown
-
All KPI values update automatically for the selected month
Metrics Displayed
MTD (Month-to-Date):
-
Actual
-
Target
-
Previous Year
-
Target vs Actual
-
PY vs Actual
YTD (Year-to-Date):
-
Actual
-
Target
-
Previous Year
-
Target vs Actual
-
PY vs Actual
Conditional formatting arrows make insights instant:
-
🔼 Green = improvement
-
🔽 Red = decline
This page is ideal for leadership reviews and monthly performance tracking.

Click to Buy Customer Advocacy KPI Dashboard in Google Sheets
KPI Trend Sheet Tab
This sheet focuses on deep KPI analysis.
-
Select KPI name from dropdown in cell C3
Automatically displays:
- KPI Group
- Unit
- KPI Type (Lower the Better / Upper the Better)
- Formula
- Definition
Additionally, month-wise trend charts help teams understand long-term advocacy movement.

Click to Buy Customer Advocacy KPI Dashboard in Google Sheets
Actual Number Sheet Tab
This sheet captures actual performance data.
-
Enter the first month of the year in cell E1
-
Input MTD and YTD actual values for each KPI
-
The dashboard updates automatically
This ensures data entry stays simple and structured.

Target Sheet Tab
This sheet stores performance targets.
-
Monthly (MTD) targets
-
Yearly (YTD) targets
Targets help teams measure success and drive continuous improvement.

Click to Buy Customer Advocacy KPI Dashboard in Google Sheets
Previous Year Number Sheet Tab
This sheet contains previous year KPI values.
It allows:
-
Year-over-year comparison
-
Performance benchmarking
-
Trend evaluation

Click to Buy Customer Advocacy KPI Dashboard in Google Sheets
KPI Definition Sheet Tab
This is the reference sheet where you define:
-
KPI Name
-
KPI Group
-
Unit
-
Formula
-
KPI Definition
-
KPI Type (LTB / UTB)
This ensures clarity, consistency, and easy onboarding for new users.

Click to Buy Customer Advocacy KPI Dashboard in Google Sheets
Advantages of the Customer Advocacy KPI Dashboard
-
Centralized advocacy tracking
-
Clear MTD and YTD visibility
-
Improved customer trust measurement
-
Better referral and review analysis
-
Faster decision-making
-
Easy collaboration in Google Sheets
-
No expensive BI tools required
Opportunities for Improvement in Customer Advocacy
Click to Buy Customer Advocacy KPI Dashboard in Google Sheets
-
Integrate CRM and survey tools
-
Add influencer-level advocacy metrics
-
Track campaign-wise advocacy ROI
-
Include sentiment analysis scoring
-
Automate data imports using Apps Script
Best Practices for Using the Dashboard
-
Update advocacy data monthly
-
Set realistic but challenging targets
-
Monitor trends, not only monthly values
-
Train teams on KPI definitions
-
Use previous-year comparison for strategy reviews
-
Protect customer data using access controls
Conclusion
Click to Buy Customer Advocacy KPI Dashboard in Google Sheets
A Customer Advocacy KPI Dashboard in Google Sheets helps organizations transform loyal customers into strong brand ambassadors. With structured KPIs, automated comparisons, and trend analysis, teams gain complete visibility into advocacy performance. Because the dashboard is simple, flexible, and collaborative, it becomes an ideal solution for marketing, customer success, and leadership teams.
When organizations track advocacy correctly, they build trust, reduce acquisition costs, and drive long-term growth.
Frequently Asked Questions (FAQs)
1. Who should use this dashboard?
Marketing teams, customer success teams, and leadership.
2. Can I customize KPIs?
Yes, all KPIs are editable in the KPI Definition sheet.
3. Does it support year-over-year comparison?
Yes, through the Previous Year Number sheet.
4. Is Google Sheets secure for this data?
Yes, with proper access permissions.
5. Can this dashboard scale for large businesses?
Yes, with structured data and automation.
6. Do I need technical skills to use it?
No, basic Google Sheets knowledge is enough.
Visit our YouTube channel to learn step-by-step video tutorials
Youtube.com/@NeotechNavigators
Watch the step-by-step video tutorial:
Click to Buy Customer Advocacy KPI Dashboard in Google Sheets