Employee engagement directly impacts productivity, retention, and overall business success. However, many organizations struggle to measure engagement consistently because data stays scattered across surveys, spreadsheets, and HR systems. As a result, leadership teams often make decisions without a clear understanding of how employees truly feel.HR Engagement Performance Dashboard in Google Sheets
An HR Engagement Performance Dashboard in Google Sheets solves this problem. It provides a centralized, visual, and data-driven view of employee satisfaction, engagement, training, recognition, and participation. Because the dashboard is ready to use and built in Google Sheets, HR teams can start tracking engagement immediately without expensive software or complex setup.HR Engagement Performance Dashboard in Google Sheets
In this article, we explain how the HR Engagement Performance Dashboard works, what insights each section delivers, and how HR teams can use it to build a more engaged and motivated workforce.HR Engagement Performance Dashboard in Google Sheets
What Is an HR Engagement Performance Dashboard in Google Sheets?
An HR Engagement Performance Dashboard is a visual reporting tool that tracks employee engagement metrics in one place. It converts raw HR data into charts, KPIs, and trends that help HR leaders understand employee sentiment, involvement, and development.HR Engagement Performance Dashboard in Google Sheets
Since the dashboard runs in Google Sheets, it offers:
- Real-time updates
- Easy collaboration
- Cloud accessibility
- No technical dependency
- Full customization
This dashboard supports HR teams, people managers, and leadership by providing clear engagement insights across employees, roles, departments, locations, and time periods.HR Engagement Performance Dashboard in Google Sheets
Why Employee Engagement Tracking Matters
Click to Buy HR Engagement Performance Dashboard in Google Sheets
Employee engagement affects almost every HR outcome. When engagement drops, productivity declines, attrition risk increases, and morale weakens. Therefore, organizations must track engagement consistently and act early.
This dashboard helps organizations:
- Measure employee satisfaction accurately
- Track engagement score trends
- Monitor training and recognition activity
- Identify disengaged employees early
- Support data-driven HR decisions
As a result, HR teams move from assumptions to insights.
Dashboard Structure Overview
The HR Engagement Performance Dashboard in Google Sheets contains the following major sections:
- Overview Sheet
- Job Role Analysis
- Department Analysis
- Location Analysis
- Monthly Trend Analysis
- Search Functionality
- Data Sheet
Each section focuses on a specific engagement dimension and provides actionable insights.
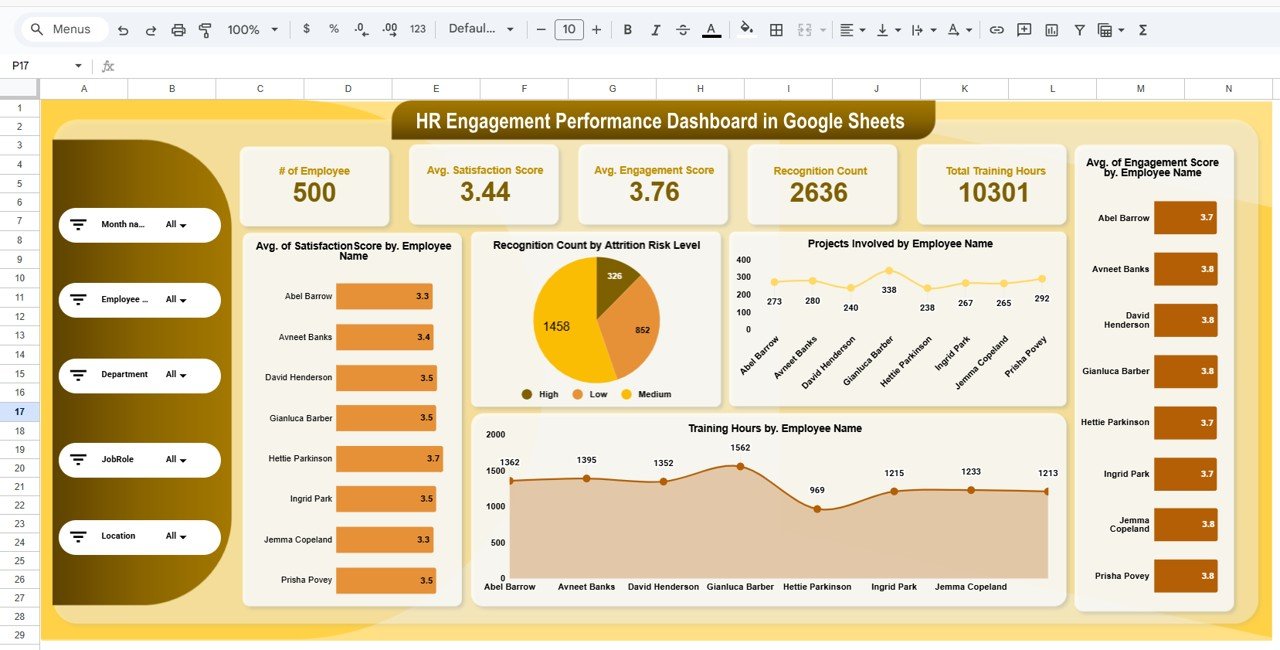
Overview Sheet Tab
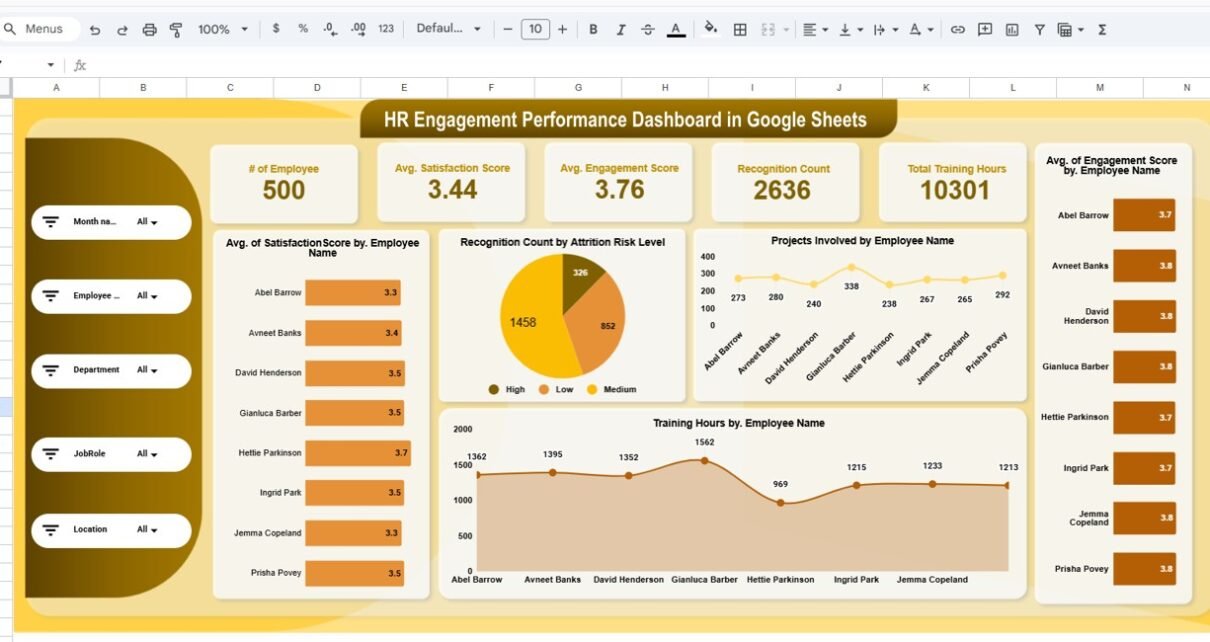
The Overview Sheet gives a high-level snapshot of employee engagement performance. HR leaders usually start their analysis here.
Key KPI Cards in the Overview
The dashboard displays the following KPI cards at the top:
-
# of Employees – Total employees included in engagement tracking
-
Average Satisfaction Score – Overall satisfaction level across employees
-
Average Engagement Score – Measures involvement and commitment
-
Recognition Count – Total recognitions received by employees
-
Total Training Hours – Combined training hours completed
These KPIs help leadership quickly assess the overall engagement health of the organization.
Overview Charts Explained
Average Satisfaction Score by Employee Name
This chart highlights how each employee rates their satisfaction. It helps HR identify both highly satisfied and disengaged individuals.
Recognition Count by Attrition Risk Level
This visual shows how recognition varies across attrition risk categories. Lower recognition often correlates with higher attrition risk.
Projects Involved by Employee Name
This chart reveals employee involvement across projects. Highly engaged employees typically participate in more initiatives.
Training Hours by Employee Name
This chart helps HR understand learning engagement at the individual level.
Together, these charts provide a strong foundation for engagement analysis.
Click to Buy HR Engagement Performance Dashboard in Google Sheets
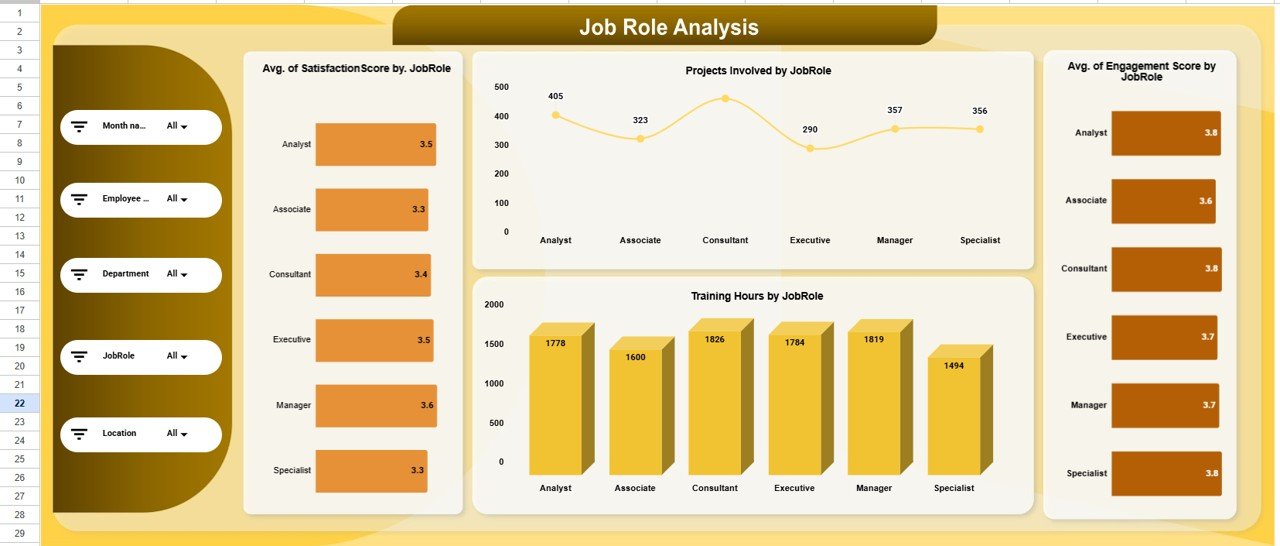
Job Role Analysis
The Job Role Analysis section evaluates engagement performance by job role. Since responsibilities differ by role, engagement patterns often vary.
Charts in Job Role Analysis
Average Satisfaction Score by Job Role
This chart compares satisfaction levels across roles. HR teams can identify roles that require intervention.
Projects Involved by Job Role
This visualization highlights how involvement differs by role.
Average Engagement Score by Job Role
This chart reveals which roles feel most connected to the organization.
Training Hours by Job Role
This chart shows whether training opportunities distribute evenly across roles.
Job role analysis supports better role-specific engagement strategies.
Click to Buy HR Engagement Performance Dashboard in Google Sheets
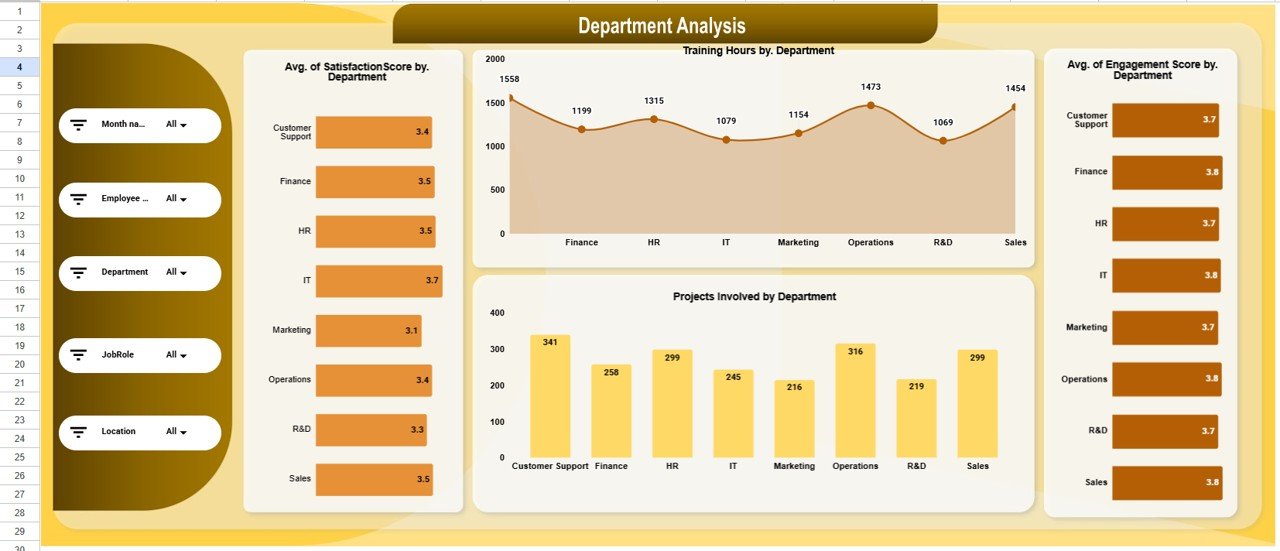
Department Analysis
Departments often show unique engagement patterns due to leadership style, workload, or culture. Therefore, department-level insights are critical.
Department Analysis Charts
Average Satisfaction Score by Department
This chart helps HR identify departments with low morale.
Training Hours by Department
This visualization shows learning investment by department.
Average Engagement Score by Department
This chart highlights how connected employees feel within each department.
Projects Involved by Department
This chart shows participation and collaboration levels across departments.
Department analysis helps leadership target engagement initiatives where they matter most.
Click to Buy HR Engagement Performance Dashboard in Google Sheets
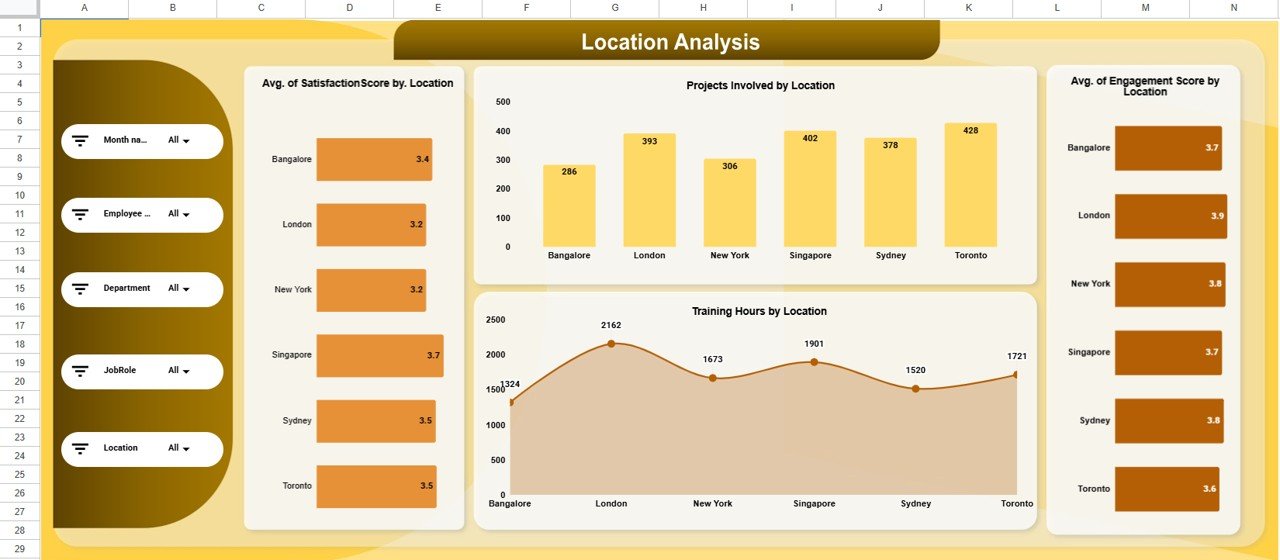
Location Analysis
For organizations with multiple locations, engagement levels often vary. The Location Analysis section highlights these differences.
Location Analysis Charts
Average Satisfaction Score by Location
This chart compares satisfaction across offices or regions.
Projects Involved by Location
This visualization shows collaboration intensity by location.
Average Engagement Score by Location
This chart identifies locations with engagement challenges.
Training Hours by Location
This chart reveals learning access and adoption by location.
Location-based insights support region-specific engagement planning.
Click to Buy HR Engagement Performance Dashboard in Google Sheets
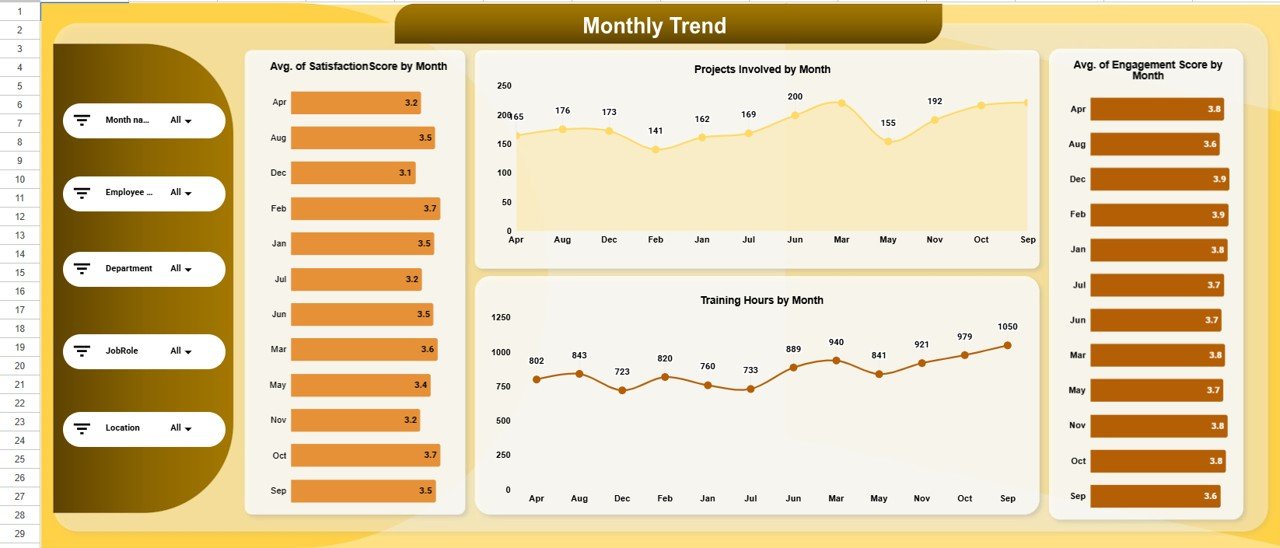
Monthly Trend Analysis
Engagement changes over time. Therefore, trend analysis plays a vital role in understanding improvement or decline.
Monthly Trend Charts
Average Satisfaction Score by Month
This chart shows how satisfaction evolves month over month.
Projects Involved by Month
This visualization highlights participation trends.
Average Engagement Score by Month
This chart helps HR track engagement impact of initiatives.
Training Hours by Month
This chart reflects learning consistency across the year.
Monthly trends allow HR teams to measure the effectiveness of engagement programs.
Click to Buy HR Engagement Performance Dashboard in Google Sheets
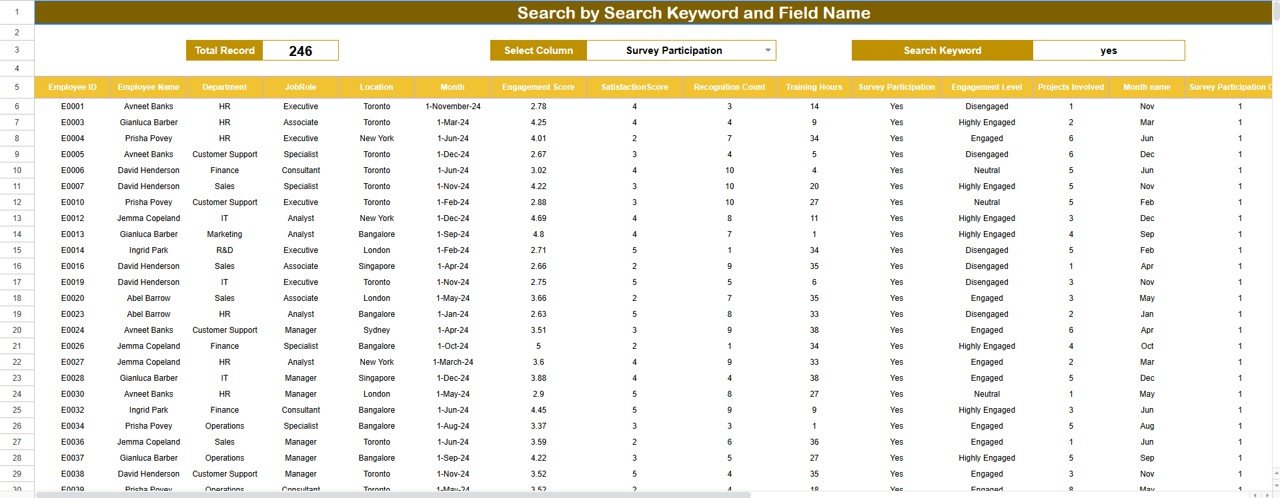
Search Functionality – Find Records Instantly
The dashboard includes a powerful Search Panel that allows users to search data using:
-
Search Keyword
-
Field Name (Employee Name, Department, Job Role, Location, Month, etc.)
This feature helps HR teams:
- Locate specific employee records quickly
- Prepare performance or engagement discussions
- Support audits and reviews
- Reduce time spent filtering data manually
The search tool improves productivity and usability.
Click to Buy HR Engagement Performance Dashboard in Google Sheets
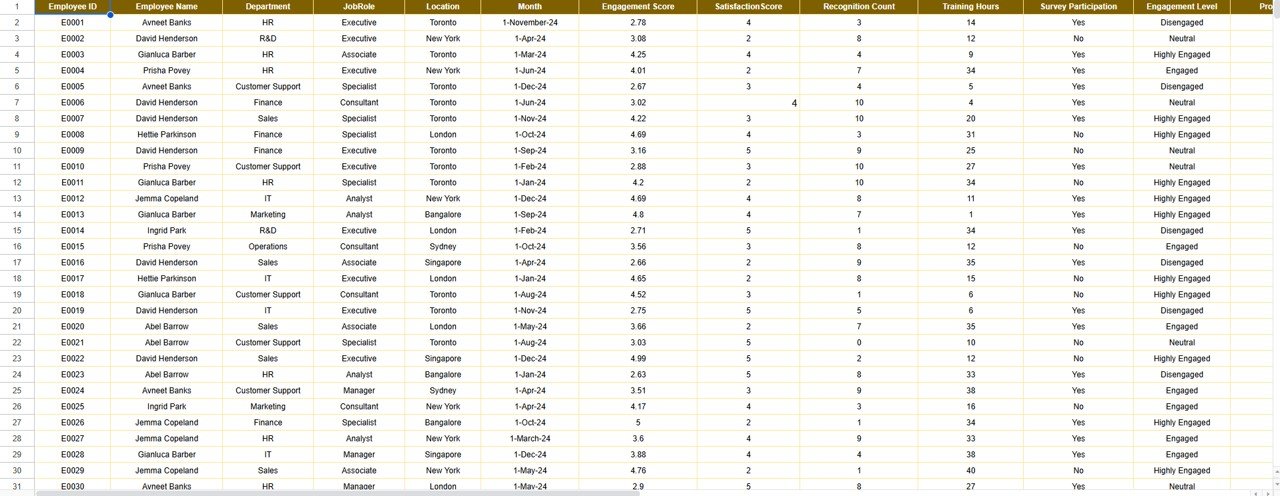
Data Sheet
The Data Sheet stores all raw engagement data, including:
- Employee Name
- Department
- Job Role
- Location
- Satisfaction Score
- Engagement Score
- Recognition Count
- Training Hours
- Projects Involved
- Attrition Risk Level
- Month
All dashboard charts and KPIs automatically update based on this data.
Click to Buy HR Engagement Performance Dashboard in Google Sheets
Advantages of the HR Engagement Performance Dashboard
1. Centralized Engagement Visibility
All engagement metrics remain in one place.
2. Real-Time Insights
Charts update instantly as data changes.
3. Improved Retention Strategy
Early engagement signals help reduce attrition.
4. Better HR Decision-Making
Data replaces assumptions.
5. Easy to Use
No technical or BI skills required.
6. Fully Customizable
Organizations can add or modify metrics easily.
Opportunities for Improvement
Although the dashboard is powerful, organizations can enhance it further by adding:
- Attrition prediction indicators
- Pulse survey integration
- Engagement score benchmarks
- Automated alerts for low engagement
- Individual development plan tracking
These improvements increase strategic HR value.
Best Practices for Using the Dashboard
Click to Buy HR Engagement Performance Dashboard in Google Sheets
- Update engagement data monthly
- Standardize scoring criteria
- Combine survey data with performance data
- Review department trends quarterly
- Use insights during leadership reviews
- Protect employee data with access controls
Following these practices ensures reliable insights.
Conclusion
The HR Engagement Performance Dashboard in Google Sheets empowers HR teams to track, analyze, and improve employee engagement with clarity and confidence. It transforms raw HR data into meaningful insights across employees, roles, departments, locations, and time. Because the dashboard is ready to use, cloud-based, and highly visual, it becomes an essential tool for modern HR management.
By using this dashboard consistently, organizations create a more engaged workforce, reduce attrition risk, and foster a stronger workplace culture.HR Engagement Performance Dashboard in Google Sheets
Frequently Asked Questions (FAQs)
Click to Buy HR Engagement Performance Dashboard in Google Sheets
Who should use this dashboard?
HR teams, people managers, and leadership teams.
Can I customize the engagement metrics?
Yes, the dashboard is fully editable.
Is Google Sheets secure for HR data?
Yes, with proper access control and permissions.
How often should engagement data be updated?
Monthly or quarterly, depending on HR strategy.
Does it support remote teams?
Yes, Google Sheets works perfectly for remote and hybrid teams.
Visit our YouTube channel to learn step-by-step video tutorials
Youtube.com/@NeotechNavigators
Watch the step-by-step video tutorial:
Click to Buy HR Engagement Performance Dashboard in Google Sheets