Regulatory reporting is a critical responsibility for every organization operating in regulated industries such as banking, insurance, healthcare, utilities, telecom, and financial services. Regulatory bodies expect accurate, timely, and compliant reports. However, many organizations still rely on manual spreadsheets, emails, and fragmented systems. As a result, reporting delays, errors, and compliance risks increase.
A Regulatory Reporting KPI Dashboard in Google Sheets solves this problem by providing a centralized, structured, and ready-to-use solution. This dashboard helps compliance teams track reporting timelines, accuracy, submission status, penalties, and audit readiness using clear KPIs and visual indicators.
In this article, we explain how the dashboard works, what KPIs it includes, how each worksheet supports compliance tracking, and how organizations can improve regulatory reporting performance using this dashboard.
What Is a Regulatory Reporting KPI Dashboard in Google Sheets?
Click to Buy Regulatory Reporting KPI Dashboard in Google Sheets
A Regulatory Reporting KPI Dashboard is a performance-tracking tool designed to monitor regulatory submissions, compliance quality, deadlines, penalties, and audit outcomes. Instead of tracking reports manually, this dashboard converts regulatory data into measurable KPIs and actionable insights.
Because it is built in Google Sheets, the dashboard offers:
- Real-time collaboration
- Automatic calculations
- Easy month-wise analysis
- MTD and YTD performance tracking
- Zero software cost
Compliance teams, risk managers, internal auditors, and senior management use this dashboard to ensure regulatory obligations are met consistently.
Key Features of the Regulatory Reporting KPI Dashboard
This dashboard is designed as a ready-to-use system with structured data flow and automated calculations.
Monthly & Year-to-Date tracking
Target vs Actual comparison
Previous year benchmarking
Conditional formatting with up/down arrows
KPI trend analysis
Central KPI definition repository
Dashboard Structure – 6 Worksheet Tabs Explained
Click to Buy Regulatory Reporting KPI Dashboard in Google Sheets
The Regulatory Reporting KPI Dashboard consists of 6 core worksheets, each with a specific purpose.
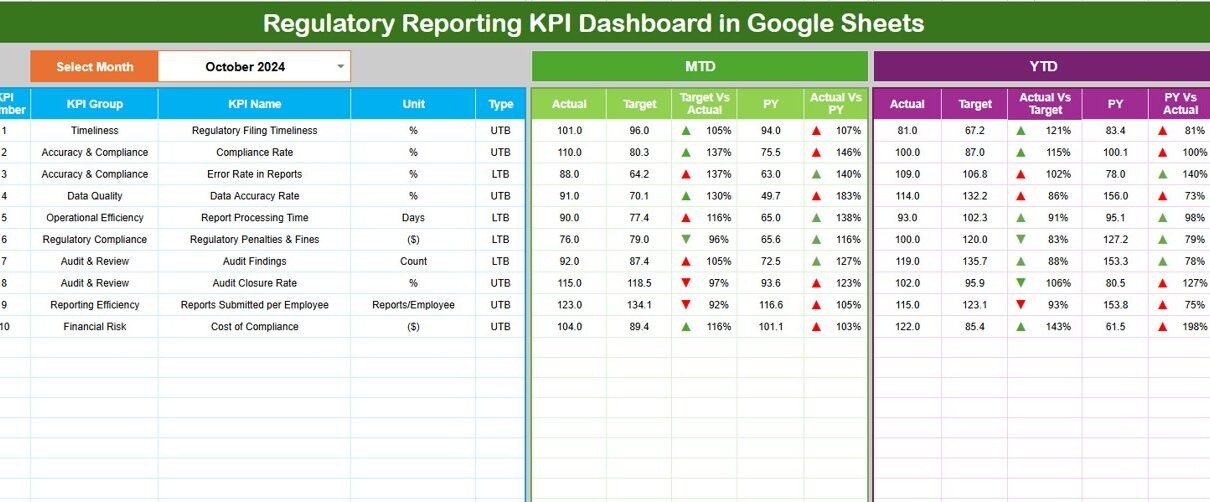
Dashboard Sheet Tab (Main Sheet)
This is the primary view for leadership and compliance reviews.
🔹 Month Selector
-
Located in cell D3
-
Selecting a month automatically updates all KPIs
MTD Metrics Displayed
-
MTD Actual
-
MTD Target
-
MTD Previous Year
-
Target vs Actual
-
Previous Year vs Actual
YTD Metrics Displayed
-
YTD Actual
-
YTD Target
-
YTD Previous Year
-
Target vs Actual
-
Previous Year vs Actual
Visual Indicators
-
Green arrow → positive compliance trend
-
Red arrow → compliance risk or delay
This sheet gives an instant overview of regulatory performance.

Click to Buy Regulatory Reporting KPI Dashboard in Google Sheets
KPI Trend Sheet Tab
This sheet helps analyze one KPI at a time.
KPI Selection
-
Dropdown available in cell C3
KPI Details Displayed
-
KPI Group
-
KPI Unit
-
KPI Type (LTB or UTB)
-
KPI Formula
-
KPI Definition
Trend Visualization
-
Month-wise KPI trend
-
Performance fluctuations
-
Early warning signs
This sheet supports detailed compliance reviews and audits.

Click to Buy Regulatory Reporting KPI Dashboard in Google Sheets
Actual Number Sheet Tab
This sheet is used for data entry.
🔹 What You Enter
-
Monthly MTD Actual values
-
YTD Actual values
🔹 Month Setup
-
Select the first month of the year in cell E1
All dashboard values update automatically after data entry.

Target Sheet Tab
This sheet stores regulatory performance targets.
🔹 Targets Tracked
-
Monthly (MTD) targets
-
Annual (YTD) targets
Targets help teams measure performance against compliance goals.

Click to Buy Regulatory Reporting KPI Dashboard in Google Sheets
Previous Year Number Sheet Tab
This sheet stores last year’s regulatory performance.
🔹 Purpose
-
Year-over-year comparison
-
Trend improvement analysis
-
Regulatory maturity assessment

KPI Definition Sheet Tab
This is the control sheet for governance.
Stores:
-
KPI Name
-
KPI Group
-
Unit
-
Formula
-
KPI Definition
-
KPI Type (LTB / UTB)
This ensures KPI clarity, consistency, and audit readiness.

Click to Buy Regulatory Reporting KPI Dashboard in Google Sheets
Advantages of the Regulatory Reporting KPI Dashboard
Improves regulatory compliance visibility
Reduces risk of penalties and fines
Enhances audit preparedness
Tracks performance trends clearly
Saves time through automation
Improves accountability across teams
Opportunities for Improvement
Organizations can enhance the dashboard by adding:
-
SLA breach alerts
-
Automated reminders via Apps Script
-
Department-wise compliance KPIs
-
Risk scoring models
-
Regulator-wise reporting analysis
Best Practices for Using the Dashboard
Click to Buy Regulatory Reporting KPI Dashboard in Google Sheets
-
Update data monthly without delays
-
Review trends, not only single months
-
Maintain accurate KPI definitions
-
Train compliance teams on KPI meaning
-
Perform quarterly compliance reviews
Conclusion
A Regulatory Reporting KPI Dashboard in Google Sheets provides organizations with a powerful, flexible, and cost-effective solution for managing regulatory compliance. It improves reporting accuracy, reduces risks, and supports proactive decision-making. With structured KPIs, automated calculations, and trend analysis, this dashboard becomes an essential tool for modern compliance and risk management teams.
Frequently Asked Questions (FAQs)
Click to Buy Regulatory Reporting KPI Dashboard in Google Sheets
1. Who should use this dashboard?
Compliance teams, risk managers, auditors, and leadership.
2. Is Google Sheets secure for regulatory data?
Yes, with proper access controls.
3. Can KPIs be customized?
Yes, all KPIs are editable.
4. Does it support audits?
Yes, it improves audit readiness.
5. Can it track multiple regulators?
Yes, by adding regulator fields.
Visit our YouTube channel to learn step-by-step video tutorials
Youtube.com/@NeotechNavigators
Watch the step-by-step video tutorial:
Click to Buy Regulatory Reporting KPI Dashboard in Google Sheets