During emergencies, incidents, or unexpected disruptions, organizations must respond quickly, accurately, and efficiently. Whether it is a natural disaster, IT outage, security incident, health emergency, or operational crisis, decision-makers need real-time visibility into response performance. However, many teams still rely on manual reports, scattered spreadsheets, or delayed updates, which slow down critical actions.
That is where a Crisis Response KPI Dashboard in Google Sheets becomes essential.
This ready-to-use dashboard provides a structured way to track crisis response performance using well-defined KPIs, automated calculations, trend analysis, and performance comparisons. It enables leadership, risk teams, and operations managers to measure response speed, resolution effectiveness, and preparedness—without complex software.
In this article, you will learn what this dashboard is, how it works, which KPIs it includes, how each worksheet functions, and how organizations can use it to strengthen crisis management.
What Is a Crisis Response KPI Dashboard in Google Sheets?
Click to Buy Crisis Response KPI Dashboard in Google Sheets
A Crisis Response KPI Dashboard is a performance monitoring system designed to track how effectively an organization responds to crisis situations. It measures response time, resolution quality, resource usage, communication effectiveness, and recovery outcomes.
Because this dashboard is built in Google Sheets, it offers:
- Real-time collaboration
- Automatic KPI calculations
- Month-to-date (MTD) and year-to-date (YTD) tracking
- Target vs actual analysis
- Previous-year comparison
- Visual indicators for quick decisions
This dashboard becomes a central control panel during audits, drills, and real crisis events.
Key Features of the Crisis Response KPI Dashboard
This dashboard is designed with 6 structured worksheets, each serving a specific purpose in crisis monitoring and analysis.
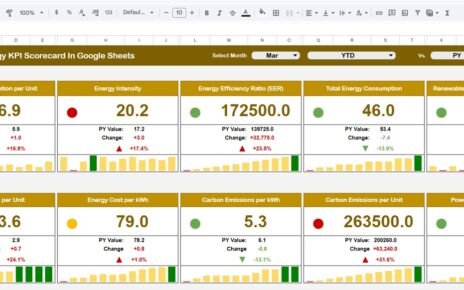
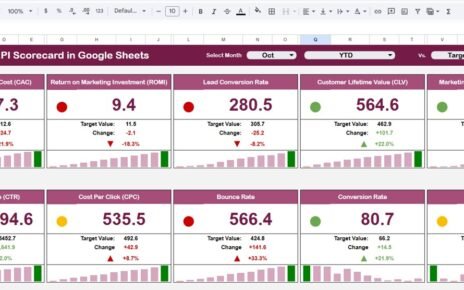
1. Dashboard Sheet Tab (Main Dashboard)
The Dashboard Sheet is the primary performance view.
Month Selector
-
Cell D3 allows you to select the month.
-
All KPIs update automatically when the month changes.
MTD Analysis
- MTD Actual
- MTD Target
- MTD Previous Year
- Target vs Actual
- Previous Year vs Actual
YTD Analysis
- YTD Actual
- YTD Target
- YTD Previous Year
- Target vs Actual
- Previous Year vs Actual
Conditional formatting with up/down arrows highlights performance trends:
-
Green arrow → improvement
-
Red arrow → decline
This page gives leaders instant clarity during crisis reviews.

Click to Buy Crisis Response KPI Dashboard in Google Sheets
2. KPI Trend Sheet Tab
This sheet focuses on one KPI at a time.
How It Works
-
Select the KPI name from the dropdown in cell C3
The sheet displays:
- KPI Group
- KPI Unit
- KPI Type (Lower the Better / Upper the Better)
- KPI Formula
- KPI Definition
Trend charts show monthly movement, making it easier to identify patterns and response gaps.

Click to Buy Crisis Response KPI Dashboard in Google Sheets
3. Actual Number Sheet Tab
This is the data-entry sheet for actual performance values.
Features
-
Enter MTD and YTD actual values
-
Select the first month of the year in cell E1
-
All calculations adjust automatically
This ensures consistent data capture throughout the year.

Click to Buy Crisis Response KPI Dashboard in Google Sheets
4. Target Sheet Tab
This sheet stores planned or expected KPI values.
Why It Matters
-
Helps define response benchmarks
-
Enables performance comparison
-
Supports accountability
Targets can be updated monthly or annually based on organizational goals.

5. Previous Year Number Sheet Tab
This sheet stores historical KPI values from the previous year.
Benefits
-
Enables year-over-year analysis
-
Shows maturity in crisis handling
-
Helps assess improvement initiatives

Click to Buy Crisis Response KPI Dashboard in Google Sheets
6. KPI Definition Sheet Tab
This is the foundation of the entire dashboard.
It contains:
- KPI Name
- KPI Group
- Unit
- Formula
- Definition
- KPI Type (LTB / UTB)
This sheet ensures clarity and consistency for all stakeholders.

Click to Buy Crisis Response KPI Dashboard in Google Sheets
Why Organizations Need a Crisis Response KPI Dashboard
Organizations face growing operational, environmental, and cyber risks. A structured dashboard helps:
-
Improve response speed
-
Reduce downtime
-
Strengthen accountability
-
Enhance preparedness
-
Support audits and compliance
-
Improve leadership decision-making
Without KPIs, crisis management remains reactive instead of proactive.
Advantages of the Crisis Response KPI Dashboard
Click to Buy Crisis Response KPI Dashboard in Google Sheets
-
Centralized crisis performance tracking
-
Faster, data-driven decisions
-
Real-time KPI visibility
-
Improved SLA compliance
-
Stronger risk governance
-
Easy collaboration across teams
-
No complex tools required
Opportunities for Improvement
Organizations can enhance this dashboard by adding:
-
Automated alerts for SLA breaches
-
Drill vs real-incident comparison
-
Incident severity classification
-
Department-level performance views
-
Integration with ticketing systems
-
Predictive risk indicators
Best Practices for Using the Dashboard
Click to Buy Crisis Response KPI Dashboard in Google Sheets
-
Update KPI data consistently
-
Review trends monthly
-
Set realistic but challenging targets
-
Train teams on KPI definitions
-
Use historical comparisons for learning
-
Include dashboard insights in crisis reviews
Conclusion
A Crisis Response KPI Dashboard in Google Sheets gives organizations a reliable and scalable way to monitor emergency response performance. It transforms scattered crisis data into structured insights, enabling faster action, better preparedness, and continuous improvement.
Because it is simple, flexible, and collaborative, this dashboard fits organizations of any size. With the right KPIs and disciplined tracking, teams can reduce risk impact, protect operations, and build a resilient crisis response framework.
Frequently Asked Questions (FAQs)
Click to Buy Crisis Response KPI Dashboard in Google Sheets
1. Who should use a Crisis Response KPI Dashboard?
Risk teams, operations leaders, IT teams, compliance teams, and executive management.
2. Can this dashboard handle different crisis types?
Yes, it supports IT, security, operational, and safety incidents.
3. Is Google Sheets secure for crisis data?
Yes, with proper access controls and permissions.
4. Can KPIs be customized?
Yes, the KPI Definition sheet allows full customization.
5. Does it support audits and reporting?
Yes, it provides structured historical performance data.
Visit our YouTube channel to learn step-by-step video tutorials
Youtube.com/@NeotechNavigators
Watch the step-by-step video tutorial: