Every successful sales organization depends on a well-managed sales funnel. Leads enter the funnel, opportunities move through stages, and deals close at the end. However, when sales data stays scattered across CRMs, spreadsheets, and emails, teams struggle to understand where deals slow down or drop off. As a result, revenue growth suffers.
That is exactly why a Sales Funnel KPI Dashboard in Google Sheets plays a critical role in modern sales management.
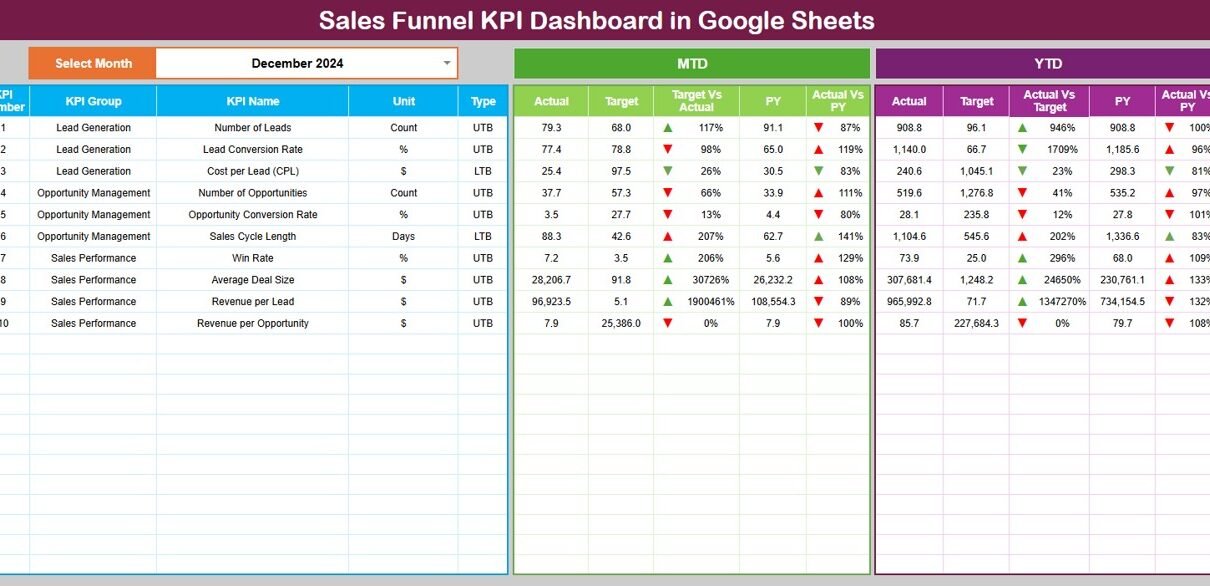
This ready-to-use dashboard transforms raw sales data into clear KPIs, trends, and comparisons. It helps sales leaders track performance at every funnel stage, identify bottlenecks early, and improve conversion rates consistently—without expensive tools.
In this article, you will learn what a Sales Funnel KPI Dashboard is, how it works, which KPIs it tracks, how each worksheet functions, its advantages, improvement opportunities, best practices, and frequently asked questions.
What Is a Sales Funnel KPI Dashboard in Google Sheets?
A Sales Funnel KPI Dashboard is a performance monitoring tool that tracks how leads move through each stage of the sales process. It measures lead generation, qualification, opportunity progress, conversion, and revenue outcomes.
Because this dashboard is built in Google Sheets, it offers:
- Real-time collaboration
- Automatic KPI calculations
- Month-to-Date (MTD) and Year-to-Date (YTD) tracking
- Target vs Actual comparison
- Previous year benchmarking
- Visual indicators for faster decisions
As a result, sales teams gain full visibility into funnel health and performance.
Key Features of the Sales Funnel KPI Dashboard
Click to Buy Sales Funnel KPI Dashboard in Google Sheets
This dashboard is structured with 6 well-organized worksheets, each designed to support accurate tracking and analysis.
1. Dashboard Sheet Tab (Main Dashboard)
The Dashboard Sheet acts as the control center.
Month Selection
-
Cell D3 contains a month dropdown.
-
All KPIs update automatically when the selected month changes.
MTD Performance View
-
Actual
-
Target
-
Previous Year
-
Target vs Actual
-
Previous Year vs Actual
YTD Performance View
-
Actual
-
Target
-
Previous Year
-
Target vs Actual
-
Previous Year vs Actual
Conditional formatting with up and down arrows highlights performance changes instantly:
-
Green arrow → improvement
-
Red arrow → decline
This view helps leadership review sales performance in seconds.

Click to Buy Sales Funnel KPI Dashboard in Google Sheets
2. KPI Trend Sheet Tab
The KPI Trend Sheet allows deep analysis of individual KPIs.
How It Works
Select a KPI from the dropdown in cell C3
The sheet displays:
- KPI Group
- KPI Unit
- KPI Type (Upper the Better / Lower the Better)
- KPI Formula
- KPI Definition
Trend charts show month-wise movement, making performance gaps easy to identify.

Click to Buy Sales Funnel KPI Dashboard in Google Sheets
3. Actual Number Sheet Tab
This sheet stores actual sales performance data.
Key Details
-
Enter MTD and YTD actual values
-
Set the first month of the year in cell E1
-
All KPIs update automatically
This structure ensures consistent and clean data entry.

Click to Buy Sales Funnel KPI Dashboard in Google Sheets
4. Target Sheet Tab
The Target Sheet defines sales goals.
Why Targets Matter
-
Measure success clearly
-
Align sales teams with revenue goals
-
Track progress objectively
Targets can be adjusted monthly or annually based on strategy.

Click to Buy Sales Funnel KPI Dashboard in Google Sheets
5. Previous Year Number Sheet Tab
This sheet stores last year’s performance data.
Benefits
-
Year-over-year comparison
-
Growth tracking
-
Seasonal performance insights
Historical data helps leadership evaluate long-term improvement.

Click to Buy Sales Funnel KPI Dashboard in Google Sheets
6. KPI Definition Sheet Tab
This sheet acts as the foundation of the dashboard.
It includes:
-
KPI Name
-
KPI Group
-
Unit
-
Formula
-
KPI Definition
-
KPI Type (UTB / LTB)
This ensures everyone interprets KPIs correctly.

Click to Buy Sales Funnel KPI Dashboard in Google Sheets
Advantages of Sales Funnel KPI Dashboard in Google Sheets
-
Centralized sales performance visibility
-
Faster decision-making
-
Improved lead conversion
-
Early identification of bottlenecks
-
Better target tracking
-
Easy collaboration across teams
-
No costly BI tools required
Opportunities for Improvement in Sales Funnel KPI Dashboard
Click to Buy Sales Funnel KPI Dashboard in Google Sheets
Although powerful, organizations can enhance the dashboard by:
-
Adding salesperson-level analysis
-
Integrating CRM data automatically
-
Tracking lead sources in more detail
-
Adding pipeline value forecasting
-
Including churn or loss reason analysis
Best Practices for Using the Sales Funnel KPI Dashboard
-
Update actual data regularly
-
Review KPIs weekly and monthly
-
Set realistic and data-driven targets
-
Monitor drop-off stages closely
-
Use historical data for forecasting
-
Train sales teams on KPI definitions
Conclusion
Click to Buy Sales Funnel KPI Dashboard in Google Sheets
A Sales Funnel KPI Dashboard in Google Sheets provides a structured and reliable way to track sales performance from lead generation to deal closure. It replaces guesswork with clear metrics, trends, and comparisons. Because it is flexible, collaborative, and easy to use, it suits businesses of all sizes.
With the right KPIs and disciplined tracking, this dashboard helps sales teams increase conversions, shorten sales cycles, and achieve revenue targets consistently.
Frequently Asked Questions (FAQs)
Click to Buy Sales Funnel KPI Dashboard in Google Sheets
1. Who should use a Sales Funnel KPI Dashboard?
Sales managers, revenue leaders, business owners, and operations teams.
2. Can this dashboard replace a CRM?
It complements CRMs by providing structured KPI analysis.
3. Does it support MTD and YTD tracking?
Yes, both MTD and YTD metrics are fully supported.
4. Can KPIs be customized?
Yes, the KPI Definition sheet allows full customization.
5. Is Google Sheets secure for sales data?
Yes, when proper access controls are applied.
Visit our YouTube channel to learn step-by-step video tutorials
Youtube.com/@NeotechNavigators
Watch the step-by-step video tutorial: