Procurement efficiency directly impacts cost control, supplier performance, and overall business profitability. Every delayed purchase order, missed saving opportunity, or inefficient vendor interaction increases operational risk. However, many procurement teams still rely on manual spreadsheets, static reports, or delayed summaries. As a result, decision-makers lack real-time visibility into procurement performance.Procurement Efficiency KPI Dashboard in Google Sheets
That is exactly why a Procurement Efficiency KPI Dashboard in Google Sheets becomes a critical performance management tool.
This ready-to-use dashboard converts procurement data into meaningful KPIs, trend analysis, and performance comparisons. It helps procurement leaders, finance teams, and operations managers track efficiency, reduce cycle time, and improve supplier outcomes—without expensive BI tools.Procurement Efficiency KPI Dashboard in Google Sheets
In this article, you will learn what this dashboard is, how it works, which KPIs it includes, how each worksheet functions, its advantages, opportunities for improvement, best practices, and frequently asked questions.Procurement Efficiency KPI Dashboard in Google Sheets
What Is a Procurement Efficiency KPI Dashboard in Google Sheets?
Click to Buy Procurement Efficiency KPI Dashboard in Google Sheets
A Procurement Efficiency KPI Dashboard is a structured analytics solution that measures how effectively procurement processes operate. It tracks purchase cycle time, cost savings, supplier performance, compliance, and delivery efficiency.
Because this dashboard is built in Google Sheets, it offers:
-
Real-time collaboration
-
Automatic KPI calculations
-
Month-to-Date (MTD) and Year-to-Date (YTD) tracking
-
Target vs Actual comparison
-
Previous year benchmarking
-
Visual indicators for quick decisions
As a result, procurement decisions become proactive and data-driven.
Key Features of the Procurement Efficiency KPI Dashboard
Click to Buy Procurement Efficiency KPI Dashboard in Google Sheets
This dashboard is designed with 6 structured worksheets, each serving a specific analytical purpose.
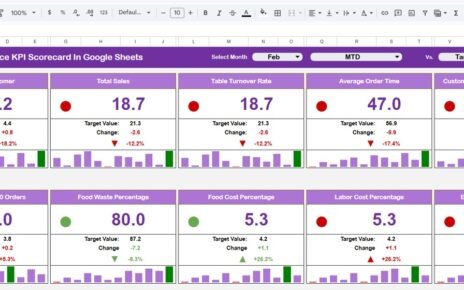
1. Dashboard Sheet Tab (Main Dashboard)
The Dashboard Sheet provides a consolidated view of all procurement KPIs.
Month Selection
-
Use the dropdown in cell D3 to select a month.
-
All KPI values update automatically based on the selected month.
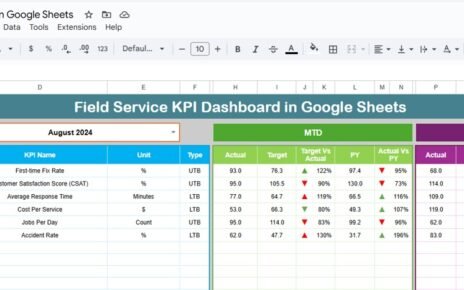
MTD Performance View
-
Actual
-
Target
-
Previous Year
-
Target vs Actual
-
Previous Year vs Actual
YTD Performance View
-
Actual
-
Target
-
Previous Year
-
Target vs Actual
-
Previous Year vs Actual
Conditional formatting with up and down arrows highlights performance changes instantly:
-
Green arrow → favorable performance
-
Red arrow → unfavorable performance
This sheet enables leadership to review procurement efficiency at a glance.

Click to Buy Procurement Efficiency KPI Dashboard in Google Sheets
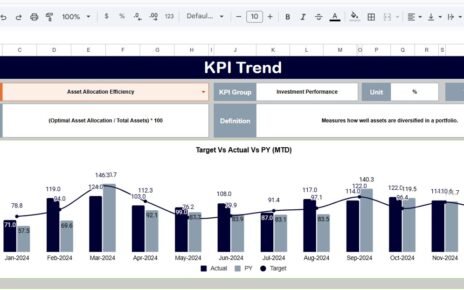
2. KPI Trend Sheet Tab
The KPI Trend Sheet allows detailed KPI analysis.
How It Works
-
Select a KPI from the dropdown in cell C3
The sheet displays:
- KPI Group
- KPI Unit
- KPI Type (Upper the Better / Lower the Better)
- KPI Formula
- KPI Definition
Trend charts show monthly movement, helping teams identify bottlenecks and improvement areas.

Click to Buy Procurement Efficiency KPI Dashboard in Google Sheets
3. Actual Number Sheet Tab
This sheet captures actual procurement performance values.
Key Details
-
Enter MTD and YTD actual values
-
Select the first month of the year in cell E1
-
All KPIs recalculate automatically
This ensures consistent and accurate data entry.

4. Target Sheet Tab
The Target Sheet defines expected procurement performance.
Why Targets Matter
-
Set efficiency benchmarks
-
Align procurement with cost-saving goals
-
Enable accountability
Targets can change monthly or annually based on strategy.

Click to Buy Procurement Efficiency KPI Dashboard in Google Sheets
5. Previous Year Number Sheet Tab
This sheet stores last year’s procurement performance data.
Benefits
-
Year-over-year comparison
-
Trend identification
-
Seasonal performance insights
Historical data helps refine procurement strategies.

6. KPI Definition Sheet Tab
This sheet acts as the single source of truth.
It includes:
-
KPI Name
-
KPI Group
-
Unit
-
Formula
-
KPI Definition
-
KPI Type (Upper / Lower the Better)
This ensures consistency and clarity across teams.

Click to Buy Procurement Efficiency KPI Dashboard in Google Sheets
Advantages of Procurement Efficiency KPI Dashboard
-
Centralized procurement performance tracking
-
Improved cost control and savings visibility
-
Faster decision-making
-
Better supplier management
-
Reduced process inefficiencies
-
Easy collaboration through Google Sheets
Opportunities for Improvement
Click to Buy Procurement Efficiency KPI Dashboard in Google Sheets
Organizations can enhance this dashboard by:
-
Adding category-wise procurement analysis
-
Tracking ESG or sustainable procurement metrics
-
Integrating supplier risk indicators
-
Automating data imports from ERP systems
-
Adding predictive spend forecasting
Best Practices for Using the Procurement Efficiency KPI Dashboard
-
Update procurement data regularly
-
Review KPIs monthly and quarterly
-
Align targets with business objectives
-
Monitor supplier trends closely
-
Act quickly on inefficiency indicators
-
Share insights with leadership
Conclusion
Click to Buy Procurement Efficiency KPI Dashboard in Google Sheets
A Procurement Efficiency KPI Dashboard in Google Sheets provides a structured and reliable way to monitor procurement performance. It transforms raw purchasing data into actionable insights, helping organizations reduce costs, improve supplier relationships, and streamline procurement operations.
Because the dashboard is flexible, collaborative, and easy to maintain, it fits organizations of all sizes. With disciplined usage and the right KPIs, procurement teams can deliver measurable business value.
Frequently Asked Questions (FAQs)
Click to Buy Procurement Efficiency KPI Dashboard in Google Sheets
1. Who should use this dashboard?
Procurement managers, sourcing teams, finance teams, and leadership.
2. Can this dashboard track supplier performance?
Yes, it includes supplier delivery, quality, and performance KPIs.
3. Does it support MTD and YTD tracking?
Yes, both views are fully built-in.
4. Can KPIs be customized?
Yes, the KPI Definition sheet allows full customization.
5. Is Google Sheets secure for procurement data?
Yes, with proper access controls and permissions.
Visit our YouTube channel to learn step-by-step video tutorials
Youtube.com/@NeotechNavigators
Watch the step-by-step video tutorial:
Click to Buy Procurement Efficiency KPI Dashboard in Google Sheets