Managing compliance without clear KPIs often leads to hidden risks, audit issues, and delayed corrective actions. When compliance data sits across multiple sheets or reports, tracking performance becomes inconsistent and time-consuming. That is exactly why a Compliance KPI Scorecard in Google Sheets is a powerful and practical solution.
In this article, we explain how the Compliance KPI Scorecard in Google Sheets works, its sheet-wise structure, key features, and how it helps compliance, risk, audit, and management teams monitor compliance performance with confidence.
What Is a Compliance KPI Scorecard in Gogle Sheets?
A Compliance KPI Scorecard in Google Sheets is a ready-to-use performance tracking template designed to monitor and evaluate compliance KPIs on a monthly and yearly basis. Instead of manually calculating metrics and reviewing static reports, this scorecard provides:
-
Clear KPI status using traffic-light indicators
-
Month-to-Date (MTD) and Year-to-Date (YTD) performance
-
Target vs Actual and Previous Year vs Actual comparisons
-
Automatic percentage variance with up/down arrows
Because it is built in Google Sheets, the scorecard remains cloud-based, collaborative, and easy to maintain.
Why Use Google Sheets for Compliance KPI Tracking?
Google Sheets offers flexibility and accessibility that many compliance teams prefer.
Key advantages include:
-
Cloud access from anywhere
-
Easy sharing with audit and leadership teams
-
No additional software cost
-
Simple customization without coding
-
Seamless integration with existing data sources
This scorecard leverages these strengths while delivering a structured, professional KPI framework.
Key Features of the Compliance KPI Scorecard
Click to Buy Compliance KPI Scorecard In Google Sheets
This template tracks 10 different Compliance KPIs, carefully designed to represent overall compliance health.
Core Highlights
-
Month Selector – Choose any month from the dropdown to view monthly compliance performance
-
Automatic KPI Refresh – All KPI values, indicators, and percentages update instantly
-
Traffic Light Indicators – Red, Amber, and Green status for quick decision-making
-
Variance Arrows – Visual indicators for performance improvement or decline
-
MTD & YTD Toggle – Switch between monthly and yearly performance views
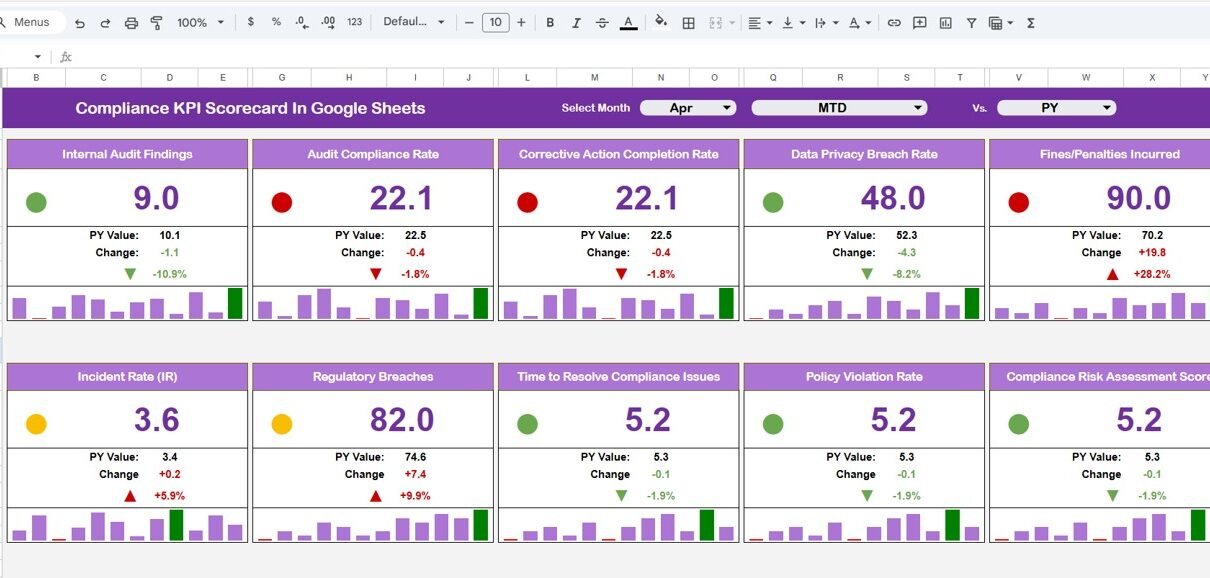
Dashboard / Scorecard Sheet
The Scorecard (Dashboard) sheet is the main view of the template.
What You See on the Scorecard
-
KPI Name
-
MTD Actual, Target, and Previous Year
-
Target vs Actual variance (%)
-
Previous Year vs Actual variance (%)
-
YTD Actual, Target, and Previous Year
-
Traffic-light compliance status
-
Up/Down arrows for quick trend interpretation
This layout ensures senior management can instantly understand compliance performance without deep analysis.

Click to Buy Compliance KPI Scorecard In Google Sheets
KPI Trend Sheet
The KPI Trend sheet provides detailed insights for individual KPIs.
How It Works
-
Select a KPI name from the dropdown (available in Range C3)
-
Automatically displays:
-
KPI Group
-
Unit of Measurement
-
KPI Type (Lower the Better / Upper the Better)
-
Trend values across months
-
This sheet is ideal for compliance managers who want to analyze KPI behavior over time.

Click to Buy Compliance KPI Scorecard In Google Sheets
KPI Definition Sheet
The KPI Definition sheet acts as the foundation of the scorecard.
Information Captured
-
KPI Name
-
KPI Group (Audit, Risk, Legal, Operations, etc.)
-
Unit (%, Count, Days, Score)
-
KPI Formula
-
KPI Definition
Maintaining this sheet ensures KPI clarity, standardization, and audit readiness.

Click to Buy Compliance KPI Scorecard In Google Sheets
Data Input Sheet
The Data Input sheet is where all actual KPI values are entered.
Key Points
-
Enter MTD and YTD actual values for each KPI
-
Month selection controls which period is being updated
-
All dashboards and trends update automatically
This keeps data entry simple while preserving analytical accuracy.

Click to Buy Compliance KPI Scorecard In Google Sheets
Color Settings Sheet
The Color Settings sheet allows easy customization of visual indicators.
What You Can Control
-
Traffic-light thresholds
-
Color codes for Red, Amber, and Green
-
Arrow logic for performance change
This makes the scorecard adaptable to different compliance standards and risk appetites.

Click to Buy Compliance KPI Scorecard In Google Sheets
Advantages of Compliance KPI Scorecard in Google Sheets
-
Centralized compliance monitoring
-
Real-time KPI visibility
-
Clear target vs actual comparison
-
Audit-friendly KPI definitions
-
No dependency on complex BI tools
-
Easy monthly and yearly tracking
Opportunities for Improvement
-
Integrate Google Forms for automated data capture
-
Add department-wise or regulation-wise KPIs
-
Link evidence documents for audits
-
Automate reminders for data updates
Best Practices for Using the Scorecard
Click to Buy Compliance KPI Scorecard In Google Sheets
-
Keep KPI definitions consistent and approved
-
Update data on a fixed monthly schedule
-
Review red and amber KPIs in management meetings
-
Archive previous year data properly
-
Use YTD view for strategic compliance decisions
Who Should Use This Compliance KPI Scorecard?
This template is ideal for:
-
Compliance Teams
-
Risk Management Teams
-
Internal Audit Departments
-
Legal & Regulatory Teams
-
Corporate Governance Functions
Any organization that needs structured compliance reporting will benefit from this scorecard.
Final Thoughts
Click to Buy Compliance KPI Scorecard In Google Sheets
The Compliance KPI Scorecard in Google Sheets transforms complex compliance tracking into a clear, visual, and actionable framework. With automatic calculations, traffic-light indicators, and MTD/YTD analysis, it empowers teams to stay compliant, proactive, and audit-ready.
Visit our YouTube channel to learn step-by-step video tutorials
Youtube.com/@NeotechNavigators
Watch the step-by-step video tutorial: