Mining operations involve high-risk activities. Therefore, safety monitoring is not optional—it is critical. However, many mining organizations still track safety KPIs using manual registers, static spreadsheets, or delayed reports. As a result, risks increase, compliance gaps appear, and corrective actions get delayed.
That is exactly where a Mining Safety KPI Dashboard in Google Sheets becomes extremely valuable.
In this article, we explain the Mining Safety KPI Dashboard in Google Sheets, its worksheet structure, KPI framework, features, advantages, best practices, and FAQs. This is a ready-to-use dashboard designed to help mining companies monitor safety performance clearly and consistently.
What Is a Mining Safety KPI Dashboard in Google Sheets?
Click to Buy Mining Safety KPI Dashboard in Google Sheets
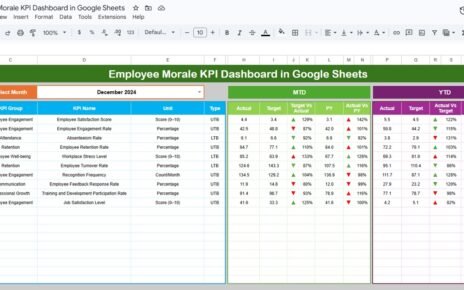
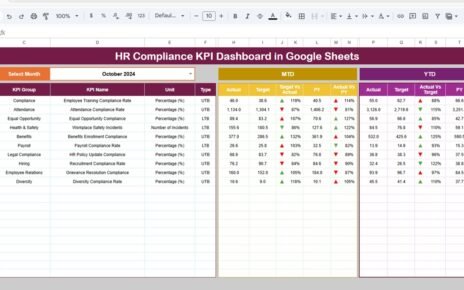
A Mining Safety KPI Dashboard in Google Sheets is an interactive reporting solution that tracks safety-related KPIs such as incidents, injuries, near misses, inspections, and compliance metrics in one centralized place.
Instead of reviewing raw safety logs, this dashboard displays MTD and YTD performance, targets, previous-year comparisons, and variance indicators using up/down arrows and conditional formatting. Moreover, since it runs on Google Sheets, teams can collaborate and update data in real time.
As a result, safety managers gain instant visibility into site-level and organization-wide safety performance.
Why Do Mining Companies Need a Safety KPI Dashboard?
Mining environments change daily. Therefore, safety performance must be monitored continuously.
Without a safety dashboard:
-
Safety issues remain hidden
-
KPI trends are difficult to track
-
Target vs actual performance stays unclear
-
Management reacts late to risks
However, a Mining Safety KPI Dashboard in Google Sheets centralizes safety data. Consequently, leadership can act proactively and reduce workplace incidents.
How Does the Mining Safety KPI Dashboard Work?
Click to Buy Mining Safety KPI Dashboard in Google Sheets
The dashboard follows a structured and easy-to-use workflow:
-
Enter actual safety numbers for MTD and YTD
-
Enter KPI targets for each month
-
Enter previous-year values for comparison
-
Select a month from the drop-down
-
Review KPI performance, trends, and variances
Because of this design, users can analyze safety performance without modifying formulas.
What Are the Key Features of the Mining Safety KPI Dashboard?
This ready-to-use dashboard includes several professional safety reporting features.
Month Selection Drop-Down
On the Dashboard Sheet, users can select the reporting month from cell D3. Once selected, all KPI values update automatically.
MTD and YTD Performance Tracking
The dashboard shows:
-
MTD Actual, Target, and Previous Year
-
YTD Actual, Target, and Previous Year
As a result, users can track short-term and long-term safety performance together.
Target vs Actual and PY vs Actual Comparison
Each KPI includes:
-
Target vs Actual variance
-
Previous Year vs Actual variance
-
Up and down arrows using conditional formatting
Therefore, deviations become visible instantly.
How Many Worksheets Are Included in This Dashboard?
Click to Buy Mining Safety KPI Dashboard in Google Sheets
The Mining Safety KPI Dashboard in Google Sheets consists of six structured worksheets, each serving a specific purpose.
Dashboard Sheet: What Does the Main Dashboard Show?
The Dashboard Sheet is the main reporting page.
Key Highlights:
-
All safety KPIs displayed in a single view
-
Month-wise filtering using a drop-down
-
MTD and YTD actuals, targets, and previous-year values
-
Automatic variance calculation
-
Visual up/down arrows for performance indication
Because of this layout, management can review safety status in minutes.

Click to Buy Mining Safety KPI Dashboard in Google Sheets
KPI Trend Sheet: How Can You Analyze KPI Trends?
The KPI Trend Sheet focuses on detailed KPI-level analysis.
Key Features:
- KPI selection drop-down at cell C3
- Displays:
- KPI Group
- KPI Unit
- KPI Type (Lower the Better / Upper the Better)
- KPI Formula
- KPI Definition
This sheet helps users understand KPI logic and track trends over time.

Click to Buy Mining Safety KPI Dashboard in Google Sheets
Actual Number Sheet: Where Do You Enter Current-Year Data?
The Actual Number Sheet is used to input actual safety performance data.
How It Works:
-
Enter the first month of the year in cell E1
-
Input MTD and YTD actual values for each KPI
-
Change the month, and calculations update automatically
This structure ensures accurate month-wise tracking.

Click to Buy Mining Safety KPI Dashboard in Google Sheets
Target Sheet: How Do You Set Safety Targets?
The Target Sheet allows users to define safety targets.
In This Sheet:
-
Enter MTD target values
-
Enter YTD target values
-
Set targets for each KPI and each month
As a result, performance tracking stays aligned with safety goals.

Click to Buy Mining Safety KPI Dashboard in Google Sheets
Previous Year Number Sheet: Why Is It Important?
The Previous Year Number Sheet stores last year’s safety performance data.
Key Benefit:
-
Enables year-over-year comparison
-
Highlights improvement or deterioration
-
Supports audit and compliance reviews
This comparison strengthens data-driven safety decisions.

Click to Buy Mining Safety KPI Dashboard in Google Sheets
KPI Definition Sheet: Why Is This Sheet Critical?
The KPI Definition Sheet acts as the foundation of the dashboard.
It Includes:
- KPI Name
- KPI Group
- Unit of Measurement
- Formula to aggregate
- KPI Definition
- KPI Type (Lower the Better / Upper the Better)
Because definitions remain standardized, reporting stays consistent across teams.

Click to Buy Mining Safety KPI Dashboard in Google Sheets
What Safety KPIs Can You Track Using This Dashboard?
This dashboard supports tracking of common mining safety KPIs such as:
- Lost Time Injury Frequency Rate (LTIFR)
- Total Recordable Injury Rate (TRIR)
- Fatality Count
- Near Miss Incidents
- Unsafe Acts Reported
- Safety Inspections Completed
- Safety Training Hours
- High-Potential Incidents
- Equipment Safety Violations
- Emergency Drill Compliance
You can easily replace or add KPIs based on site requirements.
Advantages of Mining Safety KPI Dashboard in Google Sheets
Click to Buy Mining Safety KPI Dashboard in Google Sheets
Centralized Safety Reporting
All safety KPIs remain in one structured location.
Better Risk Visibility
MTD and YTD views highlight emerging risks early.
Improved Accountability
Targets and variance indicators drive responsibility.
Year-over-Year Comparison
Previous-year data shows real improvement trends.
Easy Collaboration
Google Sheets allows multiple users to work together.
No Complex Tools Required
You get powerful analytics without specialized HSE software.
Best Practices for Mining Safety KPI Dashboard in Google Sheets
Click to Buy Mining Safety KPI Dashboard in Google Sheets
Keep KPI Definitions Clear
Always maintain accurate units, formulas, and definitions.
Update Actuals Monthly
Timely updates ensure reliable insights.
Review Variances Regularly
Focus on negative trends and corrective actions.
Protect Formula Sheets
Lock calculation logic to prevent accidental changes.
Align KPIs With Regulations
Ensure KPIs meet statutory and internal safety standards.
Who Should Use This Mining Safety KPI Dashboard?
Click to Buy Mining Safety KPI Dashboard in Google Sheets
This dashboard is ideal for:
-
Mining safety managers
-
HSE teams
-
Operations managers
-
Site supervisors
-
Compliance and audit teams
-
Corporate safety leadership
Because it uses Google Sheets, adoption is fast and simple.
Conclusion: Is the Mining Safety KPI Dashboard in Google Sheets Worth Using?
Click to Buy Mining Safety KPI Dashboard in Google Sheets
The Mining Safety KPI Dashboard in Google Sheets converts raw safety data into clear, actionable insights. It improves visibility, strengthens compliance, and supports proactive safety management across mining operations.
If you want a ready-to-use, structured, and professional safety KPI solution, this dashboard delivers exactly what you need.
Frequently Asked Questions (FAQs)
What is a Mining Safety KPI Dashboard in Google Sheets?
It is a ready-to-use dashboard for tracking mining safety KPIs with MTD, YTD, targets, and trend analysis.
Can I customize KPIs and targets?
Yes, you can fully customize KPIs, targets, units, and formulas.
Do I need advanced Google Sheets knowledge?
No, basic Google Sheets knowledge is enough.
Can multiple users update the dashboard?
Yes, Google Sheets supports real-time collaboration.
Does this dashboard support audits and compliance?
Yes, KPI definitions, trends, and comparisons support audit requirements.
Visit our YouTube channel to learn step-by-step video tutorials
Youtube.com/@NeotechNavigators
Watch the step-by-step video tutorial: