Marketing teams run multiple campaigns across channels, regions, and objectives. However, without a clear view of ROI and performance, even high spend campaigns fail to deliver value. Because of this, businesses need a centralized, visual, and easy-to-use reporting solution.Campaign ROI and Performance Dashboard in Google Sheets
That is exactly where the Campaign ROI and Performance Dashboard in Google Sheets becomes essential.
In this detailed article, you will learn what this dashboard is, how it works, why it matters, and how each dashboard page helps you make smarter marketing decisions. Moreover, you will explore its advantages, best practices, and frequently asked questions, so you can use it confidently for real-world campaign tracking.Campaign ROI and Performance Dashboard in Google Sheets
What Is a Campaign ROI and Performance Dashboard in Google Sheets?
Click to Buy Campaign ROI and Performance Dashboard in Google Sheets
A Campaign ROI and Performance Dashboard in Google Sheets is an interactive reporting solution that tracks marketing performance metrics such as:Campaign ROI and Performance Dashboard in Google Sheets
- Impressions
- Clicks
- Conversions
- Revenue
- Budget
- Spend
- ROI
Instead of working with raw data tables, this dashboard converts campaign data into clear charts, KPI cards, and slicer-based views. As a result, marketers, managers, and business owners can instantly understand what is working and what needs improvement.
Because it is built in Google Sheets, the dashboard supports:
- Easy collaboration
- Real-time updates
- Browser-based access
- No software installation
Why Do Marketing Teams Need a Campaign ROI Dashboard?
Click to Buy Campaign ROI and Performance Dashboard in Google Sheets
Marketing success depends on data-driven decisions. However, many teams still struggle with scattered reports and manual calculations.
Common Challenges Without a Dashboard
-
No single view of campaign ROI
-
Delayed performance insights
-
Manual reporting errors
-
Difficult budget tracking
-
Poor channel comparison
Therefore, a structured Campaign ROI and Performance Dashboard solves these problems by providing clarity, speed, and control.
Overview of Campaign ROI and Performance Dashboard in Google Sheets
Click to Buy Campaign ROI and Performance Dashboard in Google Sheets
This dashboard is designed to give end-to-end visibility into campaign performance. It includes:
- KPI summary cards
- Campaign, channel, region, and monthly analysis
- Dynamic slicers
- Search and filter functionality
- Clean, professional layout
Most importantly, it works as a ready-to-use template, so teams can start analyzing data immediately.
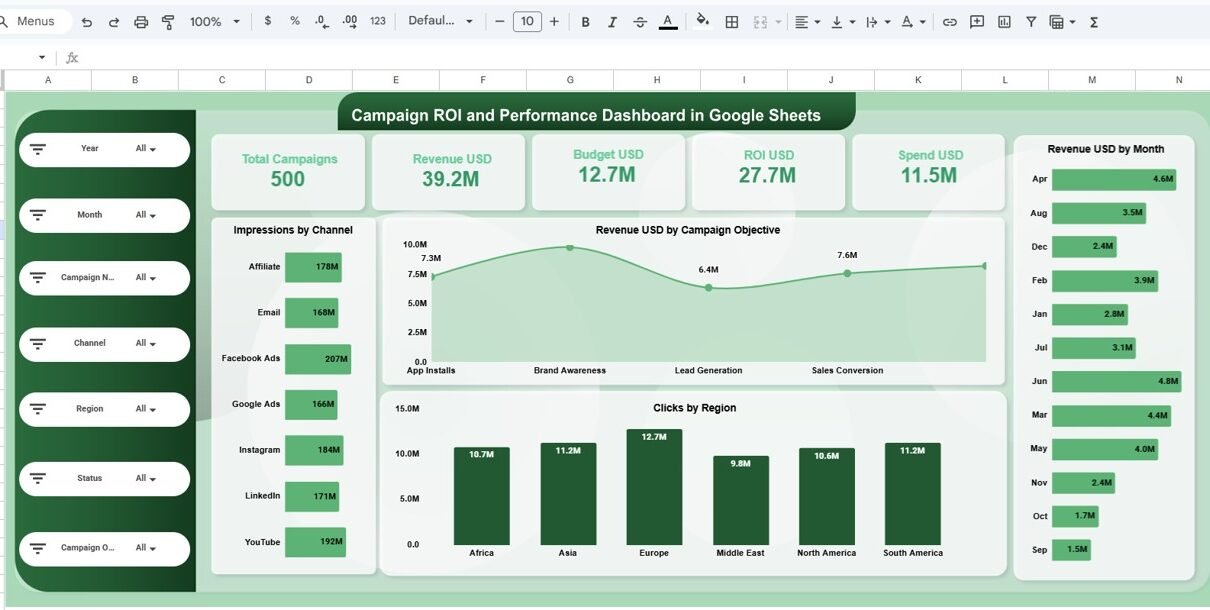
Overview Page: What Key Insights Do You Get Instantly?
The Overview page acts as the executive summary of the dashboard.
Key KPI Cards on Overview Page
- Total Campaigns
- Revenue (USD)
- Budget (USD)
- ROI (USD)
- Spend (USD)
Because these KPIs appear at the top, users can quickly assess overall marketing health.
Supporting Visuals
- Revenue by Campaign Objective
- Impressions by Channel
- Clicks by Region
- Revenue by Month
As a result, decision-makers can understand performance within seconds.

Click to Buy Campaign ROI and Performance Dashboard in Google Sheets
Region Analysis: How Do Campaigns Perform Across Regions?
The Region Analysis page helps teams compare performance geographically.
Key Charts in Region Analysis
- Impressions by Region
- Clicks by Region
- Revenue by Region
- Budget by Region
This page clearly shows:
- High-performing regions
- Underperforming markets
- Budget vs revenue gaps
Therefore, teams can reallocate budgets more effectively.

Click to Buy Campaign ROI and Performance Dashboard in Google Sheets
Channel Analysis: Which Marketing Channels Deliver the Best ROI?
Marketing teams often invest in multiple channels. However, not all channels perform equally.
Key Insights from Channel Analysis Page
- Impressions by Channel
- Clicks by Channel
- Revenue by Channel
- Budget by Channel
Channels included:
- Affiliate
- Facebook Ads
- Google Ads
- YouTube
Because the visuals are clear, teams can immediately identify:
-
High ROI channels
-
Channels with high spend but low returns

Click to Buy Campaign ROI and Performance Dashboard in Google Sheets
Campaign Analysis: Which Campaign Objectives Perform Best?
Different campaigns focus on different objectives. The Campaign Analysis page compares performance across objectives.
Campaign Objectives Covered
- App Installs
- Brand Awareness
- Lead Generation
- Sales Conversion
- Website Traffic
Visuals Included
- Impressions by Campaign Objective
- Clicks by Campaign Objective
- Revenue by Campaign Objective
- Budget by Campaign Objective
As a result, marketers can optimize strategy based on actual results rather than assumptions.

Click to Buy Campaign ROI and Performance Dashboard in Google Sheets
Monthly Trends: How Does Performance Change Over Time?
The Monthly Trends page highlights performance patterns across months.
Key Monthly Insights
-
Impressions by Month
-
Clicks by Month
-
Revenue by Month
-
Budget by Month
This page helps answer questions like:
- Which months generate the highest revenue?
- When does campaign performance dip?
- How does budget impact monthly ROI?
Therefore, seasonal planning becomes easier and more accurate.

Click to Buy Campaign ROI and Performance Dashboard in Google Sheets
Search & Data Table View: How Can You Analyze Individual Campaigns?
The dashboard also includes a detailed data table with search functionality.
Features of Data Table
- Search by keyword
- Filter by selected column
- View campaign-level metrics
Metrics Included
- Campaign Name
- Channel
- Region
- Objective
- Status
- Budget
- Spend
- Impressions
- Clicks
- Conversions
- Revenue
- ROI
- Month
This feature supports deep-dive analysis when high-level charts are not enough.

Click to Buy Campaign ROI and Performance Dashboard in Google Sheets
Slicers & Filters: How Do They Improve Analysis?
The dashboard includes dynamic slicers for:
- Year
- Month
- Campaign Name
- Channel
- Region
- Status
- Campaign Objective
Because of slicers:
- Reports update instantly
- Analysis becomes interactive
- Users avoid manual filtering
Advantages of Campaign ROI and Performance Dashboard in Google Sheets
Click to Buy Campaign ROI and Performance Dashboard in Google Sheets
-
Centralized campaign performance tracking
-
Real-time ROI visibility
-
Easy collaboration in Google Sheets
-
No complex tools required
-
Clear visuals for faster decisions
-
Suitable for all marketing teams
-
Easy to customize and scale
Best Practices for Using Campaign ROI and Performance Dashboard
Click to Buy Campaign ROI and Performance Dashboard in Google Sheets
- Keep campaign data clean and consistent
- Update data regularly
- Review ROI before increasing budgets
- Use monthly trends for forecasting
- Compare channels instead of relying on assumptions
- Share dashboard access with stakeholders
Who Should Use This Dashboard?
- Digital Marketing Teams
- Performance Marketers
- Marketing Managers
- Growth Teams
- Agencies
- Business Owners
- Startups and Enterprises
Conclusion: Why Campaign ROI Dashboard in Google Sheets Is a Smart Choice
Click to Buy Campaign ROI and Performance Dashboard in Google Sheets
The Campaign ROI and Performance Dashboard in Google Sheets transforms raw marketing data into actionable insights. Instead of guessing campaign success, teams can rely on real numbers, trends, and ROI analysis.
Because it is simple, visual, and collaborative, this dashboard helps organizations optimize spend, improve returns, and scale smarter.
If you want clarity, control, and confidence in marketing decisions, this dashboard is a powerful solution.
Frequently Asked Questions (FAQs)
What is the main purpose of this dashboard?
It tracks campaign ROI and performance in one centralized view.
Can I use this dashboard for multiple channels?
Yes, it supports multiple digital marketing channels.
Does it require advanced Google Sheets knowledge?
No, it is beginner-friendly and ready to use.
Can I customize metrics and visuals?
Yes, the dashboard is fully customizable.
Is this suitable for agencies?
Yes, agencies can track multiple campaigns efficiently.
Does it support real-time collaboration?
Yes, Google Sheets allows real-time sharing and updates.
Visit our YouTube channel to learn step-by-step video tutorials
Youtube.com/@NeotechNavigators
Click to Buy Campaign ROI and Performance Dashboard in Google Sheets