The media and entertainment industry runs on performance. Whether organizations manage television networks, OTT platforms, film production, digital content, or advertising revenue, they must track key metrics continuously. However, when teams rely on manual reports or disconnected spreadsheets, performance visibility reduces and decision-making slows down.
That is exactly why a Media & Entertainment KPI Scorecard in Google Sheets becomes an essential tool.
This article explains what a Media & Entertainment KPI Scorecard in Google Sheets is, why organizations need it, how it works, its worksheets, key features, KPIs with logic, advantages, best practices, and frequently asked questions. By the end, you will clearly understand how this ready-to-use scorecard improves operational and strategic performance tracking.
What Is a Media & Entertainment KPI Scorecard in Google Sheets?
Click to Buy Media & Entertainment KPI Scorecard in Google Sheets
A Media & Entertainment KPI Scorecard in Google Sheets is a ready-to-use performance tracking template designed to monitor critical KPIs for media and entertainment businesses.
Instead of tracking performance using multiple tools, teams use one centralized Google Sheets scorecard to:
- Monitor monthly and yearly performance
- Track KPI status using traffic lights and arrows
- Compare MTD and YTD performance
- Identify improvement and decline instantly
- Support management reporting
Because Google Sheets supports drop-downs, formulas, conditional formatting, and collaboration, this scorecard remains both powerful and easy to use.
Why Do Media & Entertainment Companies Need a KPI Scorecard?
Media and entertainment businesses operate in a fast-moving environment. Therefore, performance tracking must stay quick, accurate, and visual.
However, manual reports often delay insights. A KPI scorecard solves this problem effectively.
Key Reasons to Use a Media & Entertainment KPI Scorecard
- To track content performance consistently
- To monitor revenue and audience metrics
- To identify declining KPIs early
- To improve data-driven decision-making
- To support leadership and stakeholder reporting
As a result, organizations move from reactive reporting to proactive performance management.
How Does the Media & Entertainment KPI Scorecard in Google Sheets Work?
Click to Buy Media & Entertainment KPI Scorecard in Google Sheets
The scorecard works through a structured worksheet design. Each worksheet serves a specific purpose. Together, all sheets create a complete performance monitoring system.
Users enter KPI data once. Then, formulas automatically calculate monthly and yearly results. Based on KPI logic, traffic lights and arrows update automatically.
Consequently, users see real-time KPI status without manual calculations.
What Are the Key Features of the Media & Entertainment KPI Scorecard?
This ready-to-use scorecard tracks 10 important KPIs and includes multiple supporting worksheets.
Let us explore each component in detail.
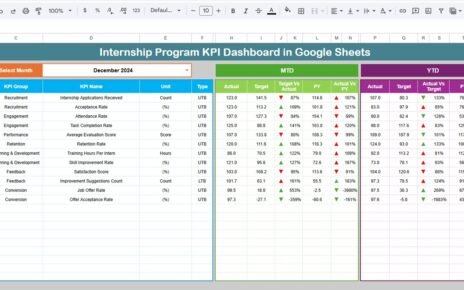
How Does the Main Scorecard Work?
The Main KPI Scorecard acts as the central performance view.
Key Features of the Scorecard
- Month drop-down available at the top
- Monthly scorecard view by default
- Automatic update of all KPI values
- Dynamic traffic light indicators
- Up and down arrows showing percentage change
Users can switch months easily. As soon as they select a new month, all KPI numbers, arrows, and colors update automatically.
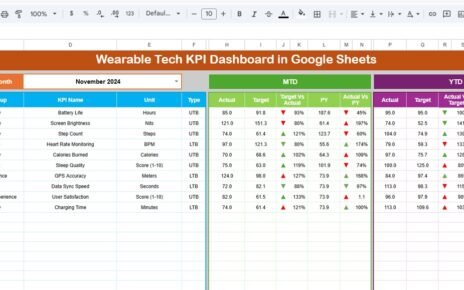
How Can You Switch Between MTD and YTD Views?
Click to Buy Media & Entertainment KPI Scorecard in Google Sheets
The scorecard allows both MTD and YTD analysis.
How This Feature Helps
-
Click MTD to view monthly performance
-
Click YTD to view yearly performance
-
Instantly compare short-term and long-term trends
Because of this flexibility, management reviews performance from multiple perspectives.

Click to Buy Media & Entertainment KPI Scorecard in Google Sheets
What Is the KPI Trend Sheet?
The KPI Trend Sheet focuses on detailed KPI analysis.
Key Features of the KPI Trend Sheet
-
KPI selection drop-down in cell C3
-
Displays KPI Group
-
Displays KPI Unit
-
Shows KPI Type (Lower the Better or Upper the Better)
Because this sheet focuses on trends, teams easily understand how each KPI behaves over time.

Click to Buy Media & Entertainment KPI Scorecard in Google Sheets
What Is the KPI Definition Sheet?
The KPI Definition Sheet acts as a reference and documentation page.
Information Stored in the KPI Definition Sheet
-
KPI Name
-
KPI Group
-
Unit of Measurement
-
Formula to aggregate KPI
-
KPI Definition
Since all KPI logic remains documented, the scorecard stays transparent and easy to interpret.

Click to Buy Media & Entertainment KPI Scorecard in Google Sheets
What Is the Data Input Sheet?
The Data Input Sheet captures raw KPI data.
Purpose of the Data Input Sheet
-
Enter KPI values by month
-
Maintain a clean data structure
-
Feed the scorecard automatically
Because this sheet drives the entire scorecard, accurate data entry ensures reliable results.

Click to Buy Media & Entertainment KPI Scorecard in Google Sheets
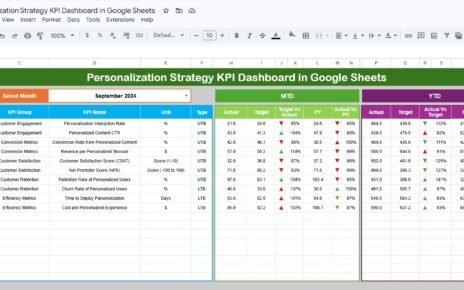
What Are Colour Settings in the KPI Scorecard?
The Colour Settings control visual indicators.
How Colour Settings Help
-
Define traffic light colors
-
Control up and down arrow logic
-
Align colors with KPI type (LTB or UTB)
As a result, KPI status becomes visually clear at a glance.

Click to Buy Media & Entertainment KPI Scorecard in Google Sheets
Advantages of Media & Entertainment KPI Scorecard in Google Sheets
This KPI scorecard delivers strong business benefits.
1. Improves Performance Visibility
All KPIs appear in one place. Therefore, teams gain instant clarity.
2. Enables Faster Decisions
Traffic lights and arrows highlight issues immediately.
3. Reduces Manual Effort
Automated formulas remove repetitive calculations.
4. Supports Collaboration
Google Sheets allows real-time collaboration across teams.
5. Improves Reporting Accuracy
Centralized data reduces inconsistencies.
6. Offers Cost-Effective Solution
The template eliminates the need for expensive software.
Best Practices for Media & Entertainment KPI Scorecard in Google Sheets
Click to Buy Media & Entertainment KPI Scorecard in Google Sheets
Follow these best practices to get maximum value.
1. Define KPIs Clearly
Always document KPI logic in the KPI Definition Sheet.
2. Update Data Regularly
Maintain monthly data without gaps.
3. Use Correct KPI Type
Apply LTB or UTB correctly to ensure accurate color logic.
4. Review Scorecard Monthly
Analyze MTD and YTD performance consistently.
5. Protect the Template
Limit editing access to prevent accidental changes.
6. Standardize Units
Use consistent units across all KPIs.
Who Should Use a Media & Entertainment KPI Scorecard?
Click to Buy Media & Entertainment KPI Scorecard in Google Sheets
This scorecard benefits:
-
Media Operations Teams
-
Content Managers
-
Finance and Revenue Teams
-
Strategy and Planning Teams
-
Senior Management
Because Google Sheets remains familiar, adoption becomes easy.
Conclusion
A Media & Entertainment KPI Scorecard in Google Sheets provides a simple, visual, and powerful way to track performance. It transforms raw data into meaningful insights using traffic lights, arrows, and trend views.
With monthly and yearly analysis, KPI definitions, and flexible customization, this scorecard helps organizations move toward data-driven media performance management.
Frequently Asked Questions (FAQs)
Click to Buy Media & Entertainment KPI Scorecard in Google Sheets
What is a Media & Entertainment KPI Scorecard in Google Sheets?
It is a ready-to-use Google Sheets template that tracks key media performance metrics visually.
Can I customize KPIs in this scorecard?
Yes, you can easily add, remove, or modify KPIs.
Does this scorecard support MTD and YTD views?
Yes, it supports both monthly and yearly performance analysis.
How do traffic lights work in this scorecard?
Traffic lights change color based on KPI type and performance against targets.
Who should maintain this KPI scorecard?
Performance analysts or operations teams should update and review it regularly.
Visit our YouTube channel to learn step-by-step video tutorials
Youtube.com/@NeotechNavigators
Watch the step-by-step video tutorial:
Click to Buy Media & Entertainment KPI Scorecard in Google Sheets