Modern agriculture runs on data. Farmers, agri-business owners, and farm managers track yield, cost, water usage, and productivity every month. However, many still use manual reports. As a result, they struggle to compare performance and detect problems early.
So, how can you monitor agricultural KPIs clearly in one interactive system?
The answer is simple.
You need an Agriculture KPI Scorecard in Google Sheets.
This ready-to-use Google Sheets template helps you track 10 key agricultural KPIs in one dynamic scorecard. Moreover, you can select any month from the drop-down, and the entire scorecard updates automatically. Therefore, you get instant monthly or yearly insights without manual calculations.
Let’s explore the structure and features in detail.
What Is the Agriculture KPI Scorecard in Google Sheets?
Click to Buy Agriculture KPI Scorecard in Google Sheets
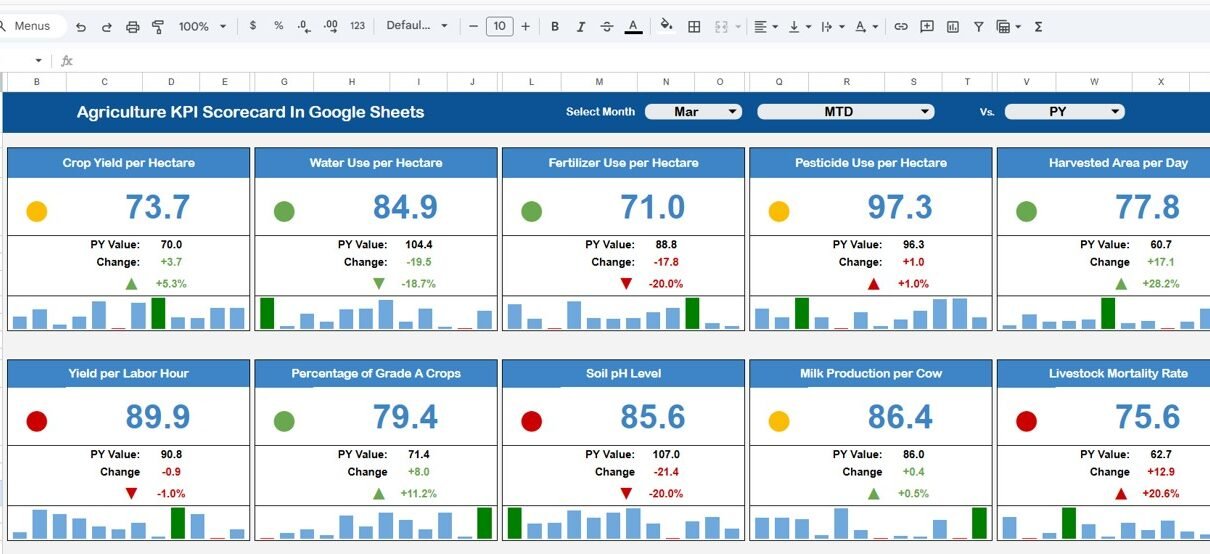
The Agriculture KPI Scorecard in Google Sheets is a performance tracking template designed for farms, agri-enterprises, and agricultural businesses. It allows users to:
- Track 10 different KPIs
- View Monthly (MTD) performance
- View Yearly (YTD) performance
- Monitor percentage changes
- Analyze trends visually
- Understand KPI definitions clearly
Because it runs on Google Sheets, you can access it from anywhere. Furthermore, your team can collaborate in real time.
Key Features of Agriculture KPI Scorecard in Google Sheets
Interactive Monthly & Yearly Scorecard
At the top of the scorecard, you will find a Month Drop-Down Selector.
- Select any month
- All numbers update automatically
- Traffic light colors change instantly
- Up and down arrows show performance change
Additionally, you can click:
- MTD to view Monthly Data
- YTD to view Yearly Data
Therefore, you can analyze short-term and long-term performance easily.
🚦 Traffic Light Performance Indicators
Click to Buy Agriculture KPI Scorecard in Google Sheets
The template includes:
- Green for good performance
- Yellow for moderate performance
- Red for poor performance
Because visual signals highlight performance instantly, you do not need complex analysis.
📈 Percentage Change with Up & Down Arrows
The scorecard automatically calculates:
- Target vs Actual % Change
- Previous Month Comparison
- Previous Year Comparison
If performance improves, you see an upward arrow. However, if performance declines, you see a downward arrow. Therefore, managers can react quickly.

Click to Buy Agriculture KPI Scorecard in Google Sheets
📉 Trend Sheet Tab (Range C3 Selection)
The Trend Sheet Tab allows deeper KPI analysis.
On Range C3, you can select a KPI from the drop-down list.
Once selected, the sheet displays:
- KPI Group
- Unit of KPI
- Type of KPI (Lower the Better / Upper the Better)
- Monthly Trend Chart
- Yearly Trend Chart
Because you can analyze trends over time, you can identify seasonal patterns and productivity cycles.

Click to Buy Agriculture KPI Scorecard in Google Sheets
📘 KPI Definition Sheet Tab
This sheet ensures clarity and standardization.
Here, you enter:
- KPI Name
- KPI Group
- Unit
- Formula
- KPI Definition
Therefore, all stakeholders understand how each KPI works. Moreover, it prevents confusion during reporting.

📝 Data Input Sheet Tab
This sheet allows you to input raw data.
You need to:
- Enter monthly actual values
- Enter yearly accumulated values
- Update targets
- Maintain consistent data entry
Because this sheet separates input from reporting, it reduces errors.

Click to Buy Agriculture KPI Scorecard in Google Sheets
🎨 Color Settings Tab
The Color Settings sheet allows you to customize:
- Traffic light thresholds
- Arrow formatting
- Performance percentage ranges
Therefore, you can adjust scoring logic based on your farm or agribusiness needs.

What KPIs Can You Track in Agriculture KPI Scorecard?
Click to Buy Agriculture KPI Scorecard in Google Sheets
Here are examples of 10 agricultural KPIs you can monitor:
- Crop Yield per Acre
- Water Usage Efficiency
- Fertilizer Cost per Acre
- Labor Productivity
- Harvest Completion Rate
- Equipment Downtime %
- Irrigation Efficiency
- Livestock Productivity Rate
- Revenue per Crop Cycle
- Cost Variance %
Because the template supports both “Lower the Better” and “Upper the Better” KPI types, it adapts easily.
Advantages of Agriculture KPI Scorecard in Google Sheets
Click to Buy Agriculture KPI Scorecard in Google Sheets
Easy Cloud Access
You can access the file from anywhere. Therefore, field teams and office teams stay aligned.
Real-Time Updates
Once you update data, the scorecard changes instantly.
Better Decision-Making
Visual indicators make performance evaluation simple and fast.
Improved Farm Productivity
When you track KPIs regularly, you identify inefficiencies early.
Clear Performance Comparison
MTD and YTD views allow short-term and long-term tracking.
Best Practices for the Agriculture KPI Scorecard
To get maximum benefit, follow these best practices:
Define Clear KPIs
Choose measurable and realistic KPIs.
Update Data Monthly
Consistent updates ensure accurate analysis.
Review Trends Regularly
Do not focus only on current month performance.
Customize Traffic Light Settings
Adjust thresholds according to crop type or farm size.
Train Team Members
Ensure everyone understands how to interpret arrows and colors.
Who Can Use This Agriculture KPI Scorecard?
Click to Buy Agriculture KPI Scorecard in Google Sheets
- Farm Owners
- Agribusiness Managers
- Agricultural Consultants
- Crop Production Companies
- Dairy & Livestock Farms
- Agri Startups
- Agricultural Cooperatives
Because Google Sheets supports collaboration, multiple users can work simultaneously.
Conclusion
Agriculture today depends on smart monitoring. However, manual tracking creates confusion and delays. The Agriculture KPI Scorecard in Google Sheets solves this problem with automation, visual indicators, and structured reporting.
Visit our YouTube channel to learn step-by-step video tutorials
Youtube.com/@NeotechNavigators
Watch the step-by-step video tutorial: