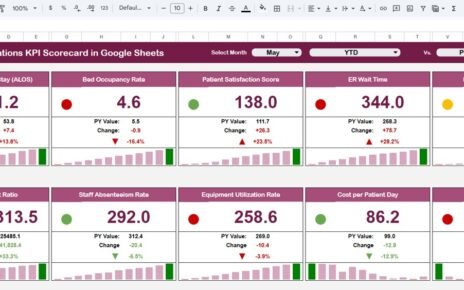
Managing returns is no longer just an operational task. Instead, it plays a direct role in customer satisfaction, cost control, and profitability. Companies handle product returns daily. However, many businesses still track return data in scattered spreadsheets. As a result, managers struggle to monitor return rates, processing time, and financial impact.Returns Management KPI Dashboard in Google Sheets
So, how can organizations monitor return performance in one structured and dynamic system?
The answer is clear.Returns Management KPI Dashboard in Google Sheets
You need a Returns Management KPI Dashboard in Google Sheets.
This ready-to-use Google Sheets dashboard allows you to track MTD, YTD, Target vs Actual, and Previous Year comparisons with dynamic dropdown controls and conditional formatting indicators. Moreover, it provides a centralized KPI definition structure so every metric stays clear and measurable.Returns Management KPI Dashboard in Google Sheets
What Is a Returns Management KPI Dashboard in Google Sheets?
Click to Buy Returns Management KPI Dashboard in Google Sheets
A Returns Management KPI Dashboard in Google Sheets is an interactive performance monitoring system that helps businesses track product return metrics in real time.Returns Management KPI Dashboard in Google Sheets
Instead of reviewing disconnected reports, managers can:
- Select a month from a dropdown
- View MTD and YTD performance
- Compare Actual vs Target
- Compare Actual vs Previous Year
- Monitor improvement using visual arrows
Therefore, leadership teams gain instant visibility into return trends and operational efficiency.
Why Do Businesses Need a Returns Management KPI Dashboard?
Product returns affect multiple business areas:
- Revenue
- Warehouse operations
- Customer satisfaction
- Logistics cost
- Inventory accuracy
Without structured KPI tracking, companies face:
- Rising return costs
- Slow processing times
- High refund rates
- Poor product quality insights
- Decreasing margins
However, when businesses implement a KPI dashboard, they gain data clarity. As a result, they improve operational control and customer experience.
Complete Structure of the Returns Management KPI Dashboard
This dashboard includes 6 worksheets, each serving a specific purpose.
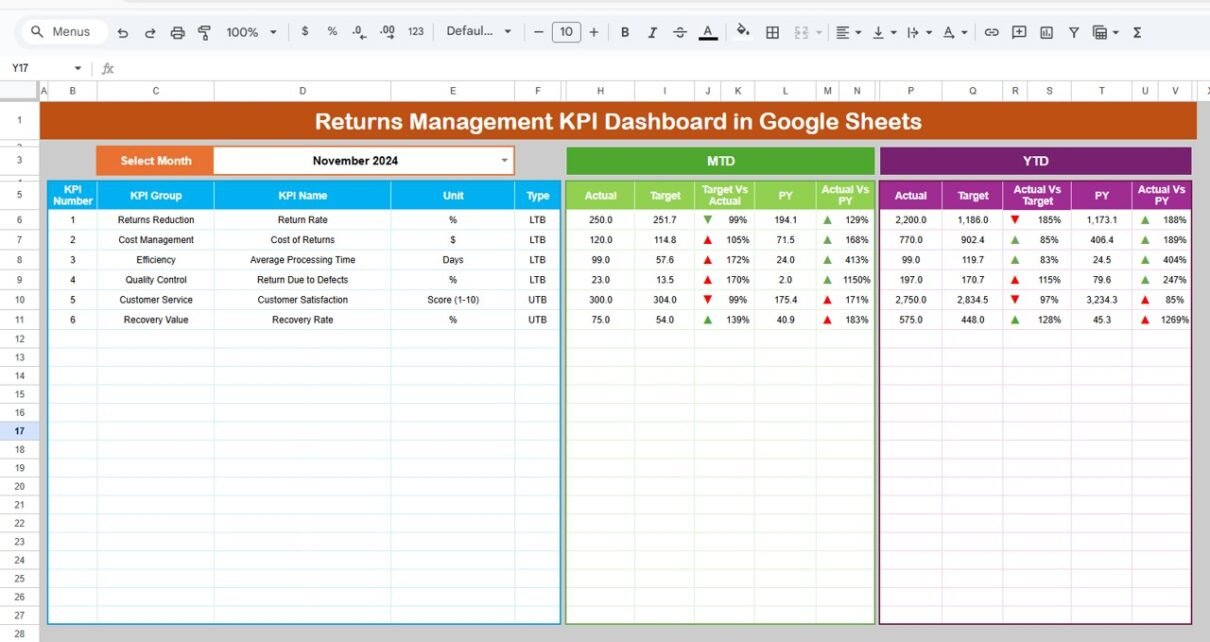
Dashboard Sheet Tab
Click to Buy Returns Management KPI Dashboard in Google Sheets
This serves as the main dashboard page.
Key Features:
-
Month selection dropdown in Range D3
-
MTD Actual, Target, Previous Year
-
YTD Actual, Target, Previous Year
-
Target vs Actual comparison
-
PY vs Actual comparison
-
Conditional formatting with up/down arrows
When users change the month in D3, the entire dashboard updates automatically.
What Insights Can You Get?
-
Detect increase in return rate
-
Compare current performance vs target
-
Identify year-over-year improvement
-
Monitor return cost trends
Therefore, managers can take quick corrective action.

Click to Buy Returns Management KPI Dashboard in Google Sheets
KPI Trend Sheet Tab
In this sheet:
-
KPI dropdown available in Range C3
-
Displays KPI Group
-
Unit of KPI
-
Type (Lower the Better or Upper the Better)
-
Formula
-
KPI Definition
-
Trend chart for selected KPI
This sheet helps users understand the full background of each metric.

Click to Buy Returns Management KPI Dashboard in Google Sheets
Actual Number Sheet Tab
Here, you enter:
- MTD actual values
- YTD actual values
- Monthly data
You can change the month in Range E1. Enter the first month of the year in E1 to align reporting.

Target Sheet Tab
In this sheet, you enter:
-
Monthly MTD targets
-
YTD targets
These targets drive performance comparison in the dashboard.

Click to Buy Returns Management KPI Dashboard in Google Sheets
Previous Year Number Sheet Tab
This sheet stores:
-
Previous year MTD numbers
-
Previous year YTD numbers
The dashboard automatically calculates year-over-year change.

Click to Buy Returns Management KPI Dashboard in Google Sheets
KPI Definition Sheet Tab
This sheet includes:
- KPI Name
- KPI Group
- Unit
- Formula
- Definition
It ensures KPI standardization across the organization.

Advantages of Returns Management KPI Dashboard in Google Sheets
Click to Buy Returns Management KPI Dashboard in Google Sheets
Real-Time Visibility
You instantly see performance changes when you select a month.
Clear Target Tracking
You compare Actual vs Target easily. Therefore, you improve accountability.
Year-Over-Year Analysis
You measure growth and improvement compared to last year.
Better Cost Control
You monitor return cost per unit. As a result, you reduce operational waste.
Improved Customer Experience
You track complaint and exchange rates. Consequently, you enhance service quality.
Easy Customization
Google Sheets allows flexible customization without complex tools.
Best Practices for the Returns Management KPI Dashboard
Define KPIs Clearly
Always write simple and clear KPI definitions.
Update Data Monthly
Regular updates ensure accurate reporting.
Use Conditional Formatting Smartly
Up/down arrows help users understand performance quickly.
Align Targets with Business Goals
Set realistic and measurable targets.
Monitor Trends Consistently
Trend analysis reveals long-term patterns.
Maintain Clean Data Entry
Ensure accurate input in Actual and Target sheets.
How Does This Dashboard Improve Business Performance?
Click to Buy Returns Management KPI Dashboard in Google Sheets
The dashboard improves performance because it:
-
Reduces return rates
-
Controls refund cost
-
Improves processing speed
-
Enhances product quality monitoring
-
Strengthens inventory recovery
-
Improves profitability
Therefore, businesses gain operational efficiency and financial control.
Conclusion
Returns management directly affects profitability and customer satisfaction. However, companies often overlook structured monitoring.
The Returns Management KPI Dashboard in Google Sheets centralizes MTD, YTD, Target vs Actual, and Previous Year comparisons in one powerful system. Moreover, it standardizes KPI definitions and provides visual insights through conditional formatting.
If your organization wants better return control, stronger accountability, and improved margins, this dashboard provides the perfect solution.
Frequently Asked Questions with Answers
Click to Buy Returns Management KPI Dashboard in Google Sheets
Can small businesses use this dashboard?
Yes. Small and large businesses can customize it easily.
Do I need advanced skills to use it?
No. Basic Google Sheets knowledge is sufficient.
How often should I update data?
You should update it monthly for accurate insights.
Can I add more KPIs?
Yes. You can expand the KPI Definition sheet anytime.
Does it support automation?
Yes. You can integrate Google Forms or Apps Script for automation.
Visit our YouTube channel to learn step-by-step video tutorials
Youtube.com/@NeotechNavigators
Watch the step-by-step video tutorial:
Click to Buy Returns Management KPI Dashboard in Google Sheets