The publishing industry moves fast. Deadlines tighten. Content volume increases. Revenue targets grow every quarter. Meanwhile, editorial teams, marketing teams, and sales teams must align perfectly.
However, many publishing businesses still rely on scattered spreadsheets and manual reports. As a result, leaders struggle to measure real performance.
So, how can you track circulation, digital reach, revenue, engagement, and operational efficiency in one structured system?
The answer is simple.
You need a Publishing KPI Scorecard in Google Sheets.
This ready-to-use template helps you monitor 10 powerful KPIs in one dynamic scorecard. Moreover, it updates automatically when you select a month. Therefore, you gain instant monthly and yearly insights without complex tools.
What Is a Publishing KPI Scorecard in Google Sheets?
A Publishing KPI Scorecard in Google Sheets is a structured performance monitoring template designed specifically for publishing businesses.
It tracks key publishing metrics such as:
- Revenue growth
- Subscription performance
- Circulation numbers
- Advertising revenue
- Digital engagement
- Production efficiency
Instead of reviewing multiple reports, you can view everything in one dashboard. Additionally, the scorecard provides visual indicators like traffic lights and up/down arrows. As a result, managers instantly understand performance direction.
How Does the Publishing KPI Scorecard Work?
Click to Buy Publishing KPI Scorecard In Google Sheets
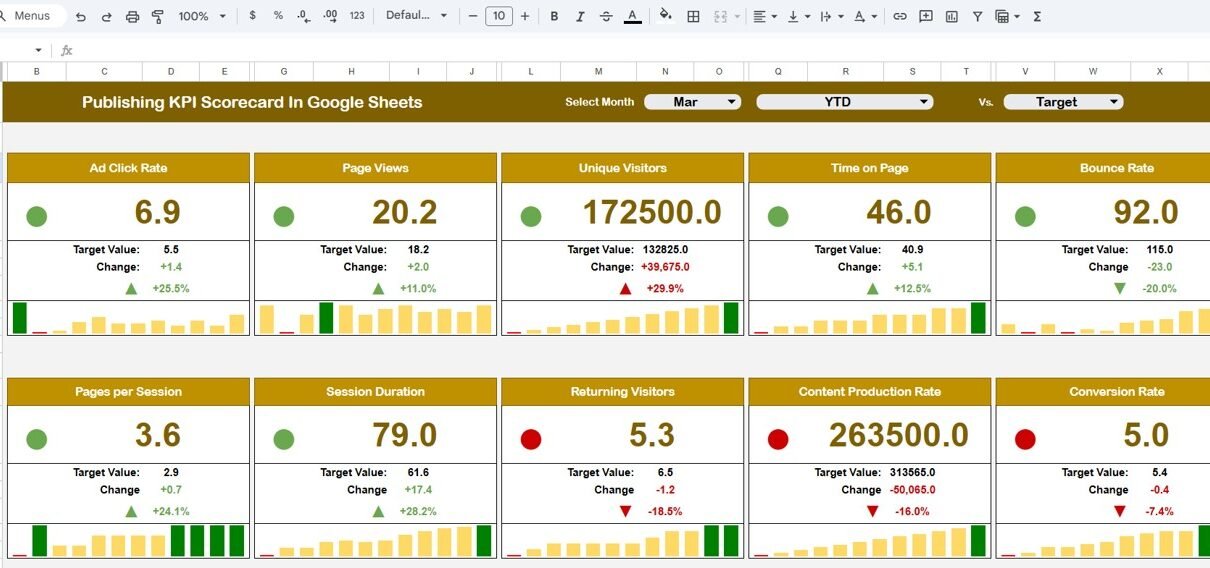
This scorecard contains 10 carefully selected KPIs. At the top of the dashboard, you will find a Month Drop-Down Selector.
When you select a month:
-
All numbers update automatically
-
Traffic light indicators change
-
Percentage change arrows refresh
-
MTD and YTD data adjust instantly
Moreover, you can:
-
Click MTD to view monthly performance
-
Click YTD to view yearly performance
Therefore, you gain complete control over performance analysis.
What Sheets Are Included in the Publishing KPI Scorecard?
This template contains structured sheets for complete monitoring.
Dashboard Sheet Tab
This is the main scorecard page.
At the top, you can select the month from the drop-down list. Immediately, all KPI numbers update.
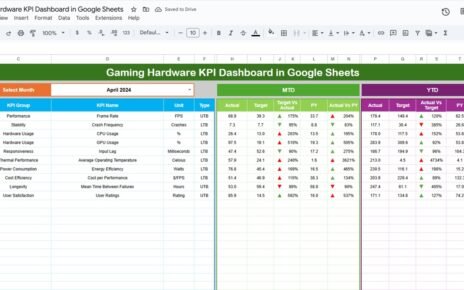
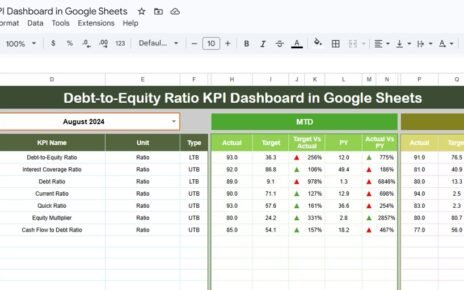
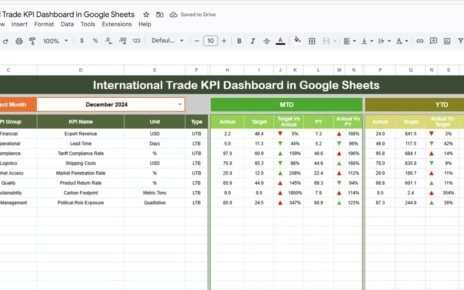
The dashboard shows:
- MTD Actual
- Target
- Previous Year
- Target vs Actual
- Previous Year vs Actual
- Percentage change
- Traffic light indicators
- Up and down arrows
Because of these features, managers instantly identify performance trends.

Click to Buy Publishing KPI Scorecard In Google Sheets
Trend Sheet Tab
On Cell C3, you can select any KPI from the drop-down.
The sheet displays:
-
KPI Group
-
Unit
-
KPI Type (Lower the Better or Upper the Better)
-
KPI Formula
-
KPI Definition
Additionally, it shows trend charts for:
-
Monthly performance
-
Yearly performance
Therefore, you visualize long-term growth clearly.

Click to Buy Publishing KPI Scorecard In Google Sheets
KPI Definition Sheet Tab
This sheet contains structured KPI information.
You enter:
- KPI Name
- KPI Group
- Unit
- Formula
- Definition
Because of this standardization, all team members understand the KPIs clearly.

Click to Buy Publishing KPI Scorecard In Google Sheets
Data Input Sheet Tab
In this sheet, you input actual data.
You enter:
-
Monthly MTD numbers
-
YTD cumulative numbers
-
Target values
-
Previous year data
Once you update the data, the dashboard refreshes automatically.

Click to Buy Publishing KPI Scorecard In Google Sheets
Colour Settings Sheet
This sheet controls visual formatting.
You define:
-
Traffic light thresholds
-
Green, Yellow, Red conditions
-
Percentage change limits
-
Arrow logic
Therefore, you maintain consistent visual signals.

Click to Buy Publishing KPI Scorecard In Google Sheets
How Does MTD and YTD Tracking Improve Publishing Performance?
MTD helps you:
-
Monitor short-term results
-
Adjust marketing strategy quickly
-
Identify monthly revenue gaps
YTD helps you:
-
Evaluate annual targets
-
Measure overall growth
-
Compare performance year over year
Together, they provide complete clarity.
Advantages of Publishing KPI Scorecard in Google Sheets
Click to Buy Publishing KPI Scorecard In Google Sheets
Real-Time Monthly Tracking
You monitor performance instantly.
Automatic Visual Indicators
Traffic lights and arrows highlight performance direction.
Cloud Accessibility
You access the scorecard from anywhere.
Easy Customization
You modify KPIs according to your publishing model.
Clear Performance Accountability
Teams understand targets clearly.
Cost-Effective Solution
Google Sheets eliminates expensive BI tools.
Improved Decision-Making
You rely on structured data instead of assumptions.
Best Practices for the Publishing KPI Scorecard
To maximize results, follow these best practices:
Define Clear Publishing Goals
Align KPIs with revenue and growth strategy.
Update Data Monthly
Maintain data discipline.
Standardize KPI Definitions
Use the KPI Definition Sheet properly.
Review Performance Regularly
Conduct monthly review meetings.
Avoid KPI Overload
Focus on 10 high-impact metrics.
Maintain Accurate Thresholds
Update colour settings based on business goals.
How Can This Scorecard Improve Revenue Growth?
Click to Buy Publishing KPI Scorecard In Google Sheets
When you track:
- Advertising revenue
- Subscription revenue
- Churn rate
- Acquisition cost
You identify growth opportunities quickly. Moreover, you optimize marketing spend and content strategy effectively.
As a result, revenue increases sustainably.
Conclusion
Publishing businesses must track performance carefully. However, manual reporting creates confusion and delays.
The Publishing KPI Scorecard in Google Sheets provides structured tracking, automatic updates, traffic light signals, and clear MTD and YTD analysis.
Because it combines financial, operational, and digital KPIs, it delivers complete visibility.
If you want better control, improved accountability, and stronger revenue growth, this scorecard provides a simple yet powerful solution.
Frequently Asked Questions (FAQs)
Click to Buy Publishing KPI Scorecard In Google Sheets
What is a Publishing KPI Scorecard?
It is a structured template that tracks publishing performance using 10 key metrics.
Can I customize the KPIs?
Yes. You can add or modify KPIs in the KPI Definition Sheet.
What does Lower the Better mean?
It means lower values indicate better performance, such as churn rate.
Do I need advanced skills to use this template?
No. Basic Google Sheets knowledge is enough.
Can I use this for digital-only publishing?
Yes. You can adjust KPIs based on your business model.
Visit our YouTube channel to learn step-by-step video tutorials
Youtube.com/@NeotechNavigators
Watch the step-by-step video tutorial: