In today’s crowded digital marketplace, brands must do more than exist — they must stay visible and memorable. However, many marketing teams still struggle to measure brand awareness effectively. As a result, decision-makers often rely on scattered reports and incomplete data.
Therefore, businesses need a centralized and structured system to track brand visibility. More importantly, they need real-time insights that support smarter marketing decisions.
That is exactly where the Brand Awareness KPI Dashboard in Google Sheets becomes a powerful solution.
This ready-to-use dashboard helps marketing managers, brand strategists, and business owners monitor critical awareness metrics in one dynamic interface. Moreover, it transforms raw data into meaningful insights that drive growth.
In this comprehensive guide, you will learn everything about the Brand Awareness KPI Dashboard in Google Sheets, including its structure, features, advantages, best practices, and frequently asked questions.
What Is a Brand Awareness KPI Dashboard in Google Sheets?
Click to Buy Brand Awareness KPI Dashboard in Google Sheets
A Brand Awareness KPI Dashboard in Google Sheets is an interactive performance tracking system that measures how well your brand reaches and engages your target audience.
Instead of reviewing multiple reports, you can monitor all key awareness metrics in one centralized dashboard. Consequently, your team saves time and improves decision-making.
This dashboard tracks each KPI with:
-
Unit of measurement
-
Aggregation formula
-
KPI definition
-
Performance type (Lower the Better or Upper the Better)
Because of this structured approach, marketers can quickly evaluate campaign effectiveness and brand visibility trends.
Why Is Brand Awareness Tracking Important?
Brand awareness directly influences customer trust, lead generation, and long-term revenue. However, without proper measurement, marketing efforts lose direction.
When you track awareness KPIs consistently, you can:
- Understand audience reach
- Measure campaign impact
- Optimize marketing spend
- Improve brand positioning
- Identify growth opportunities
Therefore, a dedicated KPI dashboard becomes essential for modern marketing teams.
Key Features of the Brand Awareness KPI Dashboard in Google Sheets
Click to Buy Brand Awareness KPI Dashboard in Google Sheets
This ready-to-use solution includes several powerful capabilities. Let us explore them step by step.
Fully Interactive Dashboard
The dashboard provides a centralized view of all brand awareness KPIs. As soon as you select a month, the entire dashboard updates automatically.
MTD and YTD Performance Tracking
You can monitor both short-term and long-term performance without manual calculations. Consequently, you gain complete visibility into brand trends.
Actual vs Target Comparison
The dashboard highlights performance gaps instantly. Therefore, teams can take corrective action quickly.
Smart Conditional Formatting
Up and down arrows visually indicate KPI performance. As a result, users can identify issues at a glance.
Previous Year Comparison
Year-over-year analysis helps you understand whether your brand awareness improves over time.
Dynamic KPI Intelligence
Each KPI includes:
- Unit
- Formula
- Definition
- KPI Type (LTB/UTB)
Because of this, the dashboard serves both as a reporting tool and a KPI knowledge base.
How Many Worksheets Are Included in the Dashboard?
The Brand Awareness KPI Dashboard in Google Sheets contains six powerful worksheets, each designed for a specific purpose.
Let us explore each sheet in detail.
1. Dashboard Sheet Tab – The Main Control Center
The Dashboard sheet acts as the primary interface of the entire system. Here, users can view complete KPI performance in one screen.
Key Functionalities
- Month selection available in cell D3
- Automatic dashboard refresh based on selected month
- MTD and YTD performance tracking
- Target vs Actual comparison
- Previous Year vs Actual comparison
- Visual performance indicators
What Metrics Are Displayed?
The dashboard shows:
MTD Section
- MTD Actual
- MTD Target
- Previous Year MTD
- Target vs Actual variance
- PY vs Actual variance
- Conditional formatting arrows
YTD Section
- YTD Actual
- YTD Target
- Previous Year YTD
- Target vs Actual variance
- PY vs Actual variance
- Conditional formatting arrows
Because everything appears in one place, decision-makers can evaluate performance instantly.
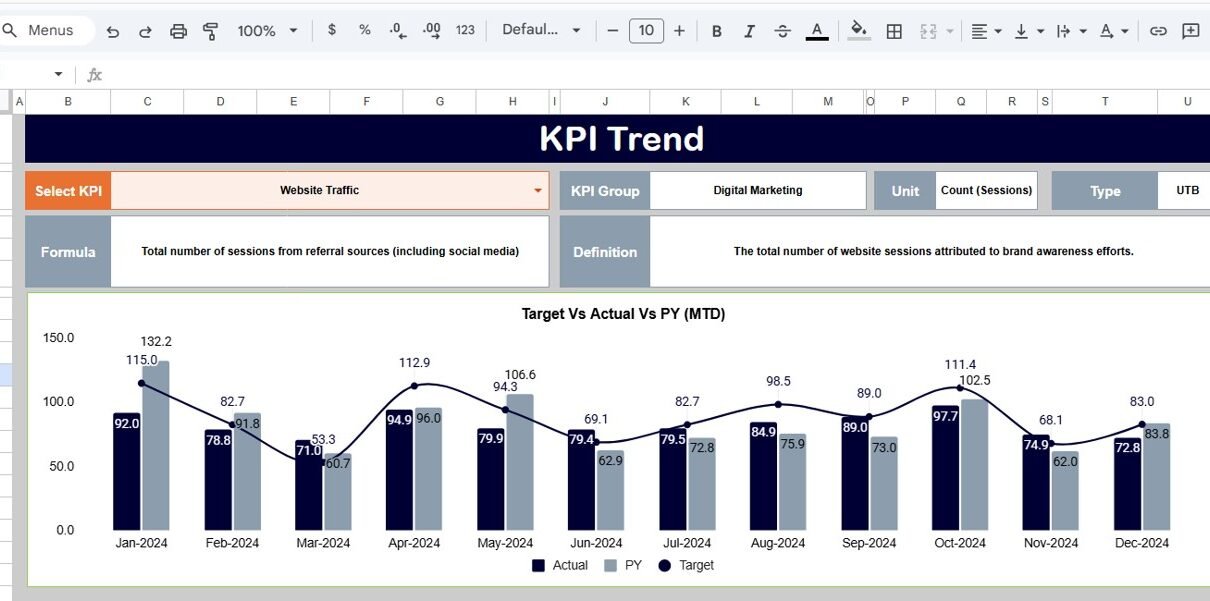
2. KPI Trend Sheet Tab – Deep Performance Insights
The KPI Trend sheet provides detailed analysis for individual KPIs.
How Does It Work?
- Select the KPI name from dropdown in cell C3
- The sheet automatically displays KPI intelligence
Information Available
This sheet shows:
- KPI Group
- Unit of KPI
- KPI Type (Lower the Better / Upper the Better)
- KPI Formula
- KPI Definition
Therefore, this tab helps users understand both performance trends and KPI logic.

Click to Buy Brand Awareness KPI Dashboard in Google Sheets
3. Actual Number Sheet Tab – Where You Enter Current Data
The Actual Number sheet serves as the primary data input area for current-year performance.
How to Use It
- Enter the first month of the year in cell E1
- Input monthly actual values
- The dashboard updates automatically
What Can You Enter?
- MTD actual values
- YTD actual values
- Monthly performance numbers
Because of this structured input method, data entry remains simple and error-free.

4. Target Sheet Tab – Set Your Performance Goals
The Target sheet allows teams to define expected performance levels.
Key Purpose
Here, you enter monthly targets for each KPI.
Data You Must Provide
- MTD targets
- YTD targets
- KPI-wise target values
As a result, the dashboard can instantly calculate performance gaps.

Click to Buy Brand Awareness KPI Dashboard in Google Sheets
5. Previous Year Number Sheet Tab – Historical Comparison Engine
The Previous Year sheet stores last year’s KPI values.
Why Is This Important?
Year-over-year comparison reveals true brand growth. Without historical data, trend analysis remains incomplete.
What You Need to Enter
- Previous year MTD values
- Previous year YTD values
- Monthly historical numbers
Consequently, the dashboard generates meaningful trend insights.

6. KPI Definition Sheet Tab – The KPI Knowledge Hub
The KPI Definition sheet acts as the foundation of the entire dashboard.
Required Fields
In this sheet, you must enter:
- KPI Name
- KPI Group
- Unit
- Formula
- KPI Definition
- KPI Type (LTB or UTB)
Because this tab standardizes KPI logic, it ensures consistent reporting across the organization.

How Does This Dashboard Improve Marketing Decisions?
Click to Buy Brand Awareness KPI Dashboard in Google Sheets
This dashboard does more than display numbers. Instead, it drives strategic action.
Key Decision Benefits
- Quickly identify underperforming campaigns
- Optimize marketing budgets
- Improve brand visibility
- Track campaign effectiveness
- Support data-driven planning
Therefore, marketing teams can move from guesswork to precision.
Advantages of Brand Awareness KPI Dashboard in Google Sheets
Implementing this dashboard delivers multiple business benefits.
🚀 Centralized Performance Visibility
-
View all awareness KPIs in one place
-
Reduce report fragmentation
-
Improve executive reporting
⚡ Faster Decision-Making
-
Instant performance indicators
-
Real-time monthly tracking
-
Quick variance analysis
📊 Better Marketing Accountability
-
Clear target tracking
-
Measurable campaign impact
-
Transparent reporting
🔄 Year-over-Year Insights
-
Track long-term brand growth
-
Compare historical performance
-
Identify seasonal patterns
💰 Cost-Effective Solution
-
No expensive software required
-
Easy to maintain
-
Fully customizable
Best Practices for the Brand Awareness KPI Dashboard in Google Sheets
Click to Buy Brand Awareness KPI Dashboard in Google Sheets
To maximize the dashboard’s value, follow these proven best practices.
Keep KPI Definitions Standardized
Always maintain clear KPI formulas and definitions. Otherwise, teams may interpret metrics differently.
Update Data Consistently
Enter actual numbers regularly. Because timely data improves accuracy, your insights remain reliable.
Focus on Actionable KPIs
Avoid vanity metrics. Instead, track KPIs that influence real business outcomes.
Use Monthly Reviews
Schedule monthly dashboard reviews. As a result, your team can take corrective action quickly.
Maintain Clean Source Data
Remove duplicates and errors from input sheets. Clean data ensures trustworthy insights.
Align Targets With Strategy
Set realistic but challenging targets. Therefore, the dashboard drives meaningful performance improvement.
Who Can Benefit From This Dashboard?
This solution serves multiple roles across the organization.
Ideal Users
- Marketing Managers
- Brand Strategists
- Digital Marketing Teams
- Business Owners
- Marketing Analysts
- Growth Teams
- Agencies
Because the dashboard uses Google Sheets, teams can collaborate easily from anywhere.
Conclusion
Click to Buy Brand Awareness KPI Dashboard in Google Sheets
Brand visibility drives long-term business success. However, without structured measurement, marketing teams struggle to understand their true impact.
The Brand Awareness KPI Dashboard in Google Sheets solves this challenge by providing a centralized, interactive, and intelligent tracking system. Moreover, it empowers teams to monitor performance, compare targets, and uncover growth opportunities with confidence.
Because the dashboard combines automation, clarity, and flexibility, it becomes an essential tool for modern marketing teams.
If you want smarter brand tracking and faster decision-making, this dashboard offers the perfect starting point.
Frequently Asked Questions (FAQs)
What is the main purpose of the Brand Awareness KPI Dashboard?
The dashboard helps marketing teams track, measure, and improve brand visibility using structured KPIs in Google Sheets.
Can beginners use this dashboard easily?
Yes. The dashboard uses simple dropdowns and structured input sheets. Therefore, even beginners can operate it without difficulty.
What does LTB and UTB mean in KPIs?
-
LTB (Lower the Better): Lower values indicate better performance
-
UTB (Upper the Better): Higher values indicate better performance
How often should I update the dashboard?
You should update actual numbers monthly. However, weekly updates can provide even better insights.
Can I customie the KPIs?
Yes. You can add, remove, or modify KPIs in the KPI Definition sheet according to your business needs.
Does this dashboard support year-over-year analysis?
Yes. The Previous Year sheet enables full YoY comparison for both MTD and YTD metrics.
Visit our YouTube channel to learn step-by-step video tutorials
Youtube.com/@NeotechNavigators
Watch the step-by-step video tutorial: