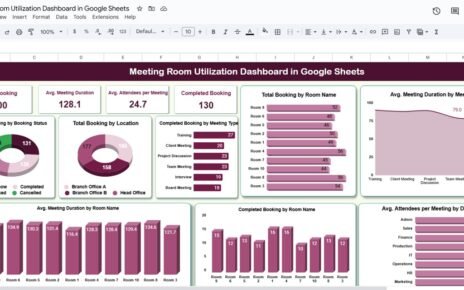
Modern organizations depend heavily on equipment, facilities, and technical assets to run daily operations smoothly. However, managing maintenance activities manually often creates confusion, delays, and cost overruns. Teams struggle to track work orders, monitor technician performance, control maintenance costs, and measure operational efficiency.Service and Maintenance Performance Dashboard in Google Sheets
Therefore, businesses increasingly adopt smart analytics solutions to centralize maintenance data and improve decision-making. One powerful solution is the Service and Maintenance Performance Dashboard in Google Sheets — a fully interactive reporting system designed to monitor work orders, costs, departments, asset performance, and maintenance trends in real time.Service and Maintenance Performance Dashboard in Google Sheets
In this comprehensive guide, we will explain the Service and Maintenance Performance Dashboard in Google Sheets, its structure, features, advantages, best practices, and how it transforms maintenance management into a data-driven process.Service and Maintenance Performance Dashboard in Google Sheets
What Is a Service and Maintenance Performance Dashboard in Google Sheets?
Click to Buy Service and Maintenance Performance Dashboard in Google Sheets
A Service and Maintenance Performance Dashboard in Google Sheets is an interactive analytics tool that helps organizations track maintenance operations using visual reports and automated calculations.
Instead of reviewing multiple maintenance logs, managers analyze performance from a single dashboard. Moreover, dynamic filters allow users to explore data instantly by department, asset category, work order type, priority, or technician.
This dashboard helps organizations:
- Monitor total work orders
- Track open and completed jobs
- Compare estimated vs actual costs
- Analyze department performance
- Evaluate asset maintenance trends
- Measure technician productivity
- Monitor monthly maintenance activities
As a result, organizations gain complete visibility into service operations and improve maintenance efficiency.
Overview of the Service and Maintenance Dashboard Structure
The dashboard includes multiple analytical pages, each focusing on a specific operational perspective.
1. Service & Maintenance Overview — Operational Snapshot
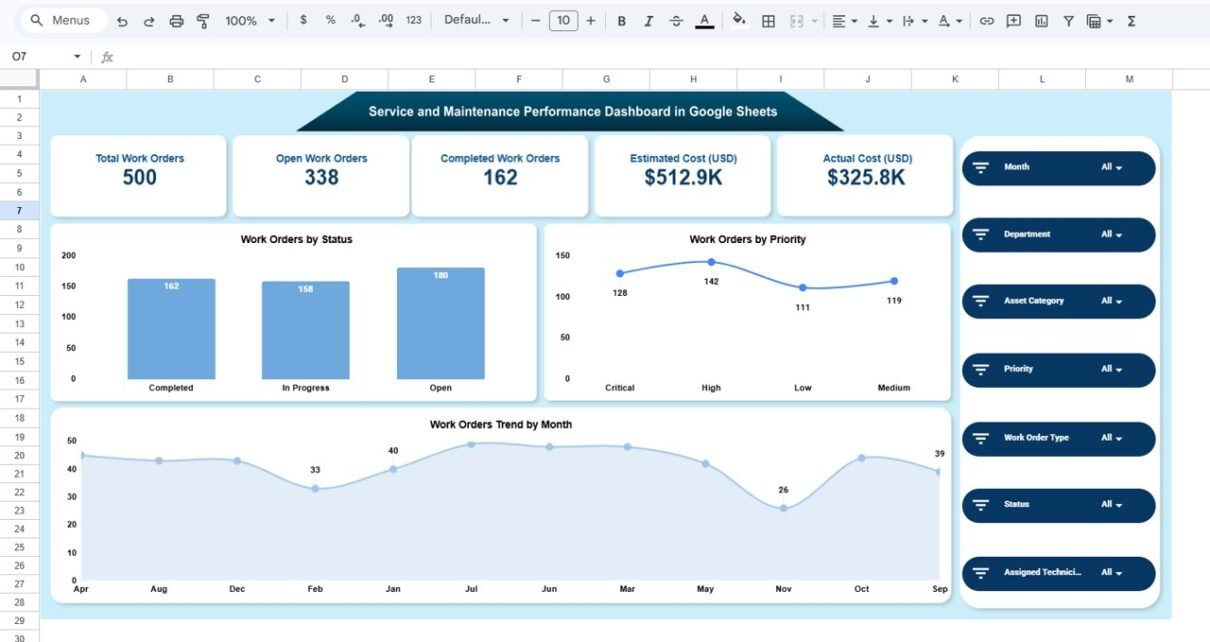
The Overview Page provides a high-level summary of maintenance activities.
KPI Cards Displayed
- Total Work Orders: 500
- Open Work Orders: 338
- Completed Work Orders: 162
- Estimated Cost: $512.9K
- Actual Cost: $325.8K
These KPIs instantly show operational workload and financial performance.
Interactive Filters Available
- Month
- Department
- Asset Category
- Priority
- Work Order Type
- Status
- Assigned Technician
Because slicers update visuals instantly, users analyze performance dynamically.
Key Visualizations
- Work Orders by Status
- Work Orders by Priority
- Work Orders Trend by Month
Managers quickly understand workload distribution and operational progress.

Click to Buy Service and Maintenance Performance Dashboard in Google Sheets
2. Department Performance — Which Departments Perform Best?
Maintenance activities vary across departments. Therefore, department-level analysis becomes essential.
Charts Included
- Work Orders by Department
- Estimated Cost by Department
- Actual Cost by Department
- Completed vs Open Work Orders by Department

Click to Buy Service and Maintenance Performance Dashboard in Google Sheets
3. Order Type Analysis — Understanding Maintenance Activities
Maintenance work typically falls into categories such as preventive, corrective, inspection, or calibration tasks.
Visualizations Available
- Work Orders by Order Type
- Estimated Cost by Order Type
- Actual Cost by Order Type
- Completed vs Open Orders by Type

Click to Buy Service and Maintenance Performance Dashboard in Google Sheets
4. Asset Category Analysis — Asset Reliability Insights
Assets require different maintenance efforts depending on usage and complexity. This page evaluates asset-level performance.
Charts Included
- Work Orders by Asset Category
- Actual Cost by Asset Category
- Estimated Cost by Asset Category
- Completed vs Open Orders by Asset

Click to Buy Service and Maintenance Performance Dashboard in Google Sheets
5. Monthly Trend Analysis — Tracking Maintenance Performance Over Time
Maintenance performance changes throughout the year. Therefore, trend analysis helps identify patterns.
Visual Components
- Actual Cost by Month
- Estimated Cost by Month
- Work Orders by Month
- Completed vs Open Orders Trend

Click to Buy Service and Maintenance Performance Dashboard in Google Sheets
Advantages of Service and Maintenance Performance Dashboard in Google Sheets
Centralized Maintenance Monitoring
All maintenance data appears in one dashboard.
Real-Time Insights
Managers track performance instantly.
Cost Control
Estimated vs actual comparison improves budgeting.
Better Resource Allocation
Teams assign technicians efficiently.
Improved Asset Reliability
Frequent issues become visible quickly.
Cloud Collaboration
Google Sheets allows real-time teamwork.
Easy Implementation
No complex software installation required.
Best Practices for the Service and Maintenance Dashboard
Click to Buy Service and Maintenance Performance Dashboard in Google Sheets
To maximize value, organizations should follow these practices.
. Standardize Work Order Data
Use consistent formats for entries.
. Update Data Regularly
Ensure dashboards reflect current operations.
. Define Maintenance KPIs Clearly
Align metrics with business goals.
. Focus on Preventive Maintenance
Monitor preventive vs corrective work.
. Train Maintenance Teams
Ensure users understand dashboard insights.
. Review Trends Monthly
dentify recurring issues early.
. Monitor Cost Variances
Track estimated vs actual expenses frequently.
Opportunities for Improvement in Maintenance Analytics
Organizations can further enhance analytics by:
- Adding downtime tracking KPIs
- Integrating IoT equipment data
- Predictive maintenance forecasting
- Automated alert systems
- Technician productivity scoring
As analytics maturity grows, maintenance becomes proactive rather than reactive.
Conclusion
Click to Buy Service and Maintenance Performance Dashboard in Google Sheets
The Service and Maintenance Performance Dashboard in Google Sheets transforms maintenance management into a data-driven process. Instead of relying on manual tracking, organizations gain real-time visibility into work orders, department performance, asset reliability, and maintenance costs.
Because the dashboard combines automation, visualization, and interactivity, managers make faster decisions, reduce downtime, and optimize maintenance budgets. Moreover, its structured analytical pages provide complete operational clarity.
In today’s efficiency-driven environment, organizations that monitor maintenance performance using dashboards achieve higher reliability and long-term operational success.
Frequently Asked Questions (FAQs)
What is a Service and Maintenance Dashboard?
It is an analytics dashboard that tracks maintenance work orders, costs, and performance metrics in one centralized system.
Can Google Sheets handle maintenance dashboards effectively?
Yes. Google Sheets supports automation, collaboration, and visualization, making it ideal for operational dashboards.
What data is required for this dashboard?
Work order details, departments, asset categories, costs, priority levels, and technician assignments.
How does this dashboard reduce maintenance costs?
It compares estimated and actual costs, helping managers control expenses.
Who should use this dashboard?
Maintenance managers, facility teams, operations leaders, and analysts.
Does it support multiple departments?
Yes. The dashboard analyzes performance across departments easily.
Can the dashboard be customized?
Absolutely. Users can add KPIs, filters, or additional analysis pages.
How often should data be updated?
Daily or weekly updates provide the best insights.
Does the dashboard help preventive maintenance?
Yes. Trend analysis helps schedule maintenance proactively.
What is the biggest benefit of this dashboard?
Centralized visibility that improves maintenance efficiency and decision-making.
Visit our YouTube channel to learn step-by-step video tutorials
Youtube.com/@NeotechNavigators
Watch the step-by-step video tutorial:
Click to Buy Service and Maintenance Performance Dashboard in Google Sheets