The textile industry operates in a highly competitive environment where manufacturers must control costs, maintain product quality, optimize production efficiency, and meet delivery deadlines. However, many textile companies still rely on manual reports and scattered spreadsheets to monitor their operational performance. As a result, managers often struggle to track key performance indicators, identify production issues, and make data-driven decisions.
Therefore, organizations increasingly use KPI scorecards and analytical dashboards to monitor business performance in real time.
One powerful solution is the Textile Industry KPI Scorecard in Google Sheets. This ready-to-use template helps textile manufacturers track important KPIs, analyze operational performance, and evaluate production efficiency using a clear and structured scorecard system.
In this article, you will learn everything about the Textile Industry KPI Scorecard in Google Sheets, including its structure, features, advantages, best practices, and frequently asked questions.
What Is a Textile Industry KPI Scorecard in Google Sheets?
Click to Buy Textile Industry KPI Scorecard in Google Sheets
A Textile Industry KPI Scorecard in Google Sheets is a performance monitoring tool that tracks critical textile manufacturing metrics using Key Performance Indicators (KPIs).
These KPIs help managers evaluate performance across various operational areas such as:
-
Production efficiency
-
Machine utilization
-
Quality control
-
Inventory management
-
Order fulfillment
-
Cost management
The scorecard collects data from different operational processes and converts it into a clear performance summary.
Moreover, the template uses dynamic calculations, conditional formatting, and dropdown filters. As a result, users can easily analyze performance for different time periods and compare results with targets.
Because the scorecard runs in Google Sheets, users can access it from anywhere and collaborate with team members in real time.
Why Does the Textile Industry Need KPI Scorecards?
The textile manufacturing process involves multiple stages including yarn production, weaving, dyeing, finishing, and distribution. Each stage generates large amounts of operational data.
However, when companies store this information in separate reports, they struggle to analyze overall performance.
For example:
-
Production managers cannot track efficiency trends
-
Quality managers struggle to monitor defect rates
-
Operations leaders lack real-time performance insights
Therefore, companies need a centralized performance monitoring system.
A KPI scorecard solves this challenge because it consolidates all critical performance indicators into one structured dashboard.
As a result, managers can quickly identify issues, improve operational efficiency, and optimize production performance.
Key Features of the Textile Industry KPI Scorecard in Google Sheets
Click to Buy Textile Industry KPI Scorecard in Google Sheets
The Textile Industry KPI Scorecard in Google Sheets is designed to provide clear insights into textile manufacturing performance.
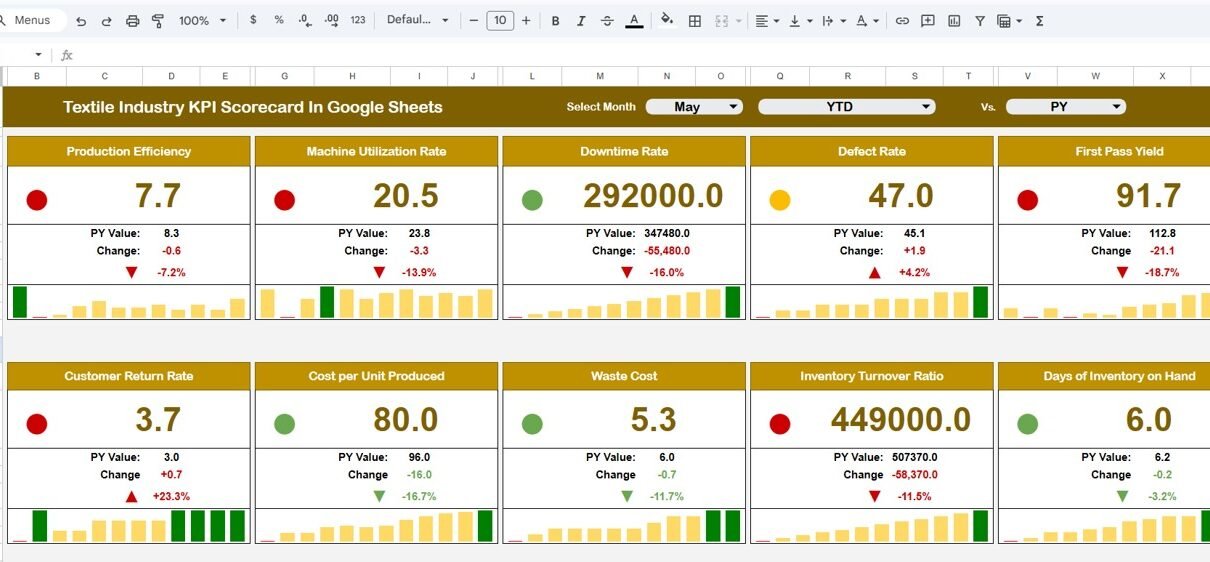
This template tracks 10 different KPIs to evaluate operational performance effectively.
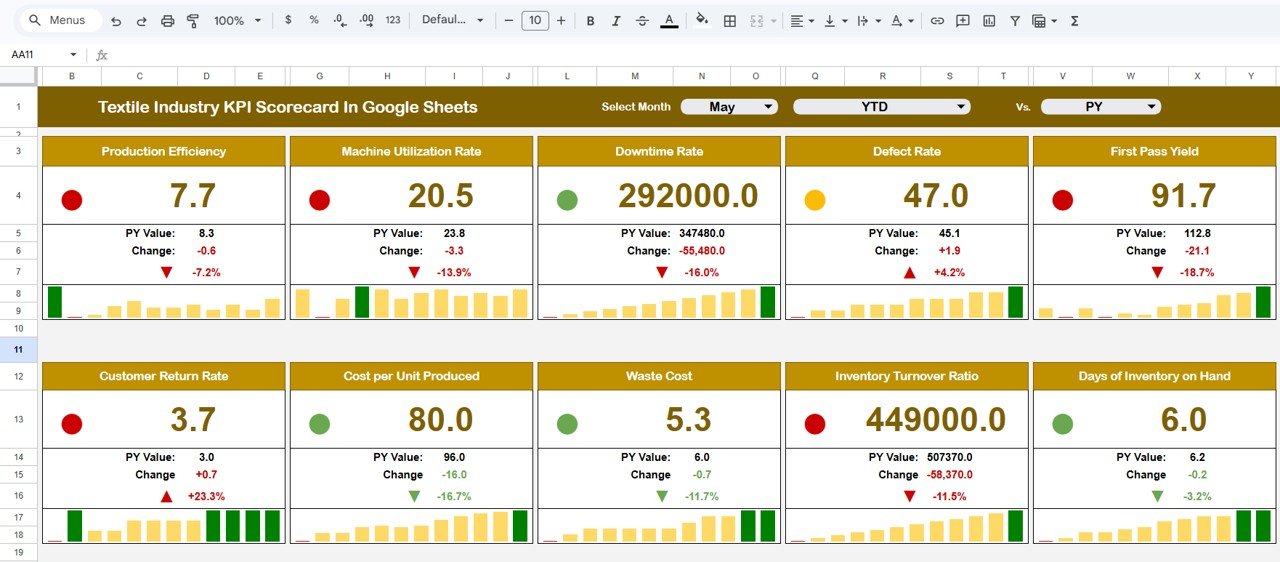
Monthly KPI Scorecard Overview
The scorecard includes a month selection dropdown at the top of the dashboard.
Users can select any month from the dropdown menu. Once the month changes, the entire scorecard automatically updates.
This dynamic functionality allows managers to analyze performance for different months without modifying the data manually.
KPI Performance Comparison
The scorecard displays the following KPI comparisons:
-
Actual KPI performance
-
Target KPI values
-
Percentage performance changes
These comparisons help managers understand whether the organization meets operational targets.
Visual Performance Indicators
The template uses traffic light indicators and arrows to highlight KPI performance.
For example:
-
🟢 Green light indicates KPI performance above target
-
🟡 Yellow light indicates moderate performance
-
🔴 Red light indicates performance below target
Additionally, the dashboard displays upward and downward arrows to indicate performance changes.
Because these visual indicators appear automatically, managers can quickly interpret performance results.
MTD and YTD Performance Analysis
Click to Buy Textile Industry KPI Scorecard in Google Sheets
The scorecard supports both MTD (Month-to-Date) and YTD (Year-to-Date) analysis.
Users can click:
-
MTD to analyze monthly performance
-
YTD to analyze yearly performance
This functionality allows organizations to track both short-term and long-term performance trends.
Worksheets Included in the Textile KPI Scorecard
The Textile Industry KPI Scorecard in Google Sheets contains multiple worksheets that organize performance data efficiently.
Each worksheet serves a specific purpose in the KPI tracking process.
1. Scorecard Sheet – Main KPI Dashboard
The Scorecard Sheet acts as the central interface of the scorecard.
Here, users can monitor all KPI performance metrics in one view.
Key Features of the Scorecard Sheet
-
Month selection dropdown
-
Display of 10 KPI performance indicators
-
Actual vs Target comparisons
-
Traffic light performance indicators
-
Percentage change arrows
-
MTD and YTD performance view options
Because this sheet summarizes performance clearly, managers can quickly evaluate operational results.
Click to Buy Textile Industry KPI Scorecard in Google Sheets
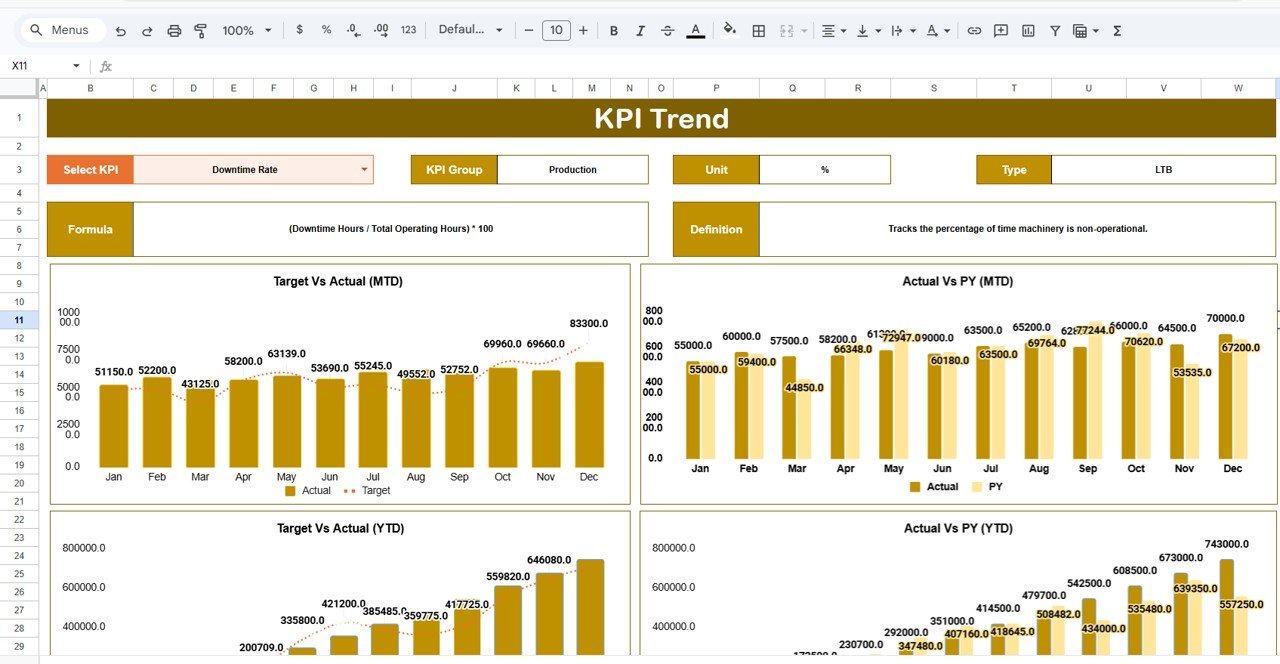
2. Trend Sheet – KPI Performance Trend Analysis
The Trend Sheet allows users to analyze how KPI performance changes over time.
Instead of reviewing raw numbers, managers can study visual performance trends.
How the Trend Sheet Works
Users select the KPI name from the dropdown menu located in cell C3.
Once selected, the sheet automatically displays important KPI information such as:
-
KPI Group
-
Unit of Measurement
-
KPI Type (Lower the Better or Upper the Better)
-
KPI Formula
-
KPI Definition
Additionally, the sheet displays trend charts that show how KPI values change across different months.
Because of this feature, managers can easily identify performance patterns and improvement opportunities.
Click to Buy Textile Industry KPI Scorecard in Google Sheets
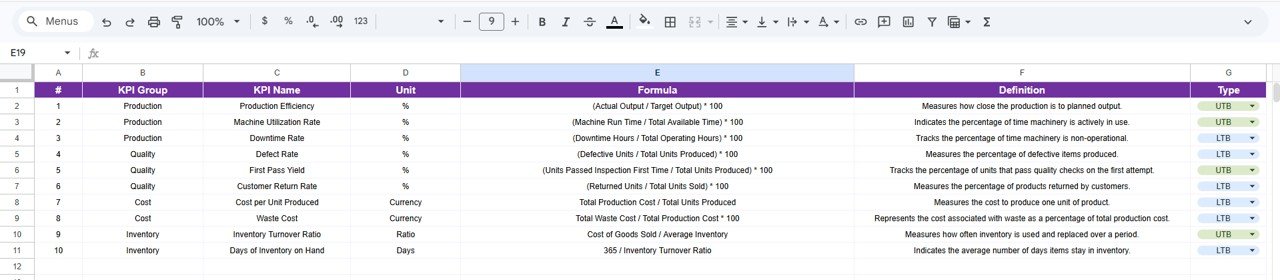
3. KPI Definition Sheet – KPI Documentation
The KPI Definition Sheet stores all information related to KPIs.
This sheet ensures that every KPI is clearly defined.
Information Stored in the KPI Definition Sheet
The sheet contains the following columns:
-
KPI Name
-
KPI Group
-
KPI Unit
-
KPI Formula
-
KPI Definition
This documentation helps maintain consistency across departments.
For example, production managers and quality analysts will interpret KPI values in the same way.
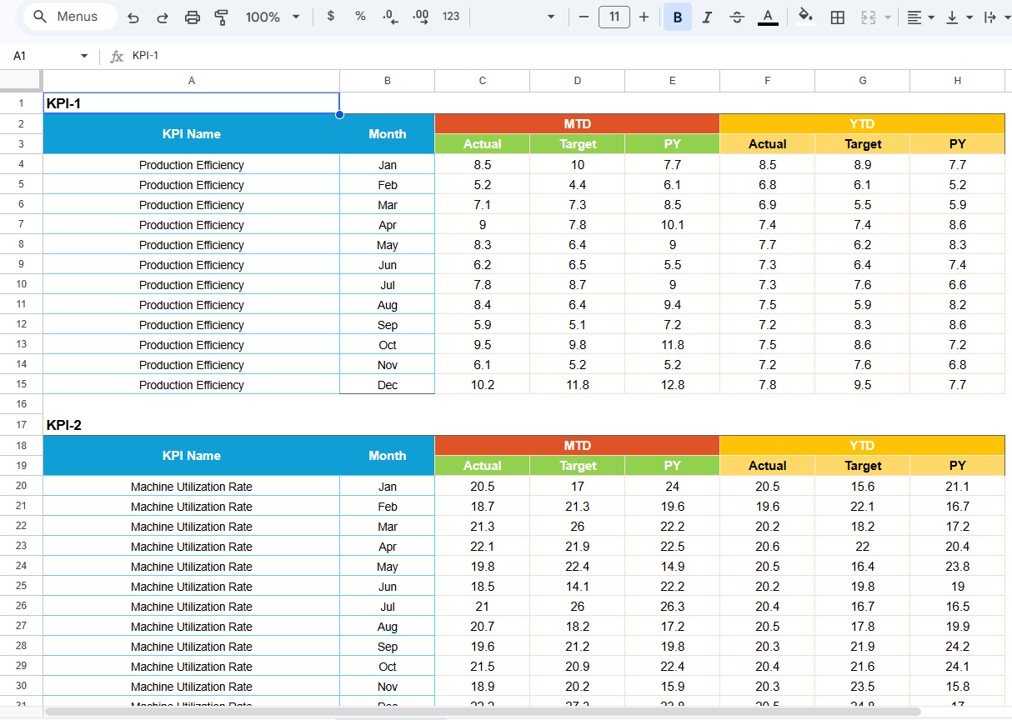
4. Data Input Sheet – KPI Data Entry
The Data Input Sheet is where users enter operational data.
This sheet acts as the primary data source for the scorecard.
Data Entry Process
Users enter performance values such as:
-
Production output
-
Machine utilization
-
Quality defect rate
-
Inventory levels
-
Production cost
Once users update the data, the scorecard automatically updates all calculations and charts.
Therefore, managers always see the most recent performance results.
Click to Buy Textile Industry KPI Scorecard in Google Sheets
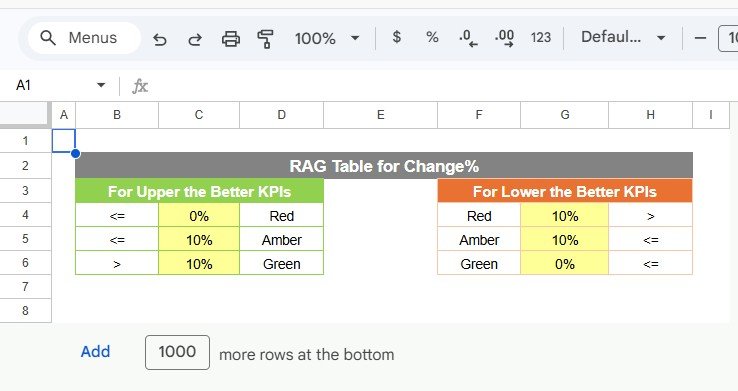
5. Colour Settings Sheet – Performance Indicator Settings
The Colour Settings Sheet controls the visual appearance of KPI indicators.
Users can customize performance thresholds for:
-
Green performance
-
Yellow performance
-
Red performance
Because organizations may have different performance targets, this sheet allows flexible configuration.
Click to Buy Textile Industry KPI Scorecard in Google Sheets
Advantages of Textile Industry KPI Scorecard in Google Sheets
Using a structured KPI scorecard provides many advantages.
Improved Production Visibility
Managers can view operational performance in one centralized dashboard.
Faster Decision Making
Because the dashboard displays real-time insights, managers can make faster decisions.
Better Quality Monitoring
Quality managers can track defect rates and identify quality issues quickly.
Increased Operational Efficiency
Performance tracking helps organizations improve production processes.
Data-Driven Management
Managers rely on data instead of assumptions when making strategic decisions.
Easy Collaboration
Google Sheets allows multiple users to collaborate simultaneously.
Best Practices for the Textile Industry KPI Scorecard
To maximize the effectiveness of the scorecard, organizations should follow several best practices.
Define Clear KPIs
Choose KPIs that directly impact textile production and quality.
Update Data Regularly
Frequent data updates ensure accurate performance analysis.
Set Realistic Targets
Targets should motivate teams while remaining achievable.
Monitor KPIs Monthly
Monthly reviews help identify operational issues early.
Train Teams on KPI Interpretation
Employees should understand how to interpret KPI results correctly.
Conclusion
Click to Buy Textile Industry KPI Scorecard in Google Sheets
The Textile Industry KPI Scorecard in Google Sheets provides an efficient way to track manufacturing performance and analyze operational metrics.
Because the template includes multiple sheets such as Scorecard, Trend, KPI Definition, Data Input, and Colour Settings, organizations can manage KPI tracking effectively.
Moreover, the scorecard displays 10 key KPIs, visual performance indicators, and trend analysis tools that help managers understand operational performance quickly.
Therefore, textile manufacturers can use this scorecard to improve production efficiency, monitor quality metrics, and support data-driven decision making.
an customize KPIs, targets, formulas, and visual indicators according to their operational requirements.
Visit our YouTube channel to learn step-by-step video tutorials
Youtube.com/@NeotechNavigators
Watch the step-by-step video tutorial:
Click to Buy Textile Industry KPI Scorecard in Google Sheets