In today’s fast-paced real estate industry, data plays a critical role in decision-making. From tracking property listings and analyzing regional performance to managing agents and monitoring leads, businesses handle large volumes of data daily. However, when this data stays scattered across spreadsheets, it becomes difficult to analyze and act quickly.
So, how can real estate professionals simplify data management and gain real-time insights?
the Real Estate Dashboard in HTML.
This modern, interactive dashboard helps real estate companies, brokers, and analysts visualize their data in one place. Moreover, it transforms raw data into meaningful insights using clean design, dynamic filters, and interactive charts. As a result, businesses can make faster, smarter decisions and improve overall performance.
What is a Real Estate Dashboard in HTML?
A Real Estate Dashboard in HTML is a web-based analytics solution designed to monitor and analyze key real estate metrics using a visually appealing interface.
Instead of relying on multiple reports, this dashboard allows you to:
- Track property listings, sales, and rentals
- Analyze regional performance and trends
- Monitor agent productivity and lead conversions
- Explore detailed property-level data
- Evaluate customer satisfaction and ratings
Therefore, it provides a complete view of your real estate operations in a single interface.
Why Do You Need a Real Estate Dashboard?
Click to Buy Real Estate Dashboard in HTML
Managing real estate data manually creates confusion and delays. However, when you use an HTML dashboard, you gain clarity and speed.
Key Reasons to Use This Dashboard:
- Centralizes all real estate data
- Provides real-time insights
- Improves decision-making speed
- Enhances operational efficiency
- Offers user-friendly and interactive design
As a result, you can focus more on growing your business instead of managing data.
Key Features of Real Estate Dashboard in HTML
This dashboard includes 5 powerful sections, each designed to provide deep insights into your business.
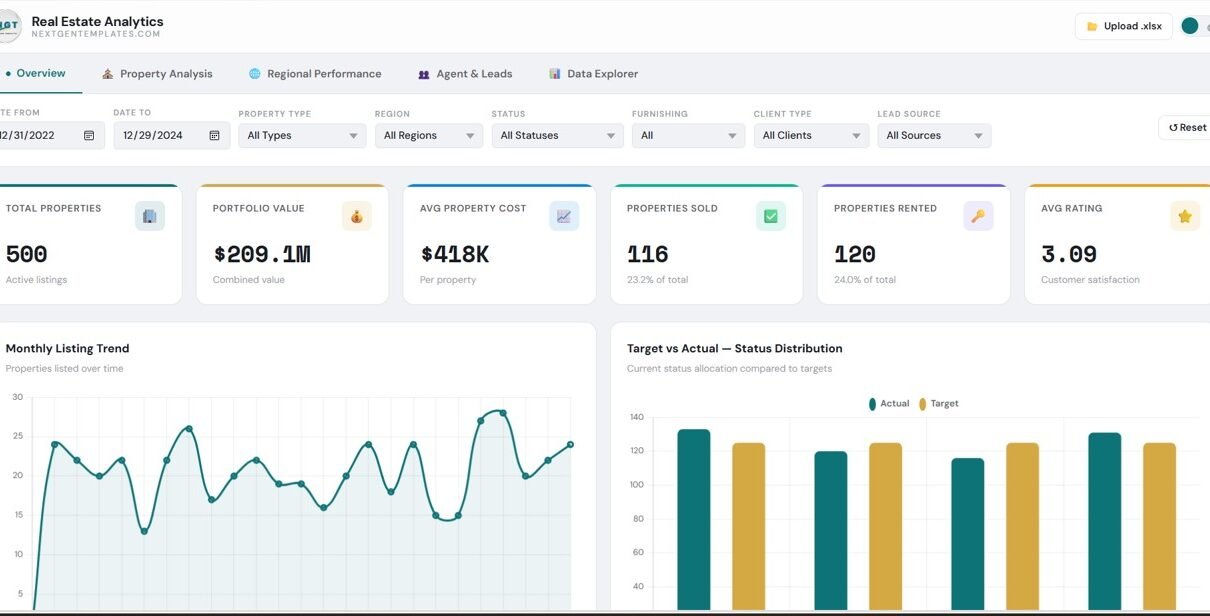
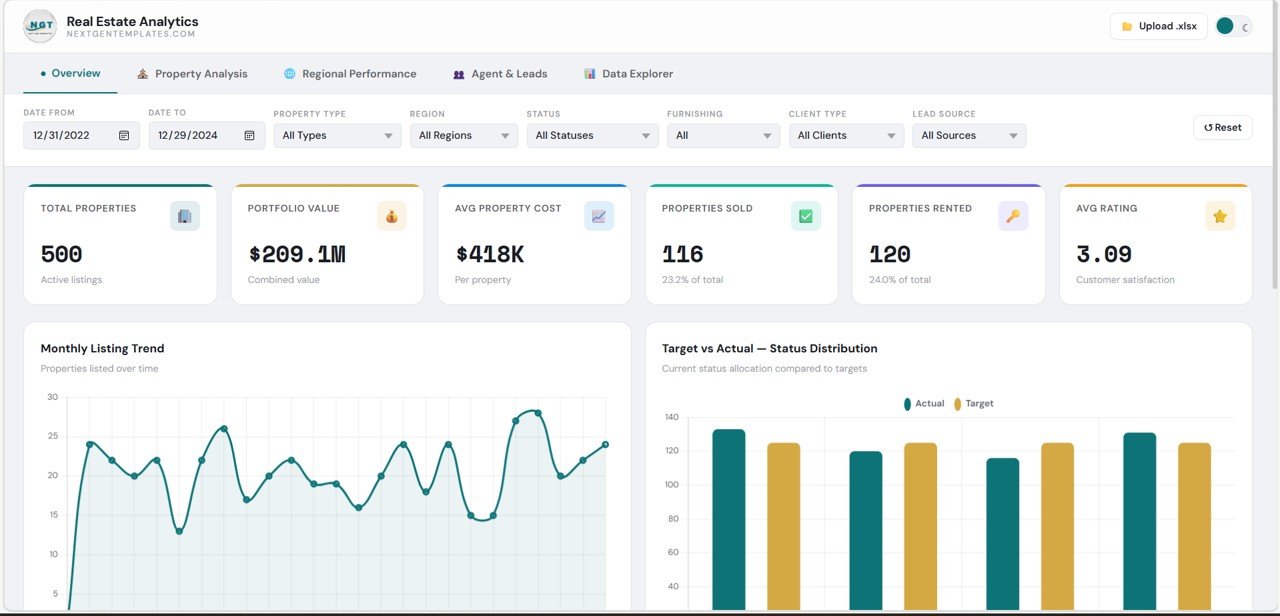
Overview – Get a Complete Snapshot
The Overview section provides a high-level summary of your business performance.
KPI Cards:
- Total Properties
- Portfolio Value
- Average Property Cost
- Properties Sold
- Properties Rented
- Average Rating
Insights:
- Monthly Listing Trends
- Target vs Actual Status Distribution
Therefore, you can quickly understand your overall business health.
Click to Buy Real Estate Dashboard in HTML
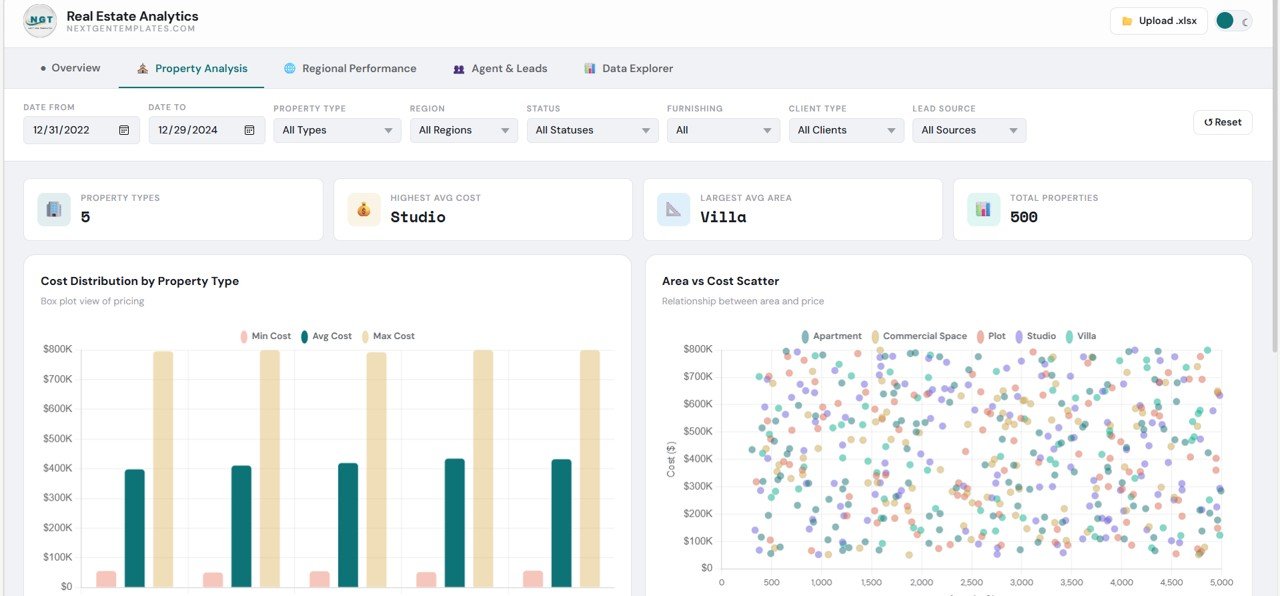
Property Analysis – Understand Property Performance
This section focuses on detailed property-level insights.
🔹 Key Highlights:
- Property Types Count
- Highest Average Cost Property
- Largest Average Area
🔹 Charts:
- Cost Distribution by Property Type
- Area vs Cost Scatter Analysis
Click to Buy Real Estate Dashboard in HTML
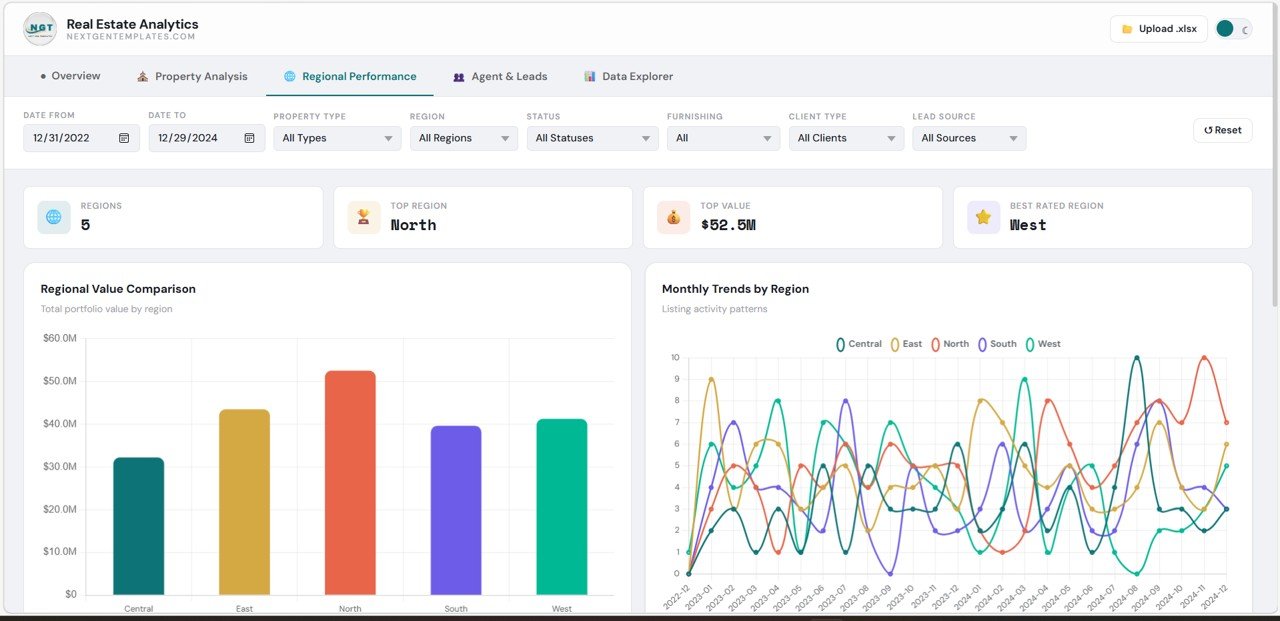
Regional Performance – Analyze Location-Based Trends
The Regional Performance section helps you evaluate how different regions perform.
🔹 Highlights:
- Total Regions
- Top Region
- Best Rated Region
🔹 Charts:
- Regional Value Comparison
- Monthly Trends by Region
Click to Buy Real Estate Dashboard in HTML
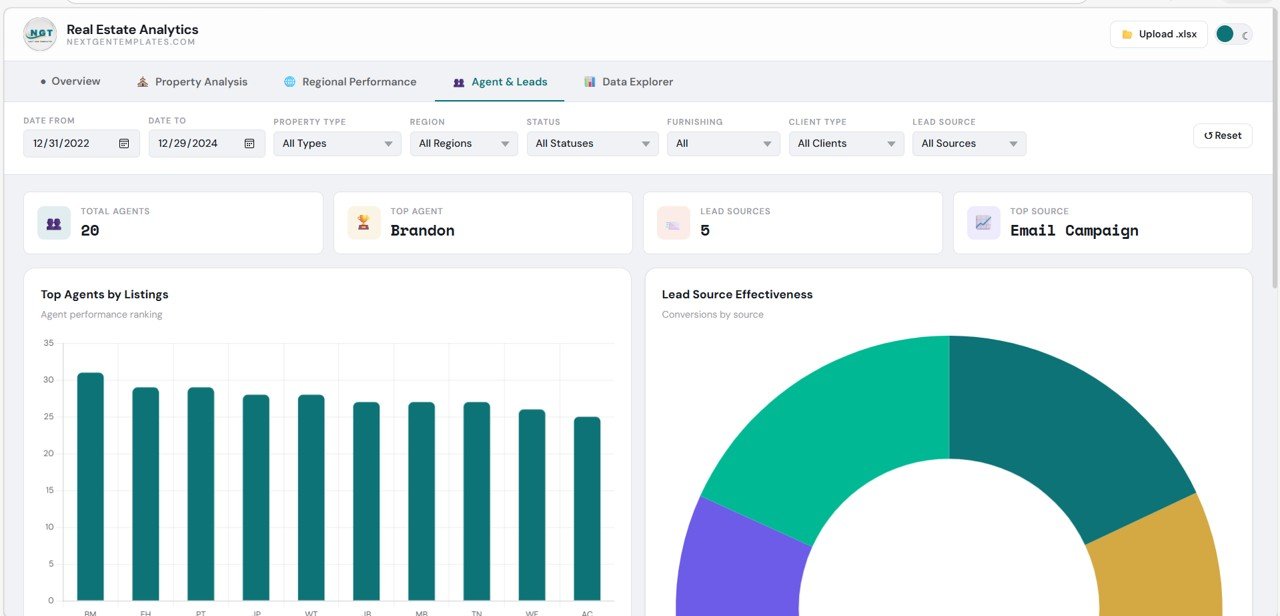
Agent & Leads – Track Sales Team Performance
This section focuses on agent productivity and lead generation.
🔹 KPI Cards:
- Total Agents
- Top Agent
- Lead Sources
- Top Lead Source
🔹 Charts:
- Top Agents by Listings
- Lead Source Effectiveness
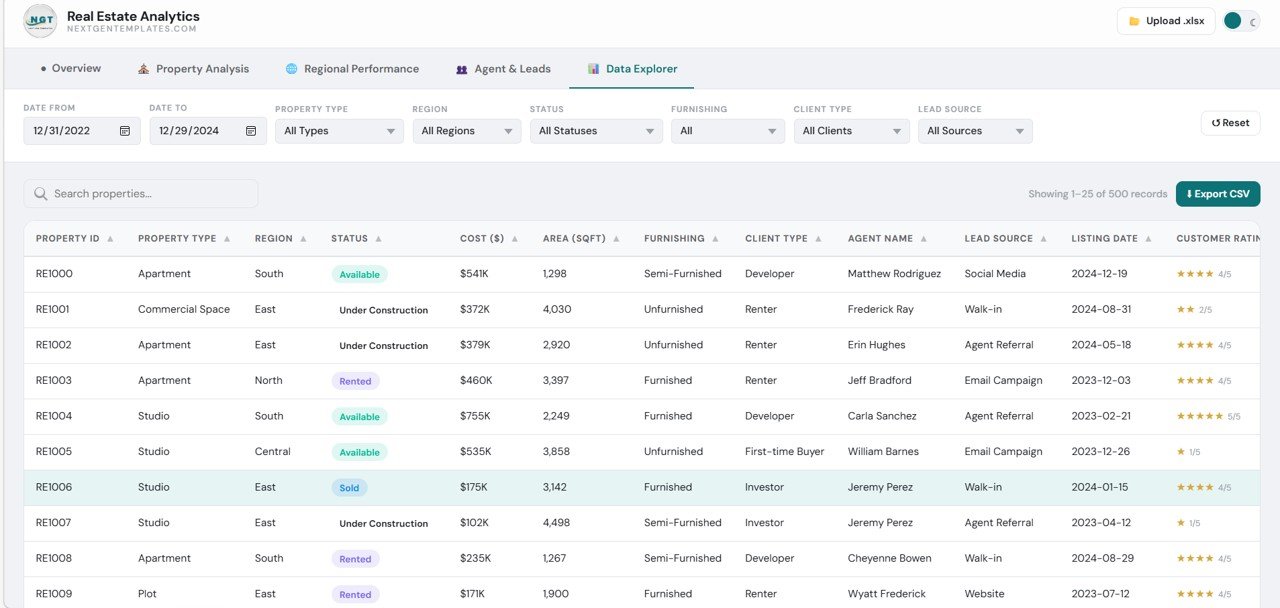
Data Explorer – Deep Dive into Data
The Data Explorer section provides a detailed view of all property records.
🔹 Features:
- Search and filter properties
- View detailed property information
- Export data to CSV
Click to Buy Real Estate Dashboard in HTML
Advantages of Real Estate Dashboard in HTML
Using this dashboard offers several powerful benefits:
Better Decision-Making
- You get real-time insights
- You can act quickly on trends
Improved Data Visualization
- Clean and modern interface
- Easy-to-understand charts
Increased Efficiency
- You reduce manual work
- You save time and effort
Enhanced Team Performance
- You track agent productivity
- You optimize lead management
Scalable and Flexible
- You can customize easily
- You can integrate with multiple systems
How Does This Dashboard Improve Business Performance?
Click to Buy Real Estate Dashboard in HTML
This dashboard does more than display data. It helps you grow your business.
Here’s how:
- It identifies top-performing regions
- It highlights profitable properties
- It tracks sales and rental trends
- It monitors customer satisfaction
- It improves lead conversion strategies
As a result, you can increase revenue and improve efficiency.
Best Practices for the Real Estate Dashboard in HTML
To get maximum value, follow these best practices:
Keep Data Updated
- Refresh data regularly
- Ensure accuracy
Use Filters Effectively
- Apply date, region, and property filters
- Focus on relevant insights
Simplify Visuals
- Avoid clutter
- Highlight key metrics
Monitor KPIs Regularly
- Track sales, profit, and leads
- Identify trends early
Train Your Team
- Ensure everyone understands the dashboard
- Promote data-driven decisions
Opportunities for Improvement
Click to Buy Real Estate Dashboard in HTML
Although this dashboard is powerful, you can enhance it further:
Add Predictive Analytics
- Forecast future sales and demand
Integrate CRM Systems
- Connect customer and lead data
Include Mobile Optimization
- Improve accessibility on mobile devices
Add Drill-Down Features
- Enable deeper data analysis
Who Can Benefit from This Dashboard?
This dashboard is ideal for:
- Real estate companies
- Brokers and agents
- Business analysts
- Property managers
- Investors
Therefore, anyone involved in real estate can benefit from this solution.
How to Use the Real Estate Dashboard in HTML?
Click to Buy Real Estate Dashboard in HTML
Using this dashboard is simple:
- Upload your dataset
- Apply filters (date, region, property type)
- Explore charts and KPIs
- Analyze trends
- Export data if needed
As a result, you can turn raw data into actionable insights.
Conclusion
The Real Estate Dashboard in HTML is a powerful tool for modern real estate businesses. It simplifies data analysis, improves decision-making, and enhances performance.
Moreover, it provides a complete view of your operations, from property listings to agent performance and regional insights. Therefore, you can make smarter decisions and stay ahead in the competitive market.
If you want to transform your real estate data into meaningful insights, this dashboard is the perfect solution.
Visit our YouTube channel to learn step-by-step video tutorials