Hospitality Dashboard in HTML is an interactive, browser-based analytics template designed for hotel managers, resort operators, and hospitality professionals who want to track and optimize every aspect of their business performance without needing any complex software. If you are tired of juggling spreadsheets and generating manual reports, this single-file HTML dashboard consolidates all your critical hospitality KPIs, revenue trends, guest satisfaction data, and operational metrics into one elegant, professional interface.
Whether you are running a boutique hotel, a full-service resort, or a chain of properties, this Hospitality Dashboard in HTML empowers you to make smarter, data-driven decisions in real time. Simply open the file in any modern browser and start exploring your data through dynamic charts, interactive filters, and beautifully designed KPI cards.
In today’s competitive hospitality landscape, having immediate visibility into your operations is essential for staying ahead. This dashboard transforms your raw hotel data into clear, actionable insights that help you increase occupancy, maximize revenue, and deliver exceptional guest experiences consistently.
Click to buy Hospitality Dashboard in HTML
Key Features of Hospitality Dashboard in HTML
- All-in-One KPI Overview — Monitor Total Revenue, Total Bookings, Occupancy Rate, Average Daily Rate (ADR), and Guest Satisfaction Score through visually appealing cards and interactive charts on a single consolidated overview page.
- Deep Revenue Analytics — Understand where your income originates by analyzing Revenue by Room Type, Revenue by Booking Source, Revenue by Guest Segment, and Monthly Revenue Trends to fine-tune your pricing and marketing strategy.
- Guest Experience Tracking — Measure satisfaction scores across different service areas, monitor repeat guest rates, analyze guest demographics, and track complaint resolution efficiency to continuously elevate service quality.
- Occupancy and Room Performance — Compare occupancy across room categories, evaluate seasonal demand patterns, measure average length of stay by guest type, and calculate Revenue Per Available Room (RevPAR) for strategic room pricing.
- Operational Efficiency Monitoring — Track staff productivity by department, service response times, housekeeping turnaround analysis, and cost per occupied room to identify operational bottlenecks and reduce waste.
- Interactive Filters and Slicers — Apply dynamic filters by date range, property, room type, department, and booking channel to drill down into the exact data you need for focused analysis.
- Responsive Web Design — The dashboard adapts flawlessly across desktops, tablets, and mobile phones so you can check your metrics from anywhere, anytime.
- Zero Software Installation — No Excel, no Power BI, no database setup. Just open the HTML file in Chrome, Firefox, or Edge and your dashboard is ready to use.
Dashboard Pages Explanation
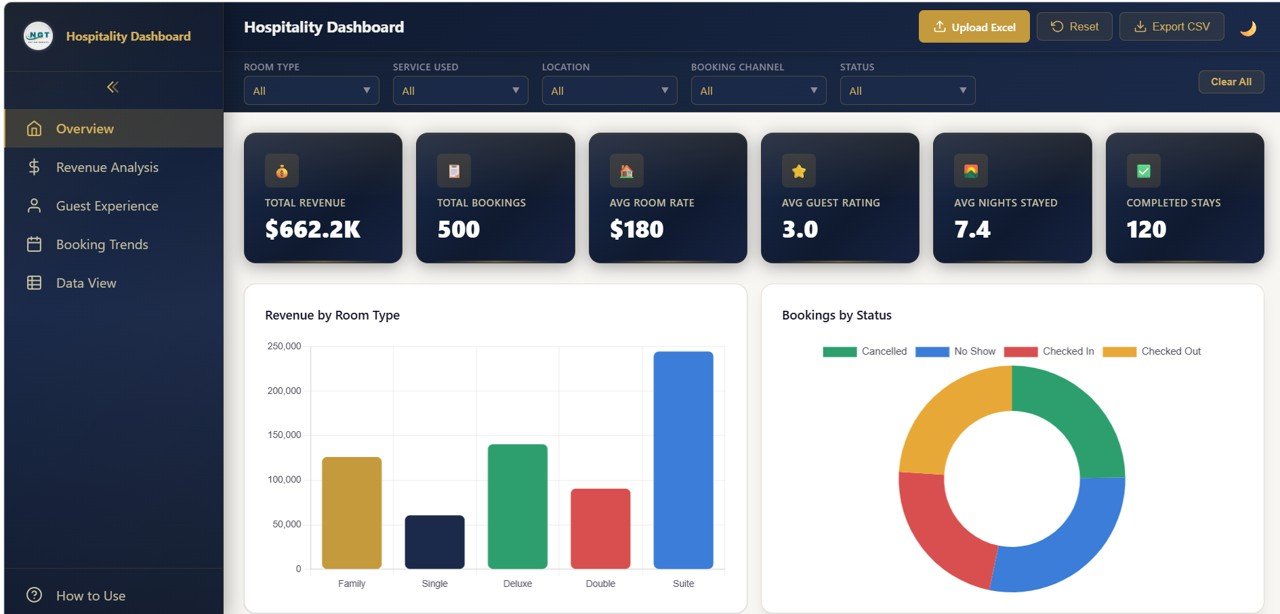
1 — Overview Page
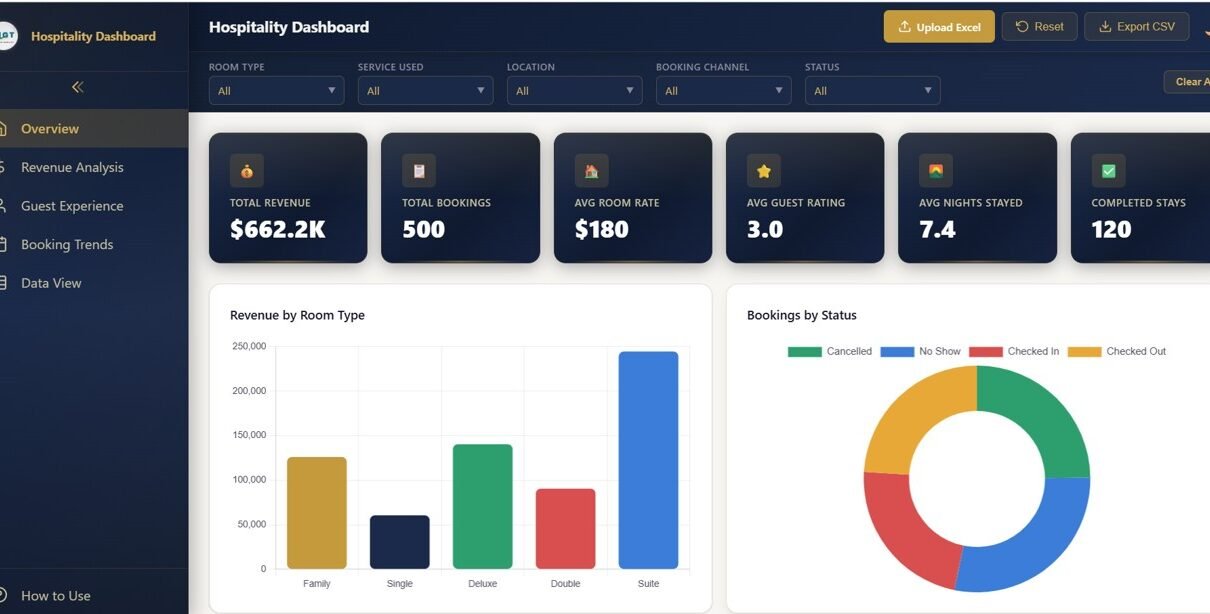
The Overview Page serves as the central command center of the Hospitality Dashboard in HTML. At the top, high-level KPI cards display Total Revenue, Total Bookings, Occupancy Rate, Average Daily Rate (ADR), and Guest Satisfaction Score, giving you an instant snapshot of your hospitality business health. Below the cards, a series of interactive charts visualize important analysis including Revenue by Month, Bookings by Channel, Occupancy by Room Type, and Guest Satisfaction by Department. Multiple slicers allow filtering the entire dashboard by date range, property name, and department for quick, focused analysis. This page is designed to give decision-makers everything they need at a single glance.
Overview Page
2 — Revenue Analysis Page
The Revenue Analysis Page delivers a comprehensive view of your financial performance across multiple dimensions. Detailed charts present Revenue by Room Type, Revenue by Booking Source, Revenue by Guest Segment, and a Monthly Revenue Trend line analysis. This page helps revenue managers and property owners pinpoint their most profitable room categories, identify the highest-performing booking channels, and understand how income fluctuates throughout different seasons. The insights from this page directly support strategic pricing decisions, marketing budget allocation, and revenue optimization efforts.
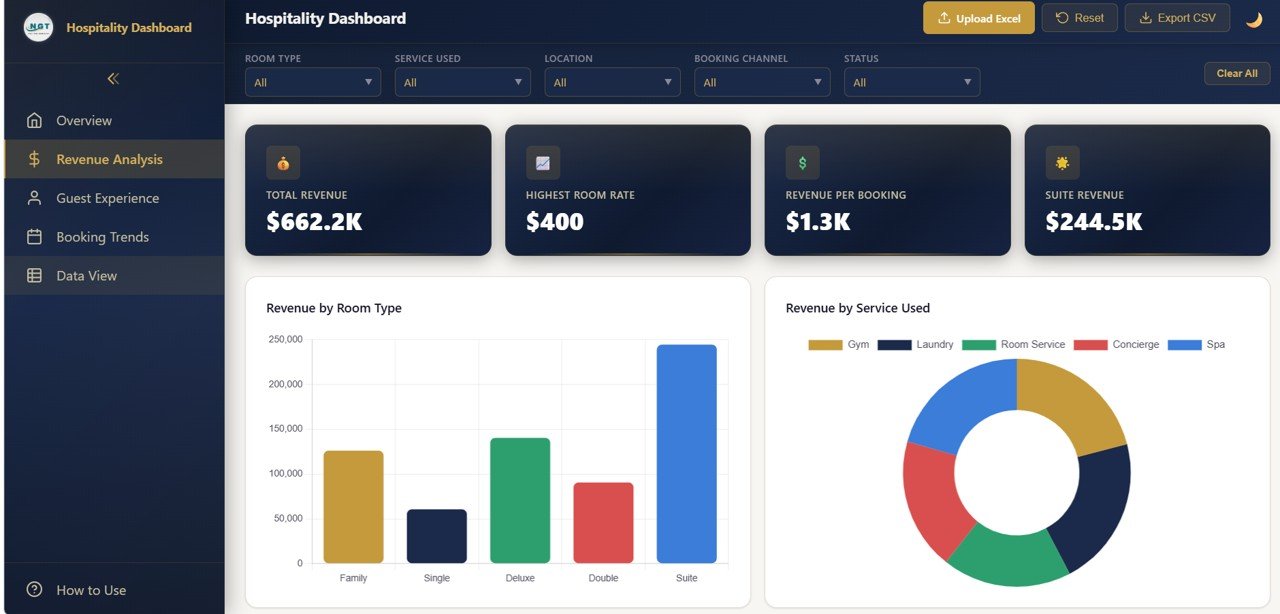
Revenue Analysis Page
3 — Guest Experience Page
The Guest Experience Page is dedicated to understanding and improving guest satisfaction across your hospitality business. Key visualizations include Satisfaction Score by Service Area, Repeat Guest Rate by Month, Guest Demographics breakdown, and Complaint Resolution tracking. Hotels and resorts that consistently monitor these guest experience metrics are far better positioned to enhance their service delivery, reduce negative online reviews, and build lasting guest loyalty. This page transforms raw feedback data into a clear improvement roadmap that your entire team can follow.

Guest Experience Page
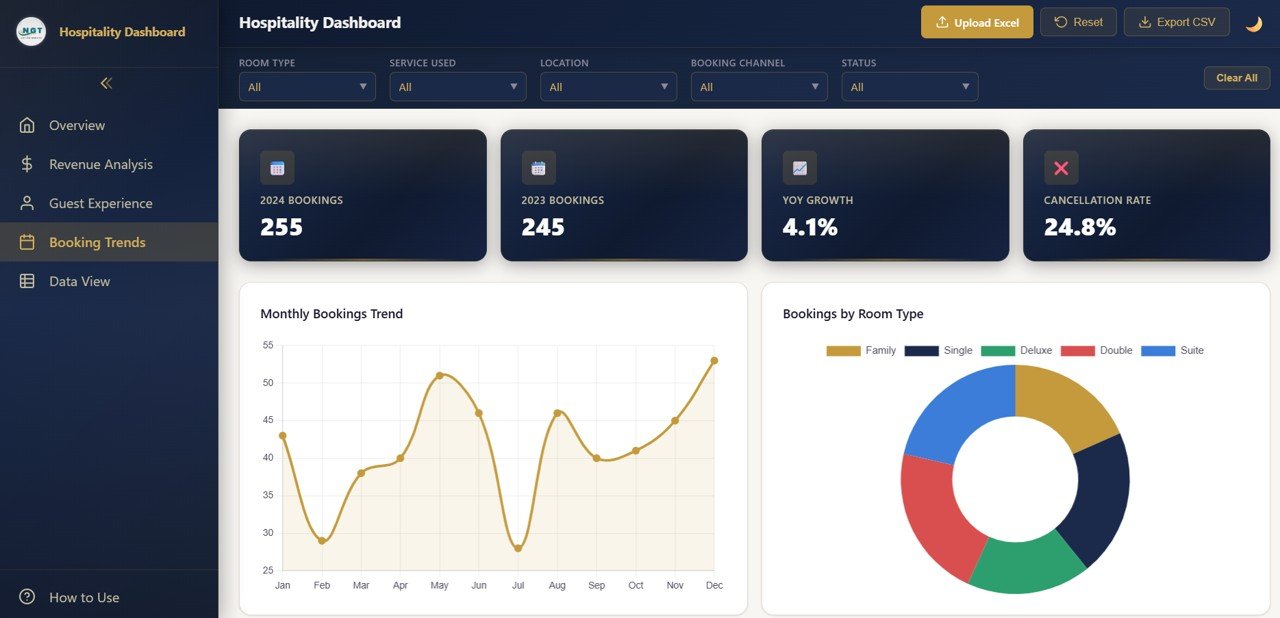
4 — Occupancy and Room Analysis Page
This page delivers essential insights about room utilization and occupancy trends that are critical for capacity planning and pricing strategy. Charts display Occupancy Rate by Room Category, Seasonal Demand Comparison, Average Length of Stay by Guest Type, and Revenue Per Available Room (RevPAR). These metrics enable hotel managers to optimize room inventory allocation, implement dynamic pricing strategies, and maximize revenue potential across different seasons and guest segments. Whether you manage a small property or a large resort chain, this page provides the data foundation for smarter room management.
Advantages of Hospitality Dashboard in HTML
This dashboard delivers several clear advantages that make it a standout choice for hospitality professionals. The browser-based architecture eliminates the need for expensive software licenses or complex installations. You simply download the file, open it in your browser, and your analytics platform is ready to go. The interactive filtering capabilities allow you to slice and dice data from multiple perspectives instantly, saving hours compared to manual spreadsheet analysis.
The professional SaaS-style visual design makes it suitable for executive presentations, investor meetings, and team reviews without any additional formatting work. Every chart, card, and layout element has been crafted to look like an enterprise-grade analytics application rather than a basic report.
Full customizability means you can adapt the dashboard to your unique property type, whether you run a luxury resort, a budget hostel, a vacation rental business, or a boutique city hotel. Simply update the dataset and the dashboard reflects your reality. The responsive design ensures consistent performance across all screen sizes, making it perfect for on-the-go access during property walkthroughs or off-site meetings.
Opportunities for Improvement
While this Hospitality Dashboard in HTML covers a comprehensive range of metrics, there are always opportunities for further enhancement. Integrating live data feeds from property management systems (PMS) like Opera, Cloudbeds, or Hotelogix would enable automatic data refresh without manual updates, creating a truly real-time monitoring experience.
Adding predictive analytics capabilities such as demand forecasting or revenue prediction models powered by historical trends could provide even deeper strategic value. Multi-property comparison views that allow chain operators to benchmark performance across locations side by side would be another powerful addition. Custom threshold alerts that notify managers when specific KPIs drop below target values could also help teams respond faster to emerging issues.
Best Practices
To extract maximum value from this HTML dashboard template, follow these recommended practices. Update your data on a consistent schedule, whether daily, weekly, or monthly, to ensure the dashboard always reflects current performance. Use the filter capabilities to conduct focused analysis on specific time periods, room types, or departments rather than always viewing aggregate data.
Share the dashboard with your management team during regular review meetings to build a data-driven culture across your organization. Define clear KPI targets for each metric and use the dashboard to track progress against those benchmarks. Pay close attention to guest satisfaction trends because even small declines can signal underlying service issues that need immediate attention.
Customize the dashboard to align with your property type and business model. Whether you operate a resort, city hotel, hostel, or serviced apartment, tailor the KPI categories and filters to reflect your unique operational priorities and reporting needs.
Explore Relevant Templates
If you found this Hospitality Dashboard in HTML useful, explore these related templates from NextGenTemplates:
- Real Estate Dashboard in HTML — Track property sales, listings, and market trends with an interactive web dashboard.
- Backpacker Hostels Dashboard in Power BI — Monitor hostel bookings, revenue, and guest insights with Power BI analytics.
- Backpacker Hostels Dashboard in Excel — Comprehensive Excel dashboard for hostel management and performance tracking.
- Camping Resorts Dashboard in Power BI — Analyze resort revenue, guest behavior, and seasonal trends visually.
- Airbnb-style Rentals Dashboard in Power BI — Monitor booking performance and rental revenue across multiple properties.
FAQs
What is the Hospitality Dashboard in HTML?
It is a ready-to-use, interactive web-based dashboard template built for hotels, resorts, and hospitality businesses to track revenue, bookings, occupancy, guest satisfaction, and operational efficiency from a single browser-based interface.
Do I need any special software to open this dashboard?
No. The dashboard runs directly in any modern web browser such as Chrome, Firefox, Edge, or Safari. No additional software installation, plugins, or subscriptions are required.
Can I add my own hotel data to this dashboard?
Yes. You can update the underlying dataset with your actual property data. Once the data is refreshed, the dashboard automatically updates all charts, KPI cards, and visualizations to reflect your information.
Is this dashboard mobile-friendly?
Absolutely. The dashboard features a fully responsive design that adapts seamlessly across desktops, tablets, and smartphones, allowing you to review your analytics on the go during site visits or meetings.
Who is this dashboard designed for?
This dashboard is ideal for hotel owners, general managers, revenue managers, resort operators, hospitality consultants, tourism agencies, and students studying hospitality management or data analytics.
How does this compare to an Excel or Power BI hospitality dashboard?
Unlike Excel or Power BI dashboards, this HTML version requires zero software installation and runs entirely in your web browser. It offers a modern, interactive experience that can be shared instantly with team members and stakeholders without compatibility concerns. For more powerful analytics, explore our Power BI hospitality templates as well.
Conclusion
The Hospitality Dashboard in HTML is a comprehensive, modern, and user-friendly analytics solution that empowers hospitality professionals to make confident, data-driven decisions. From monitoring revenue performance and occupancy rates to tracking guest satisfaction scores and staff productivity, this dashboard covers every critical dimension of hotel management in one beautiful, interactive interface.
If you are ready to transform your hospitality data into powerful, visual insights and elevate your business performance, this dashboard is the perfect investment. Click here to Purchase the Hospitality Dashboard in HTML and start optimizing your hospitality operations today.
For more dashboard templates, step-by-step tutorials, and data analytics resources, visit our YouTube channel and explore hundreds of free learning videos.
👉 Youtube.com/@NeoTechNavigators
Click to buy Hospitality Dashboard in HTML