Independent pharmacies in the United States generate around $530 billion in annual prescription revenue, yet most still run weekly performance reviews on paper or in a basic POS report. The Pharmacy Sales & Operations Dashboard in Google Sheets closes that gap with 4 headline KPIs, 16 pre-built charts, and 4 analytical tabs — Overview, Sales, Inventory, and Prescriptions — all in a single cloud Sheet that costs $9.99 once instead of $200+ per month.
If you run an independent pharmacy, manage a small chain, or consult for retail pharmacy operators, this Google Sheets pharmacy dashboard gives you the analytics layer of a $399/month SaaS without the subscription, the implementation timeline, or the per-user fees. Setup takes under 10 minutes — make a copy, paste your transaction data, and every chart updates automatically.
Pharmacy Sales & Operations Dashboard in Google Sheets
👉 Click here to Purchase the Pharmacy Sales & Operations Dashboard in Google Sheets
Introduction to the Pharmacy Sales & Operations Dashboard
The dashboard is built around a single Data Sheet that holds every transaction — Date, Category, Drug, Department, Supplier, Quantity, Unit Price, Revenue, Payment Method, Pharmacist, and Status. From that one source, the dashboard generates four separate analytical pages plus a Search Sheet for transaction-level lookups.
Because it runs in Google Sheets, the dashboard is browser-native. There’s no Excel installation, no add-ons, no Apps Script setup. Up to 100 collaborators can view or edit the same file via a Google Drive share — pharmacists, technicians, store managers, and owners all looking at the same numbers in real time.
Key Features of Pharmacy Sales & Operations Dashboard
The dashboard tracks 4 headline KPIs — Total Revenue, Transactions, Average Order Value, and Units Dispensed — and visualizes them across 16 pre-built charts. The slicers on the Overview tab let you filter the entire dashboard by date range, category, department, payment method, and supplier without touching a single formula.
- 4 KPI cards for the headline numbers, refreshed every time you add a row to the Data Sheet.
- 4 specialized analytics tabs covering Overview, Sales, Inventory, and Prescriptions.
- Multi-level slicer filtering on the Overview tab.
- Transaction ID lookup in the Search Sheet for audit prep and customer queries.
- Year-over-year comparison chart (Revenue 2023 vs 2024) for quantifying growth.
- Rx vs Generic monthly split for tracking the most important margin lever in retail pharmacy.
- Cloud-native sharing via Google Drive — up to 100 simultaneous editors.
Dashboard Pages Explanation
👉 Click here to Purchase the Pharmacy Sales & Operations Dashboard in Google Sheets
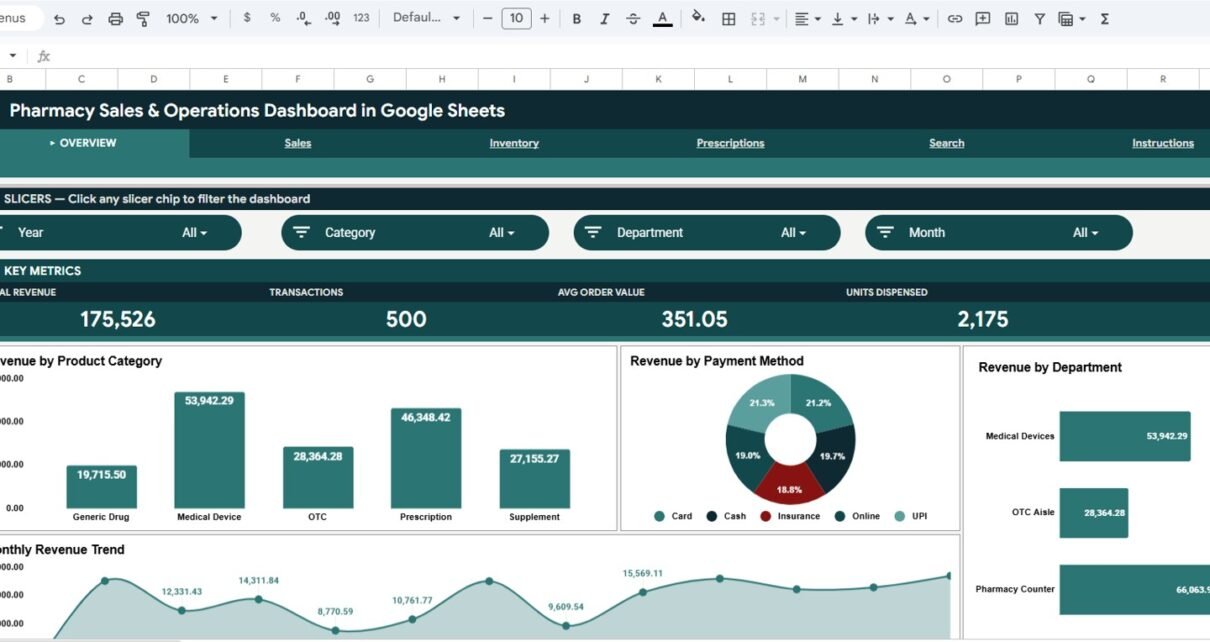
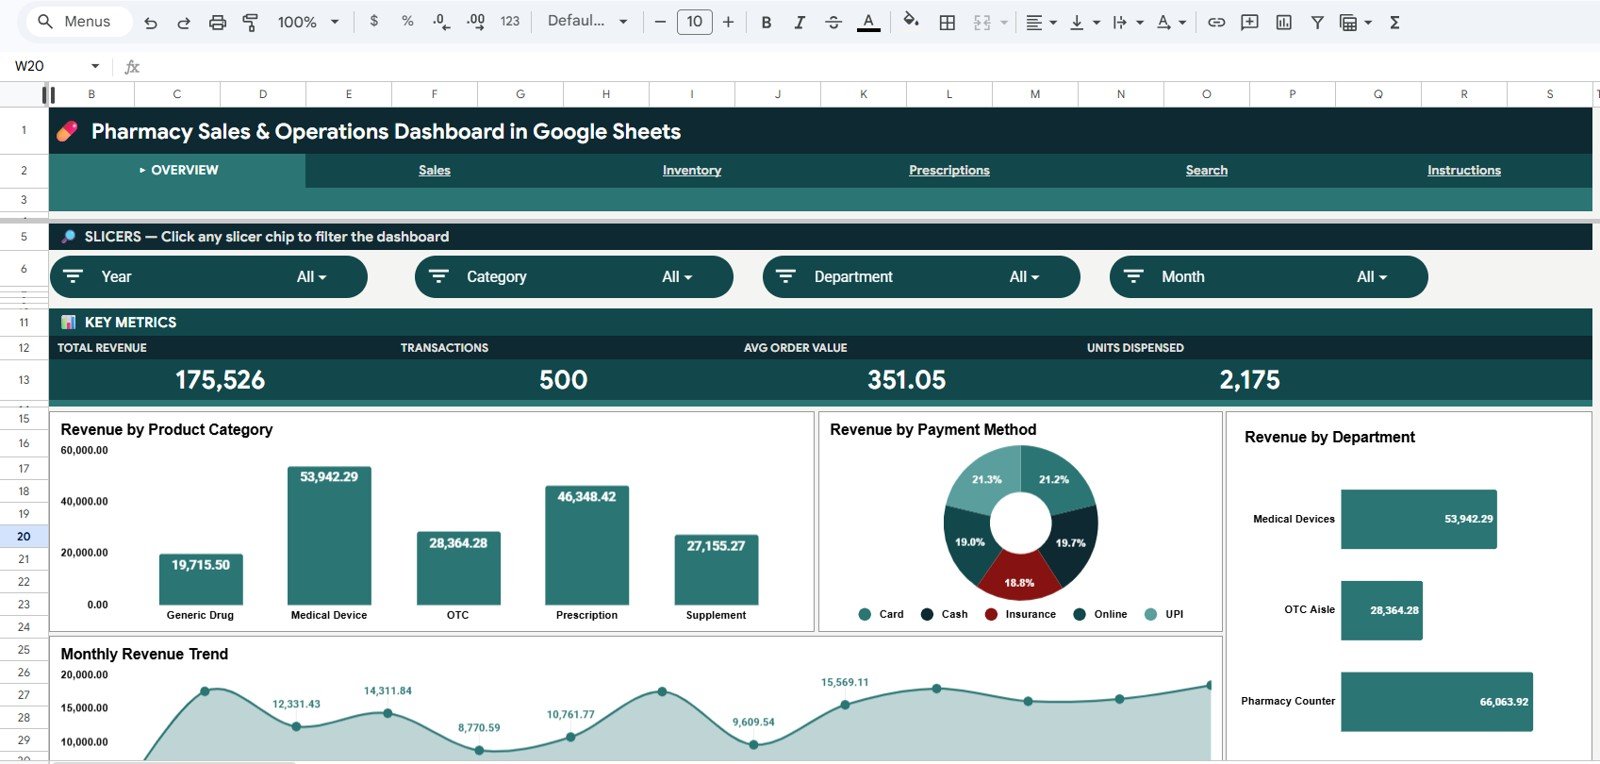
Overview Page
The Overview tab is the home dashboard. It shows the four headline KPI cards at the top, followed by four analytical charts:
- Revenue by Product Category — Antibiotics, OTC, Vitamins, Generics, and any other category you define. Tells you where your margin actually lives.
- Revenue by Payment Method — Cash, card, insurance, digital wallet. Useful when negotiating payment processor fees.
- Revenue by Department — Pharmacy, Front-of-Store, Wellness, and other departments side by side.
- Monthly Revenue Trend — A 12-month time-series view that flags seasonality patterns like cough & cold spikes or allergy-season ramps.
Sales Analysis Page
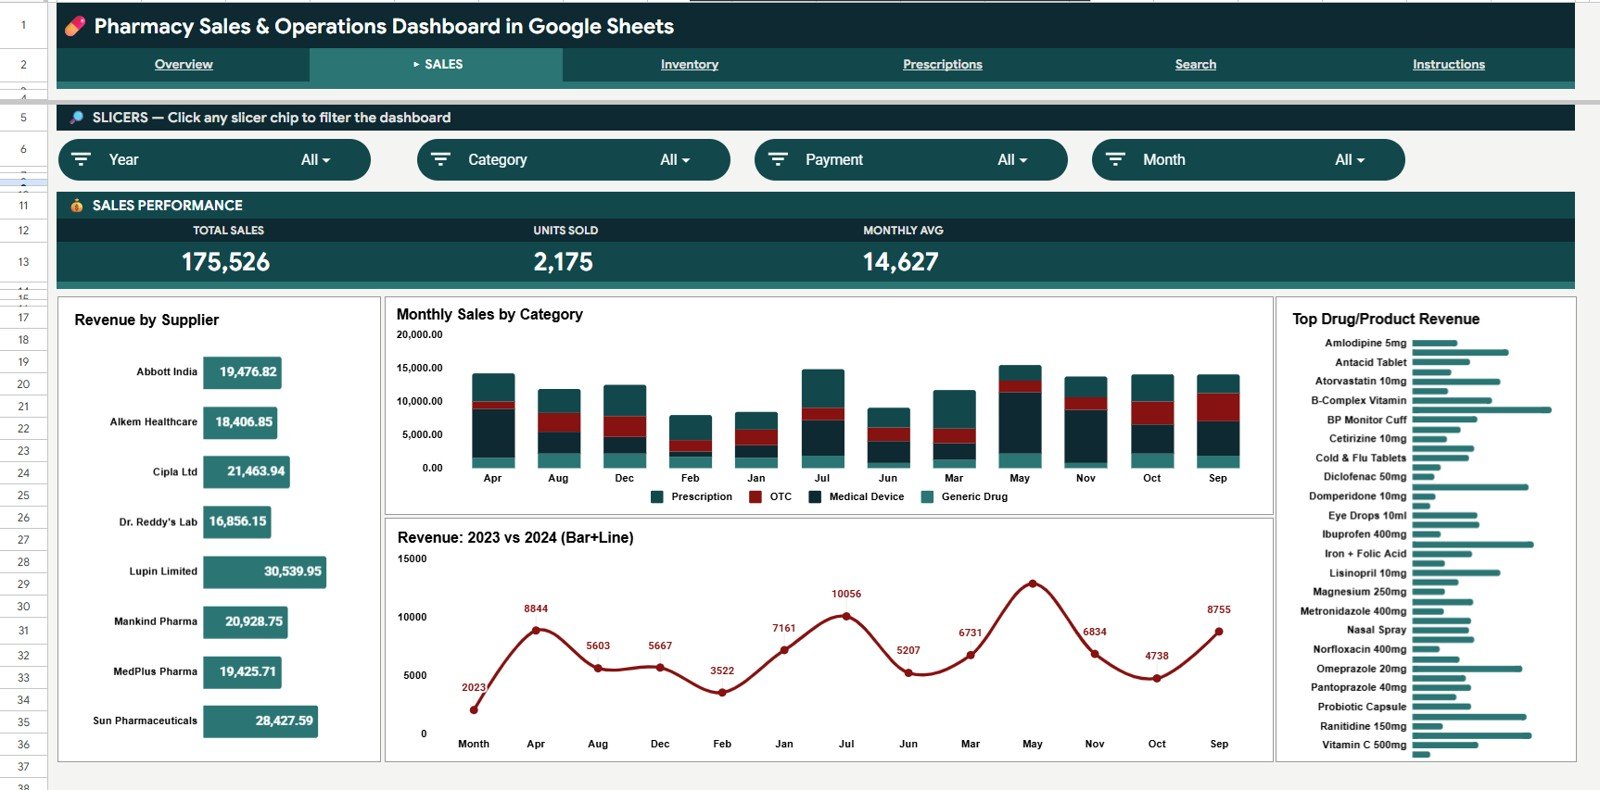
Sales Page
The Sales tab focuses on the dollar side of the business with four supplier-and-product views:
- Revenue by Supplier — Identifies your top wholesalers, the foundation for renegotiating volume rebates.
- Monthly Sales by Category — Stacked monthly view that shows how each category trends through the year.
- Top Drug/Product Revenue — Ranks the highest-revenue SKUs so you know what you can never afford to run out of.
- Revenue 2023 vs 2024 — Side-by-side year-over-year comparison to quantify your growth and benchmark seasonal performance.
Inventory Analysis Page
👉 Click here to Purchase the Pharmacy Sales & Operations Dashboard in Google Sheets
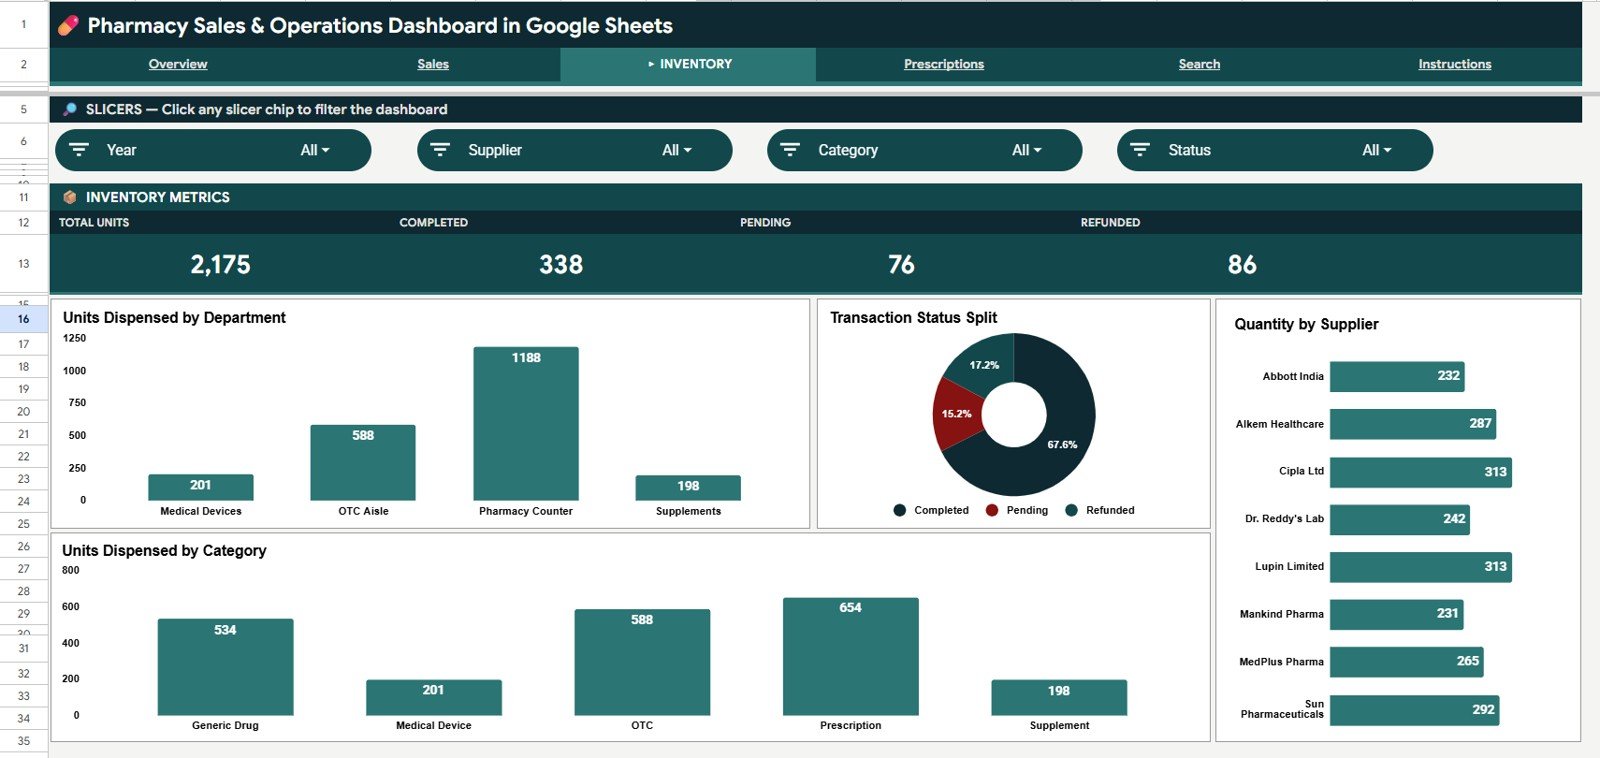
Inventory Page
The Inventory tab is about physical movement instead of dollars — units, status, and quantity:
- Units Dispensed by Department — Volume across Pharmacy, Front-Store, and Wellness.
- Transaction Status Split — Completed vs Returned vs Cancelled, so you can quantify your return-rate exposure.
- Quantity by Supplier — Helpful for reorder planning and supplier consolidation conversations.
- Units Dispensed by Category — Tells you what moves the most units, even when revenue per unit is small.
Prescriptions Analysis Page
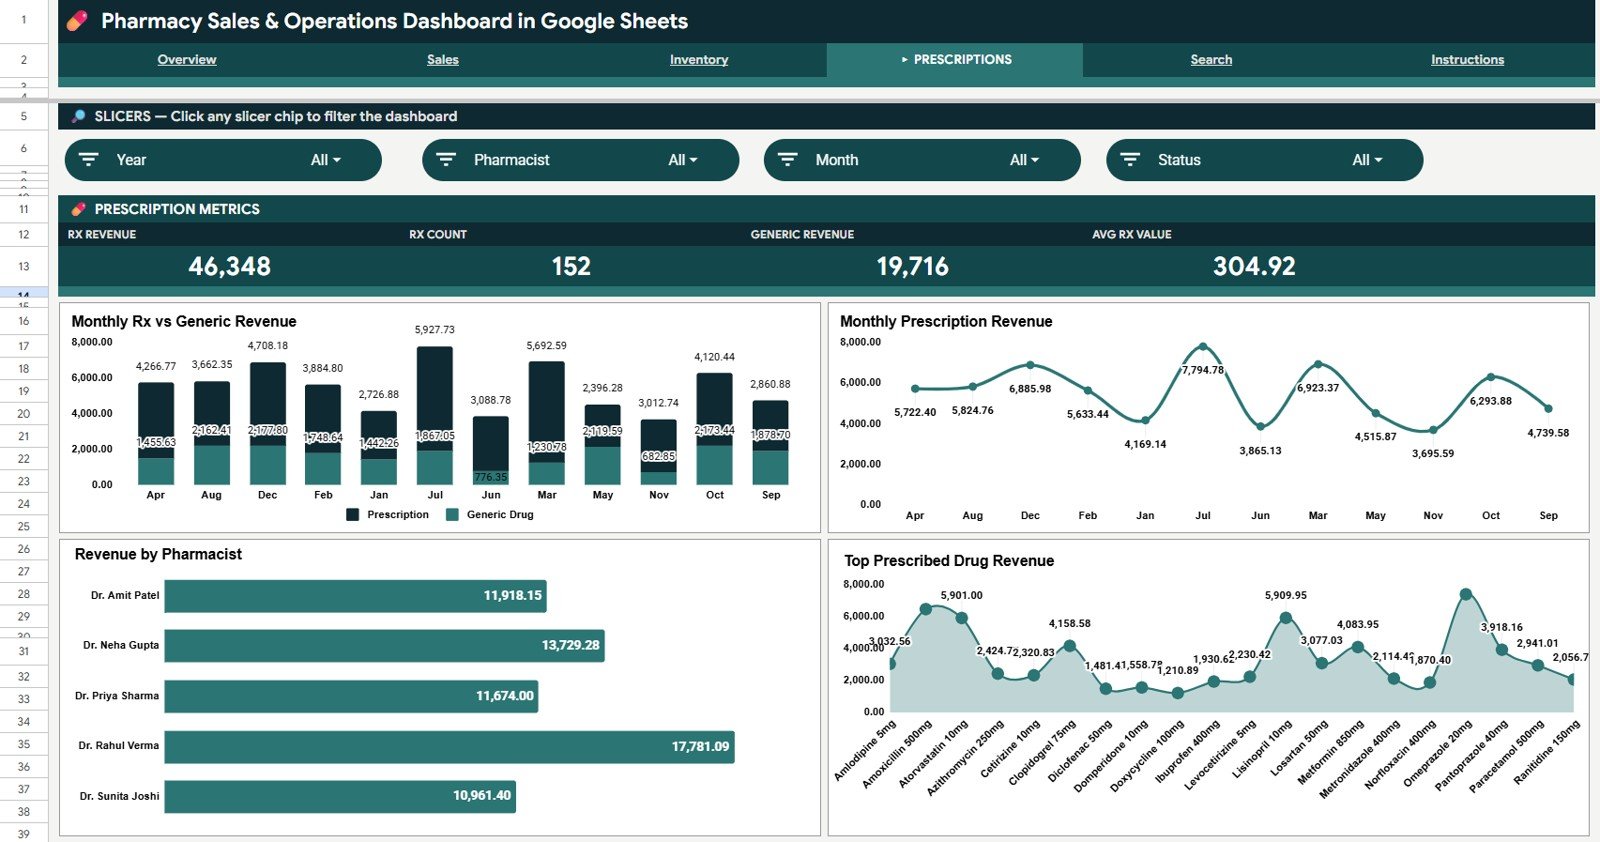
Prescriptions Page
The Prescriptions tab is built for the regulated pharmacy side — the part that drives both compliance and margin:
- Monthly Rx vs Generic Revenue — Brand vs generic split, the single most important margin lever in retail pharmacy.
- Monthly Prescription Revenue — A trend line showing prescription volume month over month.
- Revenue by Pharmacist — Throughput per pharmacist, useful for shift planning and staffing decisions.
- Top Prescribed Drug Revenue — Ranks the highest-grossing prescription SKUs.
Search Sheet tab
👉 Click here to Purchase the Pharmacy Sales & Operations Dashboard in Google Sheets
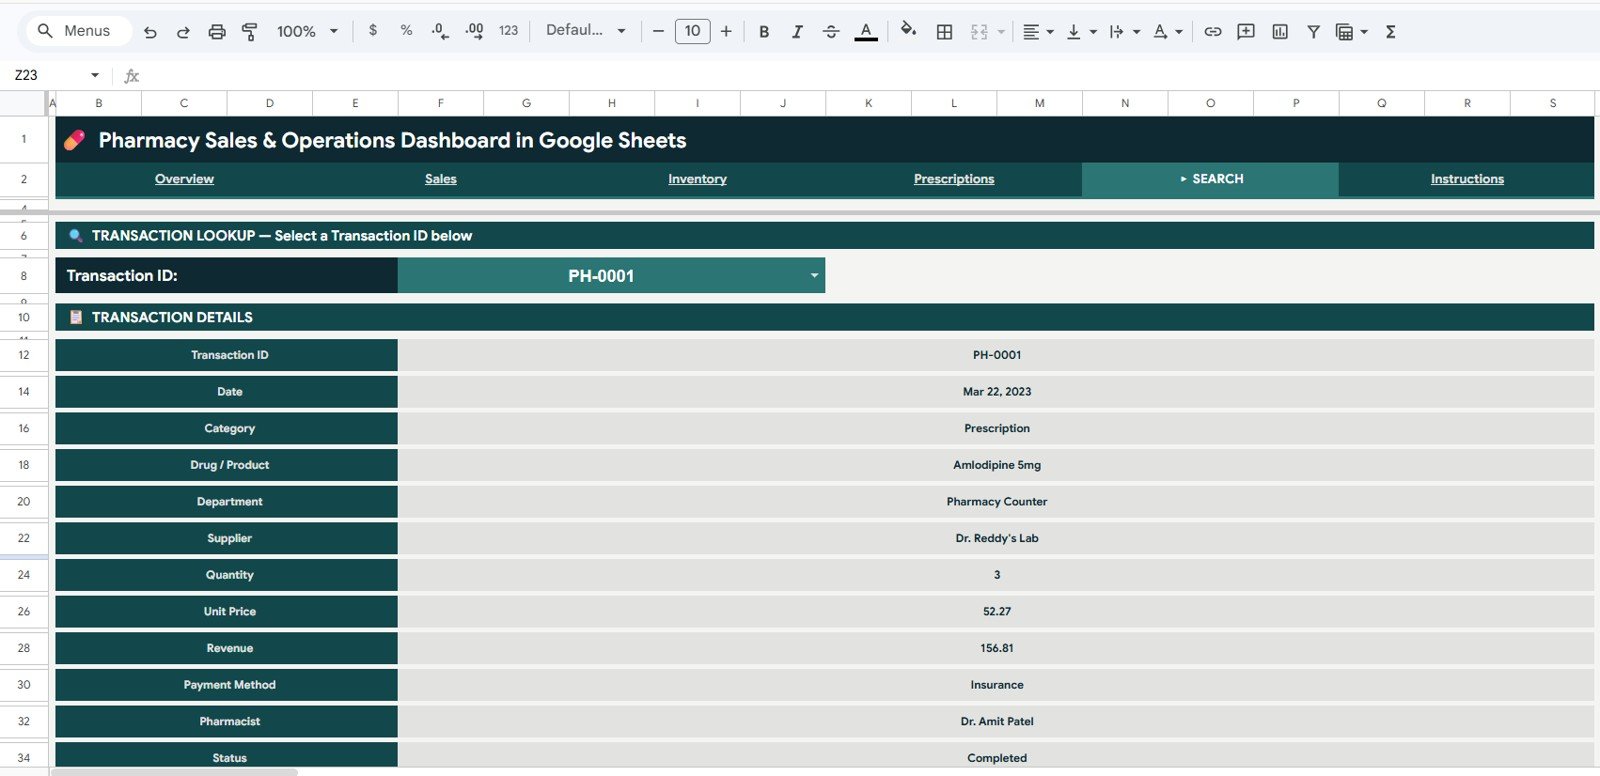
Search Sheet
The Search Sheet is the operational lookup tool. Pick any Transaction ID from the dropdown and the sheet instantly displays the full record: Date, Category, Drug or Product, Department, Supplier, Quantity, Unit Price, Revenue, Payment Method, Pharmacist, and Status. It’s the page you keep open during insurance audits or customer-history calls.
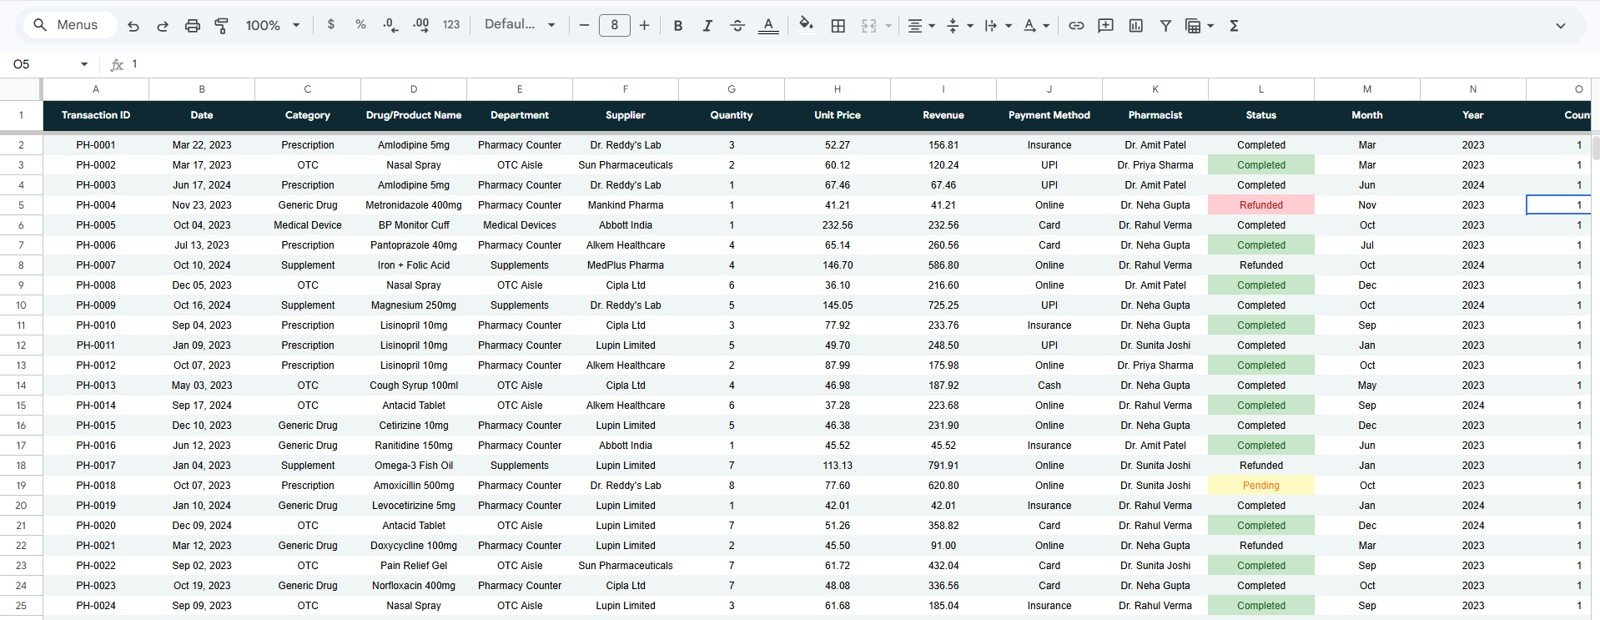
Data Sheet tab
Data Sheet
This is the input layer. Add your daily transactions in the same column structure (Date, Category, Drug, Department, Supplier, Quantity, Unit Price, Revenue, Payment Method, Pharmacist, Status) and the entire dashboard updates automatically. The included sample data shows the exact format expected — just replace it with your own transactions.
Pharmacy Sales & Operations Dashboard vs. Microsoft Excel vs. Paid Pharmacy SaaS — Feature Comparison
| Feature | Pharmacy Dashboard (Google Sheets) | Microsoft Excel Pharmacy Dashboard | PrimeRx / BestRx / Liberty Software |
|---|---|---|---|
| Cost | $9.99 one-time ✅ | $17.99 one-time | $199–$899 / month per location |
| Platform | Cloud-native Google Sheets ✅ | Desktop Excel only | Web + dedicated workstation |
| Setup time | Under 10 minutes ✅ | 15-20 minutes | 4-12 weeks implementation |
| Real-time multi-user collaboration | Yes — up to 100 users ✅ | Limited (OneDrive co-edit) | Yes (license per seat) |
| Mobile access | Native iOS & Android ✅ | Excel mobile app | Vendor mobile app |
| Customizable KPIs & charts | Fully editable ✅ | Fully editable | Vendor-controlled, change requests cost extra |
| Year-1 cost at 5 users | $9.99 ✅ | $17.99 | $11,940–$53,940 |
| Vendor lock-in | None — your data, your Sheet ✅ | None | Heavy (proprietary database) |
For independent pharmacies and small chains that want sales, inventory, and prescription analytics without paying $200+ per location every month, the Pharmacy Sales & Operations Dashboard in Google Sheets sits in the sweet spot.
Who Should Use This Template
👉 Click here to Purchase the Pharmacy Sales & Operations Dashboard in Google Sheets
Perfect for:
- Independent pharmacy owners running 1-5 locations who want analytics without subscription costs.
- Pharmacy managers tracking monthly sales, prescription volume, and supplier performance.
- Pharmacy operations consultants who need a portable client deliverable they can hand off in Google Drive.
- Pharmacy administration courses needing a realistic case dataset for capstone projects.
- Retail operators with an in-store pharmacy department wanting unified analytics across both sides of the floor.
Not a fit if:
- You run a hospital inpatient pharmacy and need HL7 EMR integration with clinical decision support.
- You need HIPAA-audited multi-tenant SaaS with SOC 2 Type II — this is a Google Sheet, not a vendor-managed platform.
- You need live integration with NDC databases or PBM claims feeds (this is an analytics layer, not a dispensing system).
Real-World Use Cases
Maria runs an independent pharmacy in Austin, Texas, with two part-time pharmacists. Every Monday morning she opens the Pharmacy Sales & Operations Dashboard, reviews the prior week’s revenue by category, identifies which drugs are running low, and checks the Rx-vs-generic mix to keep her gross margin above 22%. Before this dashboard, she paid $399/month for PrimeRx Analytics and rarely opened it because logging in took longer than reading the report. Now she keeps a browser tab pinned all day.
David is the operations director for a 4-store regional pharmacy chain in Florida. He duplicates this Sheet for each location, asks his store managers to paste their daily POS exports into the Data Sheet, and reviews the combined Revenue 2023 vs 2024 chart at his monthly leadership meeting. The chart format is the same across stores, which lets him benchmark prescription throughput per pharmacist apples-to-apples — something his old PMS reports made painful because every store ran a different version.
Aisha is a final-year pharmacy student writing her capstone on retail pharmacy economics. She uses this dashboard with the included sample dataset to demonstrate how supplier consolidation could improve gross margin. What would have been a 30-page Excel exercise is now a five-minute live walkthrough — slicer click, slicer click, point at the chart, finished.
Advantages of Pharmacy Sales & Operations Dashboard
👉 Click here to Purchase the Pharmacy Sales & Operations Dashboard in Google Sheets
The biggest advantage is cost: $9.99 once versus $11,940–$53,940 in year-one license fees for paid pharmacy SaaS at 5 seats. The second is setup speed: 10 minutes versus a 4-12 week implementation. The third is portability: your data lives in your own Google Drive, so when you switch dispensing systems or sell the pharmacy, your historical analytics travel with you. There is no vendor lock-in.
For collaborative teams, Google Sheets’ native real-time editing means your store manager can drop yesterday’s POS export into the Data Sheet at 7am while you’re already looking at the Overview tab from home — no refresh, no syncing. Combine it with the Inventory Tracker in Google Sheets if you also need stock-level alerts.
Opportunities for Improvement
Honest limitations — knowing them up front saves you a refund request:
- Manual data entry. You paste exports from your dispensing system; the dashboard does not pull NDC or PBM data live. If you need real-time syncing, this isn’t the right tool.
- No HIPAA Business Associate Agreement. Use Google Workspace if you need Workspace HIPAA compliance via a BAA; on personal Gmail, treat this as analytics only and keep PHI/PII out of the Drug column.
- Single-currency pricing. The KPI cards default to USD. Multi-currency reporting needs a custom column.
- 500 transactions of sample data. Real pharmacies running 30k+ transactions/year may notice slight chart-render lag. Splitting historical data into a separate archive Sheet helps.
Best Practices
👉 Click here to Purchase the Pharmacy Sales & Operations Dashboard in Google Sheets
- Standardize your Data Sheet column order. If you change column positions, update the slicer ranges and named ranges to match.
- Use Google Drive’s File > Version history before any major edit. It’s free and unlimited within your account.
- Set view-only access for store staff and edit access only for managers. Use Drive’s link-sharing settings to control this per user.
- Refresh the date filters at month-end so the Monthly Revenue Trend chart reflects the new period.
- Pair this dashboard with the Product Expiration Date Calendar in Google Sheets to track drug expiry alongside sales velocity — no more write-offs from missed expiry dates.
Explore Relevant Templates
- Pharmacy Dashboard in Excel — same metrics in native Excel format with PivotTables and slicers.
- Pharmacy Dashboard in Power BI — model-driven version with Row-Level Security, ideal for chains with 5+ locations.
- Warehouse Efficiency Dashboard in Google Sheets — companion analytics if you operate a fulfillment side or central warehouse.
- Supply Chain Procurement Dashboard in Google Sheets — broader view across procurement KPIs and supplier performance.
- Small Business KPI Scorecard in Google Sheets — owner-level scorecard view for the whole pharmacy.
- Browse all Google Sheets Dashboards on NextGenTemplates.
Frequently Asked Questions
What KPIs does the Pharmacy Sales & Operations Dashboard track?
The Pharmacy Sales & Operations Dashboard tracks 4 headline KPIs — Total Revenue, Transactions, Average Order Value, and Units Dispensed — plus 16 pre-built charts covering revenue by category, supplier, payment method, department, pharmacist, and Rx-vs-generic mix. All metrics update automatically when you replace the sample data with your own.
How long does it take to set up this Google Sheets pharmacy dashboard?
Setup takes under 10 minutes. You make a copy of the Sheet from the Google Drive link in your download, paste your transaction data into the Data Sheet keeping the column order intact, and the dashboard populates automatically. There are no formulas to write and no add-ons to install.
How does this compare to PrimeRx, BestRx, or Liberty Software?
This is an analytics and reporting layer, not a dispensing system — you keep using your dispensing software for prescription processing. The dashboard imports your transaction exports for reporting at $9.99 once instead of $200–$899 per month per location, with no implementation timeline and no per-user fees.
Can multiple pharmacists use the dashboard at the same time?
Yes — Google Sheets supports up to 100 simultaneous editors on a single file. You can share the Pharmacy Sales & Operations Dashboard with your pharmacists, technicians, and store managers via a Google Drive link with view-only or edit access controlled per user.
Do I need Microsoft Excel to use this template?
No. The Pharmacy Sales & Operations Dashboard is built natively for Google Sheets and runs entirely in your browser. You only need a free Google account. If you prefer Excel, the Pharmacy Dashboard in Excel is available separately on NextGenTemplates.
Is my pharmacy data secure in Google Sheets?
Your data lives in your own Google Drive under your Google account — NextGenTemplates never sees it. For HIPAA-regulated PHI, use Google Workspace and sign Google’s Business Associate Agreement. For personal Gmail accounts, treat this as an analytics layer and keep identifiable patient data out of the Drug column.
Can I customize the categories, departments, and payment methods?
Yes. Every dropdown, category, supplier, payment method, department, and pharmacist name is fully editable in the Data Sheet. The dashboard charts and slicers will automatically reflect any new categories you add — no formulas to rewrite.
About the Author
Built by PK — Microsoft Certified Professional with 15+ years of Excel, Google Sheets, and Power BI experience. Founder of NextGenTemplates, reaching 300K+ subscribers across YouTube channels. Every template is hand-built and tested before release.
Conclusion
The Pharmacy Sales & Operations Dashboard in Google Sheets turns 11 columns of transaction data into a 4-tab analytics workspace that any pharmacy owner can run from a browser. Four KPIs, sixteen charts, multi-level slicers, transaction-level lookup — everything you need to spot the trends in your sales, inventory, and prescription operations without paying $200+ per month for SaaS that takes weeks to implement.
👉 Click here to Purchase the Pharmacy Sales & Operations Dashboard in Google Sheets
✅ Instant download · One-time payment · No subscription · Lifetime access
For more Google Sheets tutorials and templates, visit YouTube.com/@NeoTechNavigators.