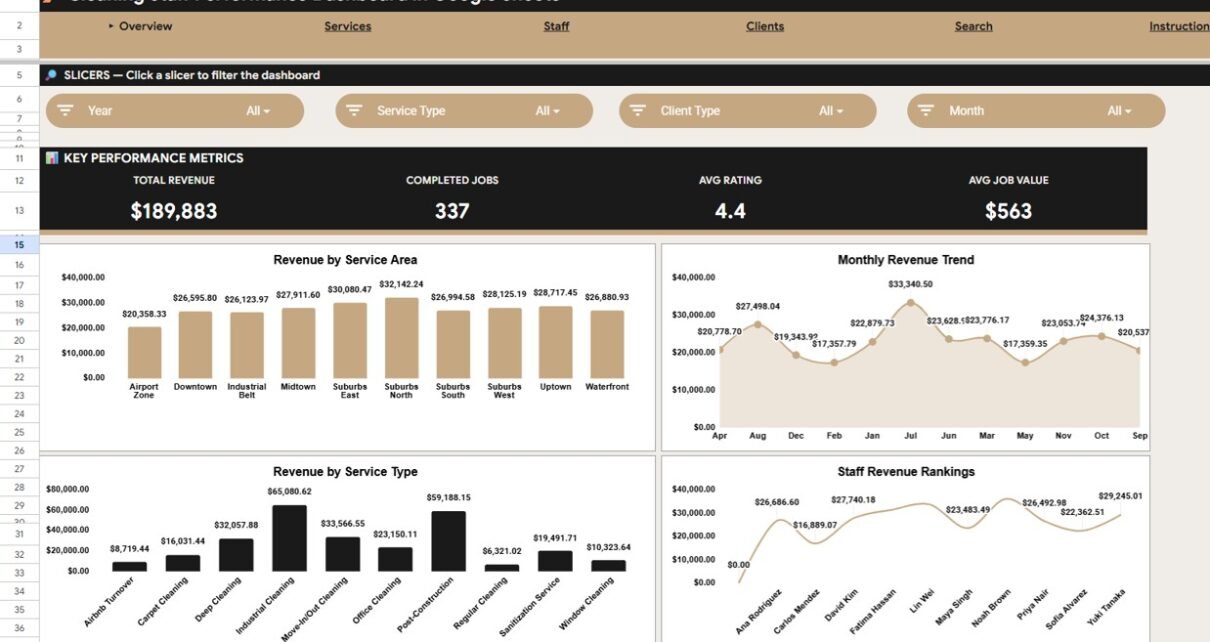
The Cleaning Staff Performance Dashboard in Google Sheets condenses a cleaning company’s entire job log into 4 headline KPIs and 14 charts spread across 6 tabs. Setup takes under 10 minutes, and at a one-time price of $9.99 it replaces cleaning analytics features that paid platforms charge $29-149 per month for.
Most small and mid-size cleaning businesses already record jobs in a spreadsheet, but that raw data rarely answers the questions owners actually care about: which cleaner earns the most, which client type is most profitable, and which service area is growing. This Cleaning Service Dashboard in Google Sheets turns those rows into clear answers automatically.
Key Features of the Cleaning Staff Performance Dashboard
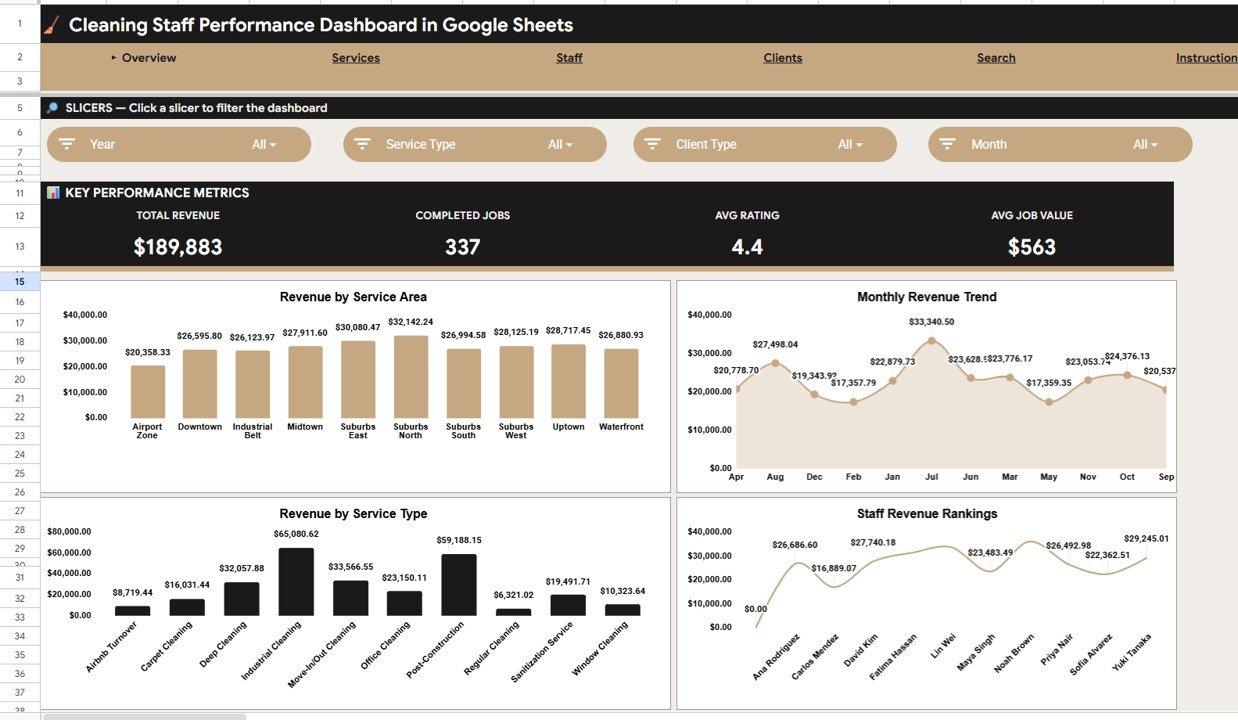
The dashboard tracks four live KPIs on the Overview tab — Total Revenue, Completed Jobs, Average Rating, and Average Job Value — each recalculating the moment you add a job. Around them sit 14 pre-built charts that analyze revenue and job volume by area, month, service type, staff, and client.
Every Overview chart is connected to slicers, so one click filters the whole page by service area, service type, or cleaner. A dedicated Search tab lets you enter any Job ID and instantly see that job’s full record. Because the file lives in Google Sheets, your team can open and edit it together from any device with a single shared link.
- 4 KPI cards summarizing revenue, jobs, quality, and average value
- 14 charts across Overview, Services, Staff, and Clients tabs
- Slicer filtering for instant, click-based analysis
- Job ID search that returns 11 fields for any job
Dashboard Pages Explanation
Click here to Purchase the Cleaning Staff Performance Dashboard in Google Sheets.
The template is organized into six clearly labeled tabs so anyone on the team can find the right view quickly.
Overview Page
The Overview shows Total Revenue, Completed Jobs, Average Rating, and Average Job Value as KPI cards, with charts for Revenue by Service Area, Revenue by Month, Revenue by Service Type, and Revenue by Staff. Slicers at the top filter everything in one click.
Services Analysis
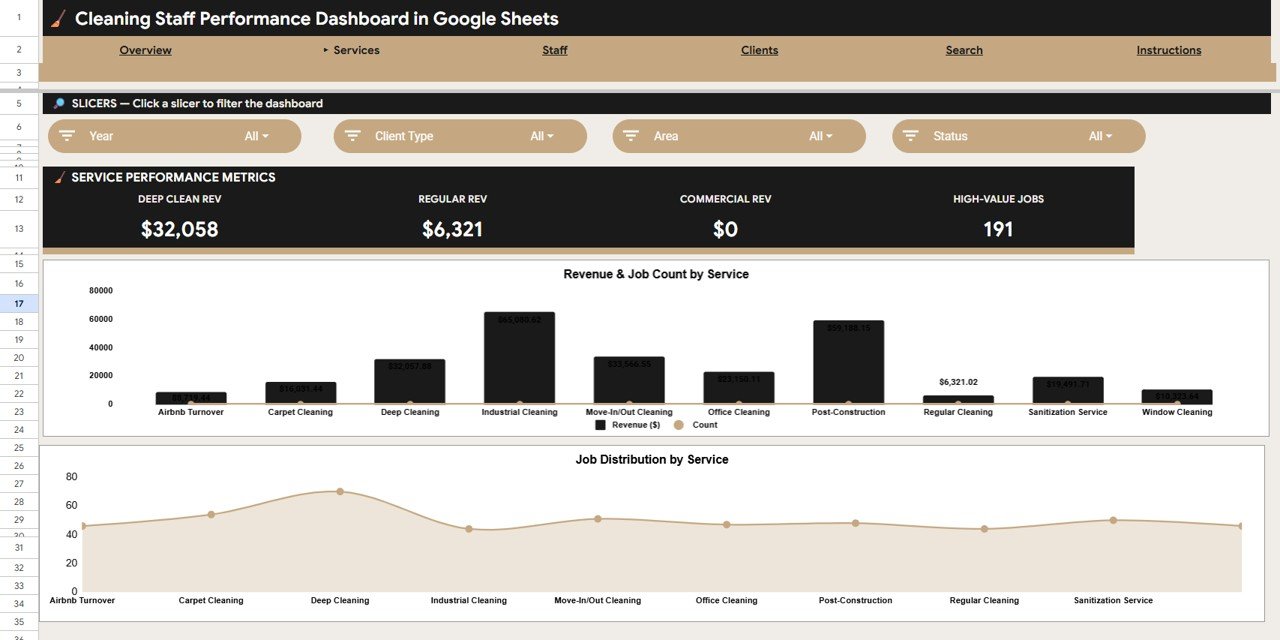
This tab analyzes your service lines with Revenue and Job Count by Service and Job Count by Service, making it easy to see which cleaning services generate the most income and the most work.
Staff Analysis
Click here to Purchase the Cleaning Staff Performance Dashboard in Google Sheets.
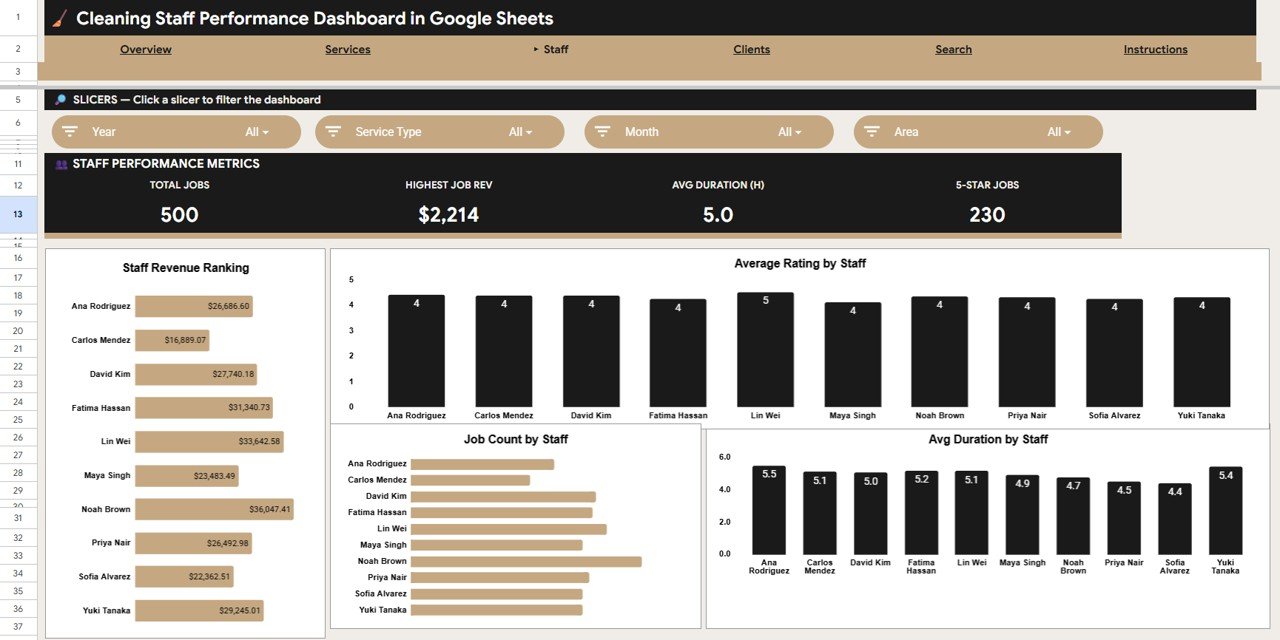
The Staff tab compares cleaners with Revenue by Staff, Average Rating by Staff, Job Count by Staff, and Average Duration by Staff — the quickest way to reward top performers and identify who needs coaching.
Clients Analysis
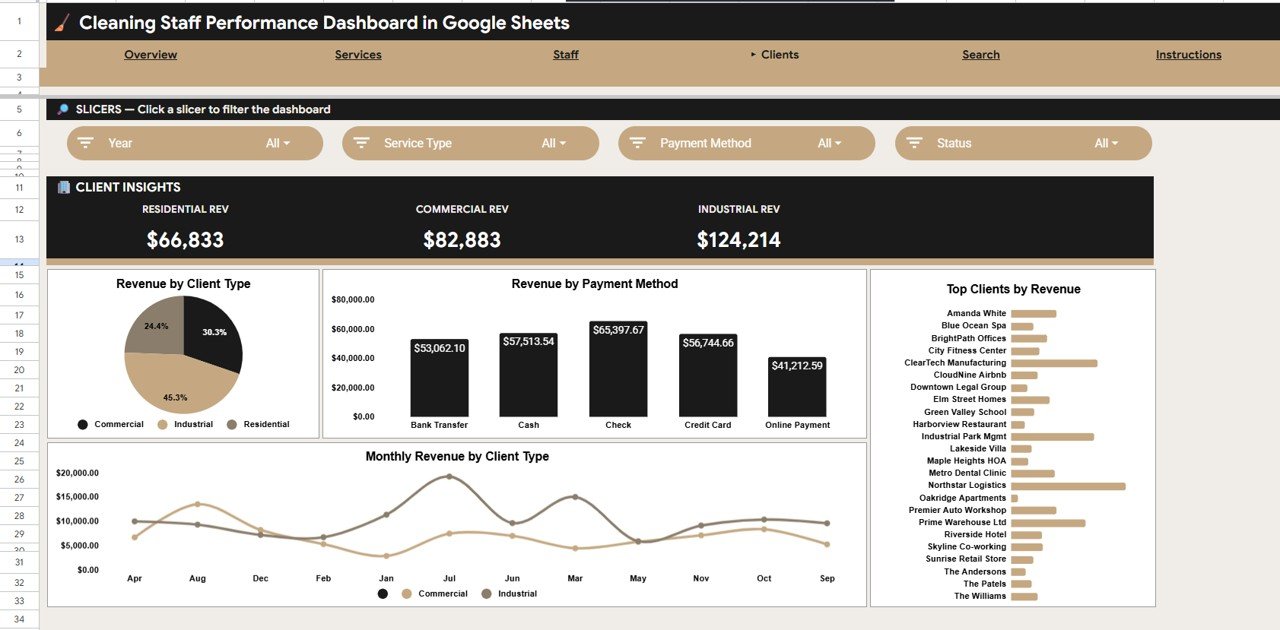
This tab shows Revenue by Client Type, Revenue by Payment Method, Revenue by Client, and Monthly Revenue by Client Type, helping you pinpoint your most valuable accounts and understand payment behavior.
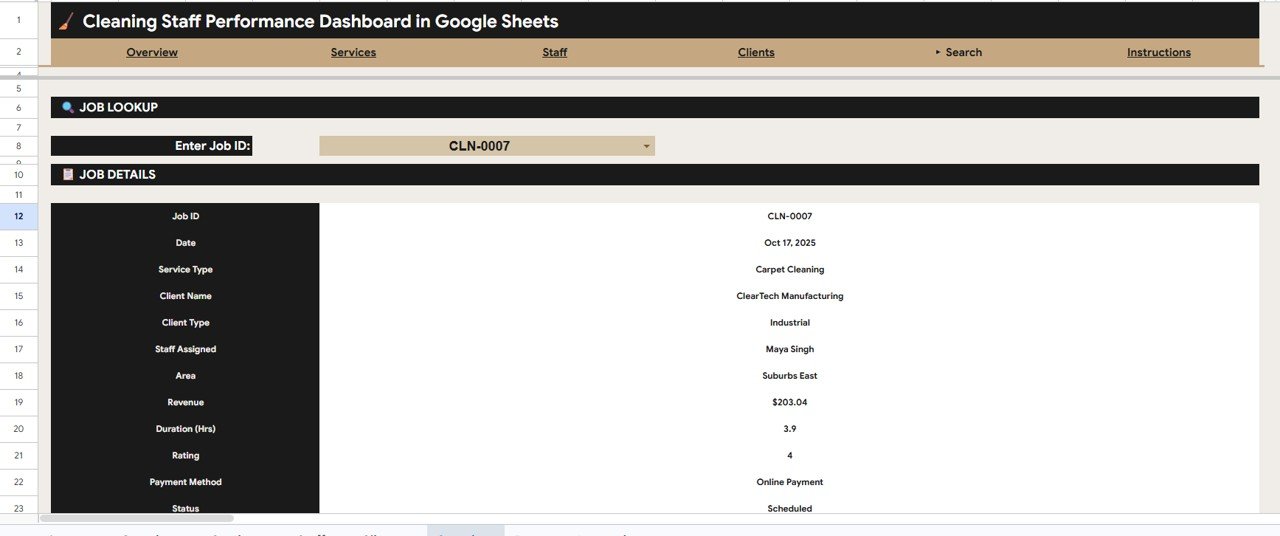
Search Sheet
Click here to Purchase the Cleaning Staff Performance Dashboard in Google Sheets.
Type a Job ID and the Search tab returns the Date, Service Type, Client Name, Client Type, Staff Assigned, Area, Revenue, Duration, Rating, Payment Method, and Status for that job — ideal for answering a client query on the spot.
Data Sheet
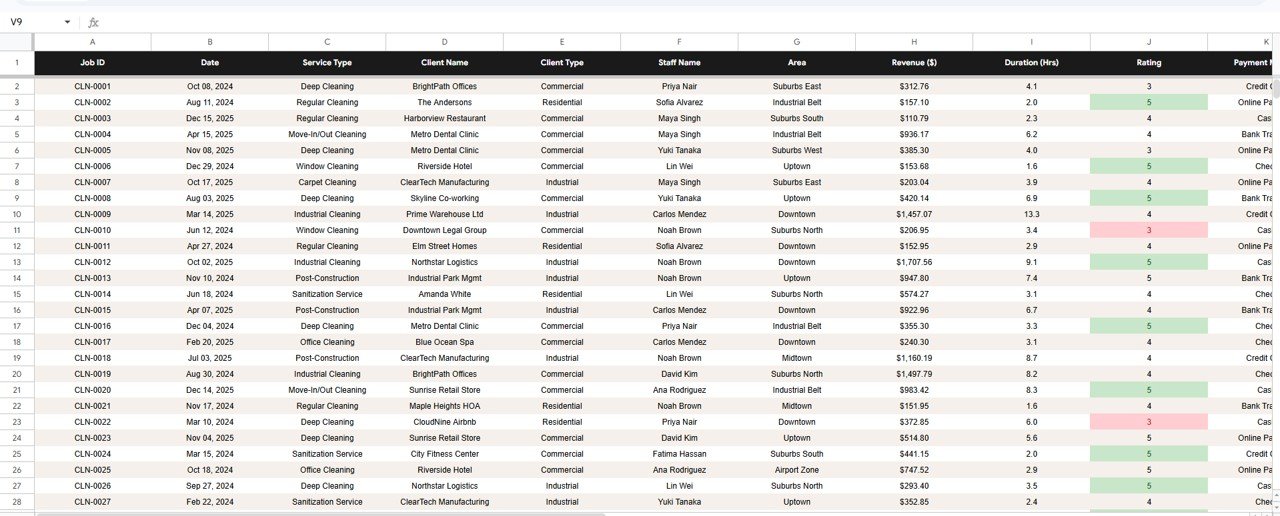
The Data sheet is your single source of truth. Add each job as a row in the same column format and every KPI, chart, slicer, and the Search tab update automatically.
Cleaning Staff Performance Dashboard vs. Microsoft Excel vs. Paid Cleaning SaaS — Feature Comparison
Click here to Purchase the Cleaning Staff Performance Dashboard in Google Sheets.
| Feature | Cleaning Staff Performance Dashboard (Google Sheets) | Microsoft Excel Dashboard | Jobber / Housecall Pro / ZenMaid |
|---|---|---|---|
| Cost | $9.99 one-time | $10-20 one-time | $29-149 / month |
| Platform | Google Sheets (cloud) | Desktop Excel file | Vendor cloud app |
| Setup time | Under 10 minutes | Under 10 minutes | Hours of onboarding |
| Real-time team collaboration | ✅ Built in | Limited | ✅ Yes |
| Mobile access | ✅ Any browser | Needs Excel mobile | ✅ Native apps |
| Customizable fields | ✅ Fully editable | ✅ Fully editable | Limited to vendor schema |
| Share with a link | ✅ One link | Email file copies | ✅ Yes |
| Staff performance + rating analysis | ✅ 4 staff charts | ✅ Yes | Add-on / higher tier |
| Year-1 cost at 5 users | $9.99 total | $10-20 total | $1,740-8,940 / year |
For cleaning companies that want staff, client, and revenue analytics without paying $29-149 every month, the Cleaning Staff Performance Dashboard in Google Sheets sits in the sweet spot.
Who Should Use This Template
Perfect for:
- Residential and commercial cleaning company owners with 2-50 staff
- Cleaning managers who want staff productivity and rating analysis without a CRM subscription
- Maid services, janitorial firms, and office-cleaning businesses on Google Workspace
Not a fit if:
- You need live scheduling, GPS tracking, or automated invoicing built in
- You run an enterprise franchise needing role-based logins and audit trails across many branches
- Your team does not use Google Sheets or Excel at all
Real-World Use Cases
Click here to Purchase the Cleaning Staff Performance Dashboard in Google Sheets.
Maria runs a 12-cleaner residential service. Each Monday she checks Revenue by Staff and Average Rating by Staff, rewards her top cleaner, and schedules a coaching call with anyone whose rating dropped — with no monthly software bill.
David manages commercial contracts for an office-cleaning firm. He tracks Revenue by Client and Revenue by Payment Method, then uses Monthly Revenue by Client Type to decide which contracts to prioritize for renewal.
Priya owns a maid service across three areas. She uses the service-area slicer on the Overview to compare zones and plan where to hire next.
Advantages of the Cleaning Staff Performance Dashboard
The biggest advantage is cost: a one-time $9.99 purchase versus recurring SaaS fees that can exceed $1,700 a year for a small team. The second is speed — because it is pre-built, you go from raw job data to a working dashboard in under 10 minutes. The third is ownership: your data stays in your own Google Drive, fully editable, with no vendor lock-in. Learn more about working with spreadsheets in the official Google Sheets Help Center.
Opportunities for Improvement
Click here to Purchase the Cleaning Staff Performance Dashboard in Google Sheets.
This dashboard is built for analytics and reporting, not operations, so it does not include live scheduling, route optimization, or automatic invoice generation. Very large cleaning franchises that need user-level permissions and audit logs will outgrow a single shared sheet. Teams wanting historical trend forecasting may also want to pair it with a dedicated planning tool. For most independent cleaning businesses, though, these gaps are outweighed by its simplicity and zero ongoing cost.
Best Practices
- Keep one row per completed job and enter data consistently so charts stay accurate.
- Use a standard list of service types and area names to avoid duplicate categories.
- Review the Staff tab weekly and the Clients tab monthly for the clearest trends.
- Duplicate the sheet at year-end to keep a clean archive for each period.
Explore Relevant Templates
If you manage other field-service work, these Google Sheets dashboards pair well with this one:
- Plumbing Contractor Dashboard in Google Sheets
- Home Inspection Dashboard in Google Sheets
- SaaS Financial Performance Dashboard in Google Sheets
- Nonprofit Grant Dashboard in Google Sheets
- Solar Energy Dashboard in Google Sheets
Frequently Asked Questions
Click here to Purchase the Cleaning Staff Performance Dashboard in Google Sheets.
What KPIs does the Cleaning Staff Performance Dashboard in Google Sheets track?
The Cleaning Staff Performance Dashboard in Google Sheets tracks Total Revenue, Completed Jobs, Average Rating, and Average Job Value, plus 14 charts across service areas, months, service types, staff, and clients. Every metric updates automatically when you add jobs to the Data sheet.
How long does setup take?
Setup takes under 10 minutes. Copy the Cleaning Staff Performance Dashboard into your Google Drive, paste your jobs into the Data sheet using the same columns, and the KPI cards and charts refresh on their own.
How does this compare to paid cleaning software like Jobber or Housecall Pro?
Paid cleaning SaaS costs $29-149 per month and adds scheduling and invoicing. The Cleaning Staff Performance Dashboard is a one-time $9.99 analytics tool focused on revenue, staff, and client reporting — best for owners who want insight without a subscription.
Can my whole cleaning team use it at once?
Yes. Because the Cleaning Staff Performance Dashboard runs in Google Sheets, you can share it with one link and let managers and staff view or edit it together in real time on any device.
Can I customize the services, areas, and staff names?
Yes. Every field in the Data sheet is editable, so you can rename services, areas, client types, and staff to match your business, and the charts relabel themselves automatically.Cleaning Staff Performance Dashboard in Google Sheets
About the Author
Built by PK — Microsoft Certified Professional with 15+ years of Excel, Google Sheets, and Power BI experience. Founder of NextGenTemplates, reaching 300K+ subscribers across YouTube channels. Every template is hand-built and tested before release.
Conclusion
The Cleaning Staff Performance Dashboard in Google Sheets gives cleaning business owners professional revenue, staff, and client analytics for a one-time $9.99 — no subscriptions, no per-user fees. Click here to Purchase the Cleaning Staff Performance Dashboard in Google Sheets.
Instant download · One-time payment · No subscription
🎥 For step-by-step tutorials, visit YouTube.com/@NeoTechNavigators.
Last updated: June 2026