Drop shipping businesses generate data across multiple sales channels, suppliers, product categories, and countries simultaneously — yet most operators are still tracking performance in a basic spreadsheet with no charts, no filters, and no clear view of which channel or supplier is actually making them money. The Drop Shipping Dashboard in Google Sheets solves that. It tracks 4 core KPIs across 6 interactive tabs, with 10+ pre-built charts and multi-dimensional slicers that let you filter the entire dashboard by channel, category, or country in one click.
For drop shippers who want supplier-level profitability analysis, monthly revenue-vs-profit trending, and order-level search in a tool that costs $9.99 once rather than $49–$299/month, this Google Sheets dashboard template fills the gap that SaaS analytics tools leave wide open — especially for multi-platform sellers on Amazon, Shopify, eBay, and Etsy.
Key Features of the Drop Shipping Dashboard in Google Sheets
🛒 Click here to Purchase the Drop Shipping Dashboard in Google Sheets
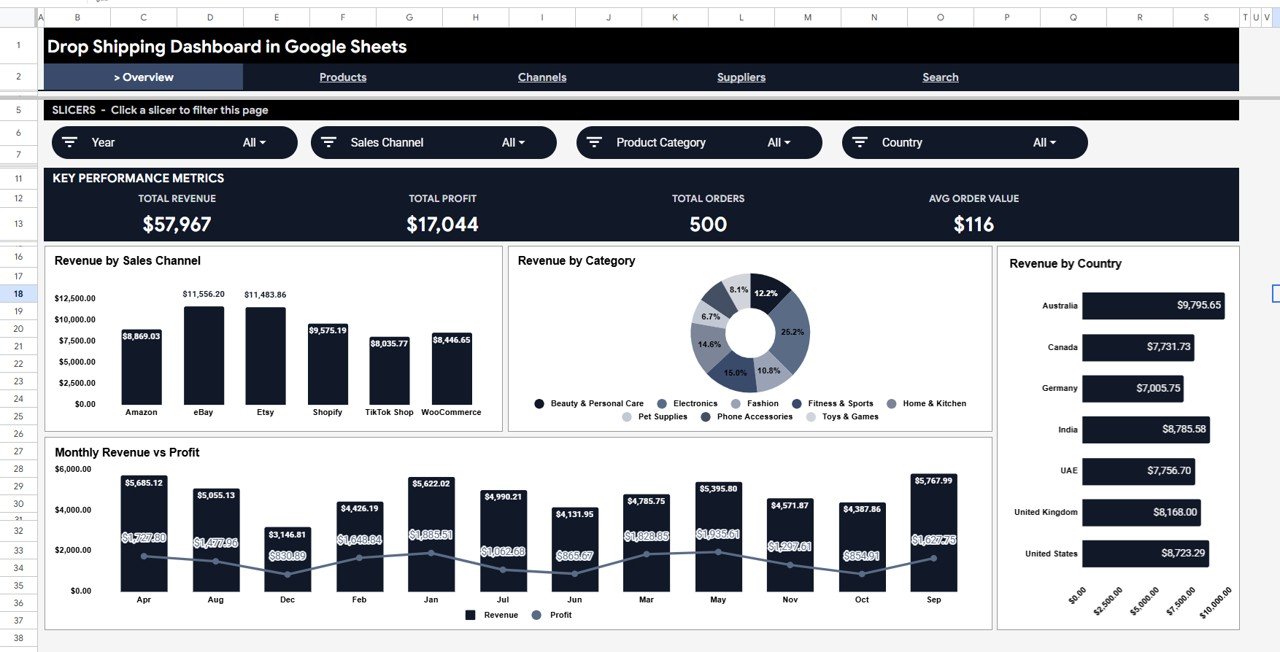
The Drop Shipping Dashboard in Google Sheets tracks Total Revenue, Total Profit, Total Orders, and Average Order Value as top-level KPI cards on the Overview page. Below the cards, 4 charts provide immediate multi-dimensional visibility: Revenue by Sales Channel shows which platform drives the most income; Revenue by Category reveals your best-performing product lines; Revenue by Country maps where your orders are coming from; and Monthly Revenue vs Profit tracks your margin trend over time.
Beyond the Overview, three dedicated analysis tabs drill into Products (Units by Category, Revenue & Profit by Category, Top Products by Revenue), Channels (Revenue by Channel, Profit by Channel, Monthly Revenue by Channel), and Suppliers (Revenue & Profit by Supplier, Units by Supplier, Supplier Revenue by Category). A Search sheet lets you type an Order ID and instantly view the complete order record. No add-ons, no macros, no third-party plugins are required.
- 4 KPI cards: Total Revenue, Total Profit, Total Orders, Avg Order Value
- 10+ charts covering channel, category, country, supplier, product, and trend analysis
- Interactive slicers on the Overview page for fast cross-dimensional filtering
- Order Search sheet: enter an Order ID to retrieve full order details instantly
- 6 purpose-built tabs: Overview, Products, Channels, Suppliers, Search, Data
- Works in any browser via Google Sheets — no software installation required
- One-time purchase, lifetime access, shareable via Google Drive link
Dashboard Pages Explanation
Page 1: Overview
The Overview page is the command center of the Drop Shipping Dashboard in Google Sheets. It displays 4 KPI cards (Total Revenue, Total Profit, Total Orders, Avg Order Value) and 4 charts: Revenue by Sales Channel, Revenue by Category, Revenue by Country, and Monthly Revenue vs Profit. Slicers at the top of the page let you filter all charts simultaneously by channel, category, and country — no formulas to update.
Page 2: Products
🛒 Click here to Purchase the Drop Shipping Dashboard in Google Sheets
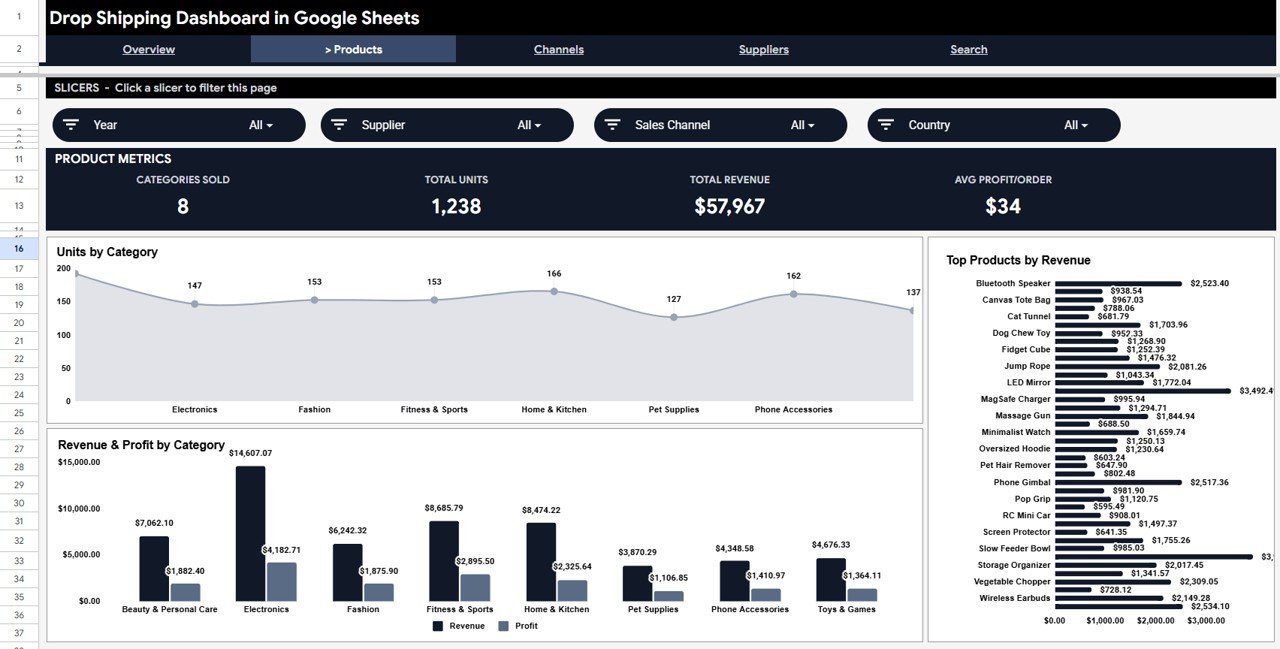
The Products tab provides three charts for product-level analysis: Units by Category shows volume distribution; Revenue & Profit by Category compares gross and net performance per product line; Top Products by Revenue ranks your best-selling SKUs. Use this tab to identify margin winners and volume leaders at a glance.
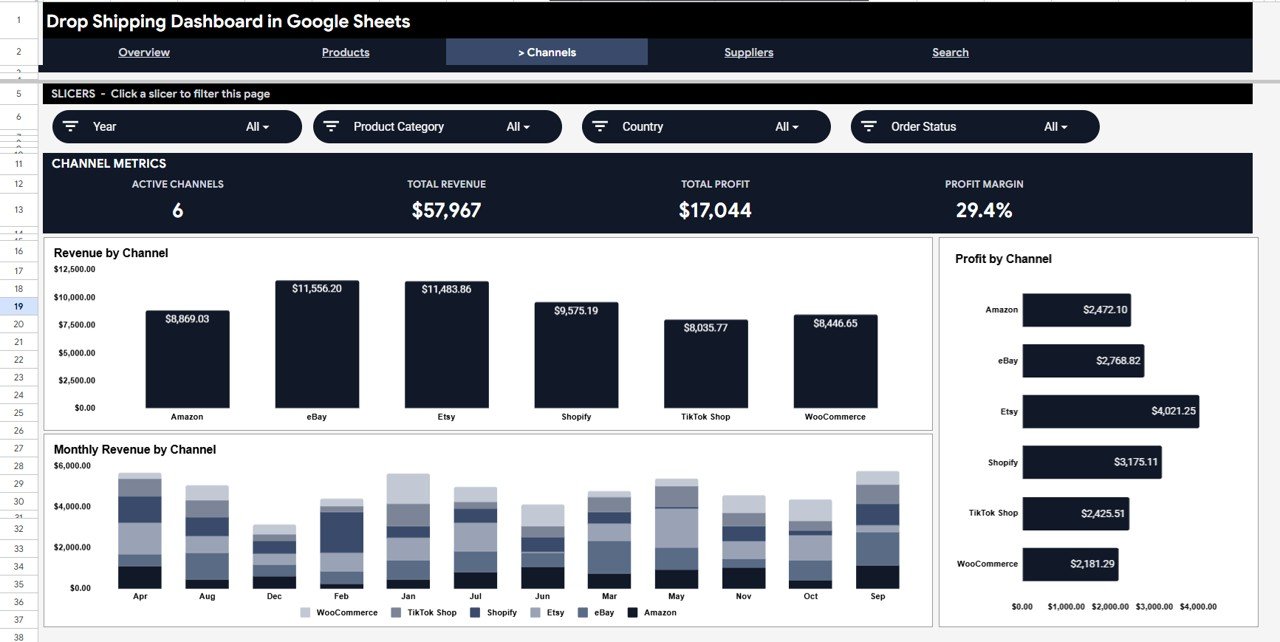
Page 3: Channels
The Channels tab breaks down your sales platform performance with three charts: Revenue by Channel, Profit by Channel, and Monthly Revenue by Channel. Whether you sell on Amazon, Shopify, eBay, Etsy, or a mix, this tab instantly shows which channel delivers the highest profit margin and how each platform trends month by month.
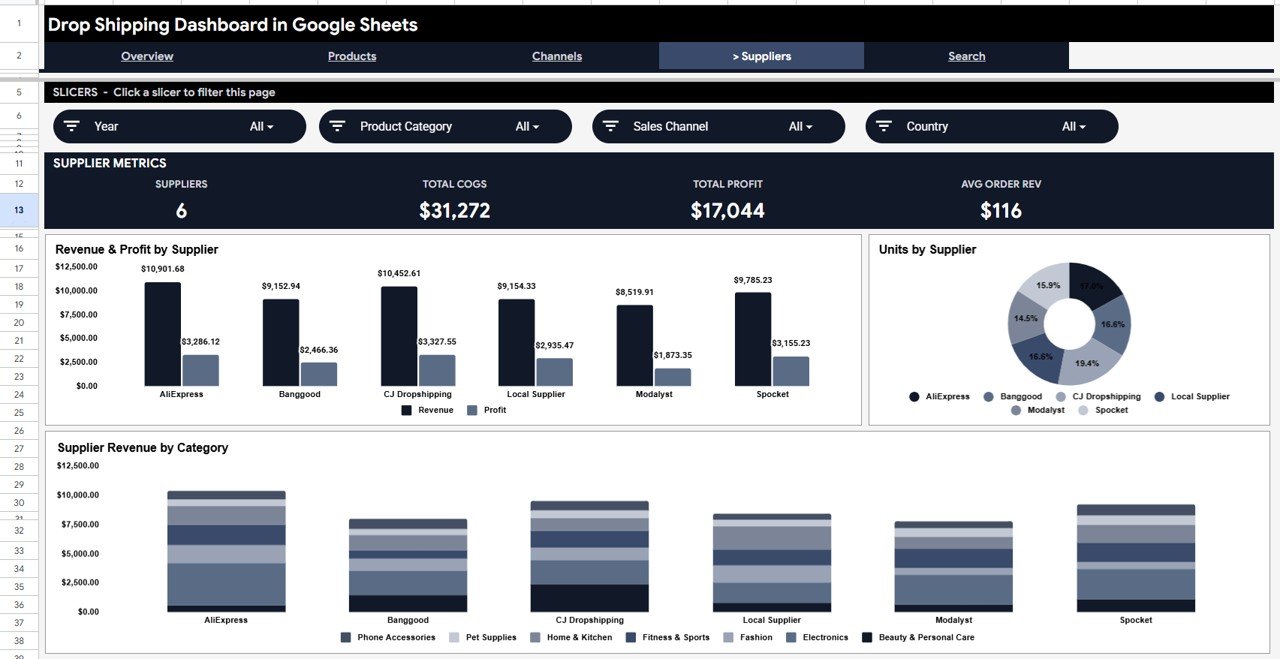
Page 4: Suppliers
🛒 Click here to Purchase the Drop Shipping Dashboard in Google Sheets
The Suppliers tab reveals which supplier relationships are most profitable with three dedicated charts: Revenue & Profit by Supplier ranks supplier financial performance; Units by Supplier shows volume contribution; Supplier Revenue by Category shows which product categories each supplier dominates. Essential for supplier renegotiation and portfolio decisions.
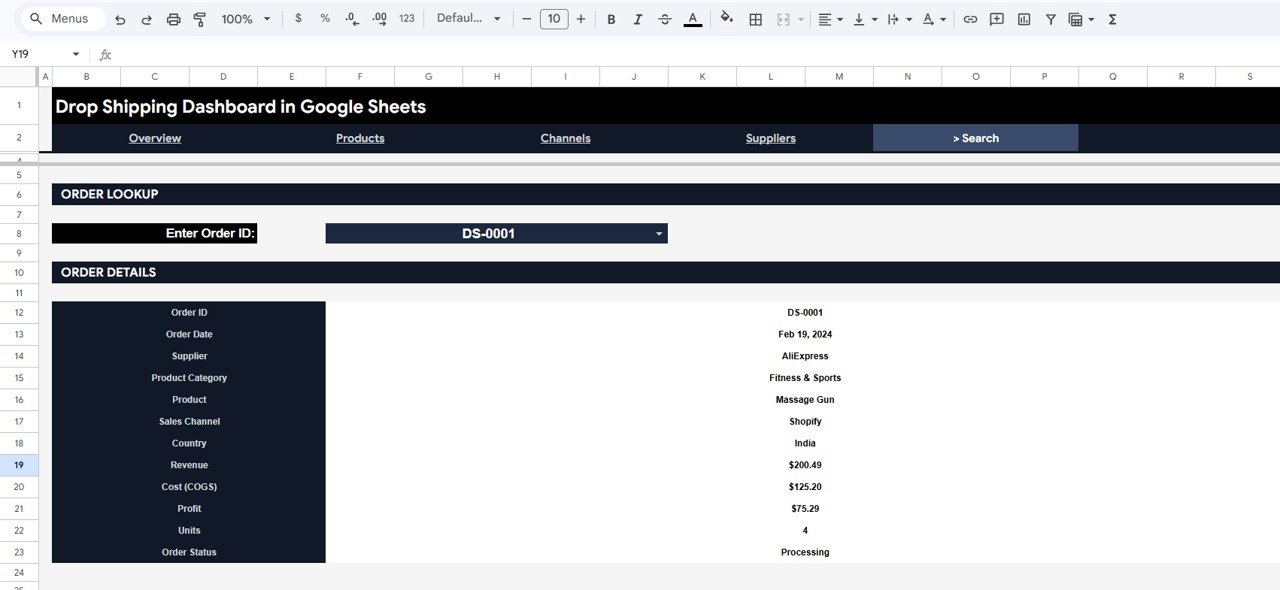
Page 5: Order Search
The Search sheet lets you enter an Order ID and instantly retrieve the full order record — Order Date, Supplier, Product Category, Product, Sales Channel, Country, Revenue, Cost, Profit, Units, and Order Status. Ideal for customer service queries, dispute resolution, or supplier reconciliation without scrolling through hundreds of data rows.
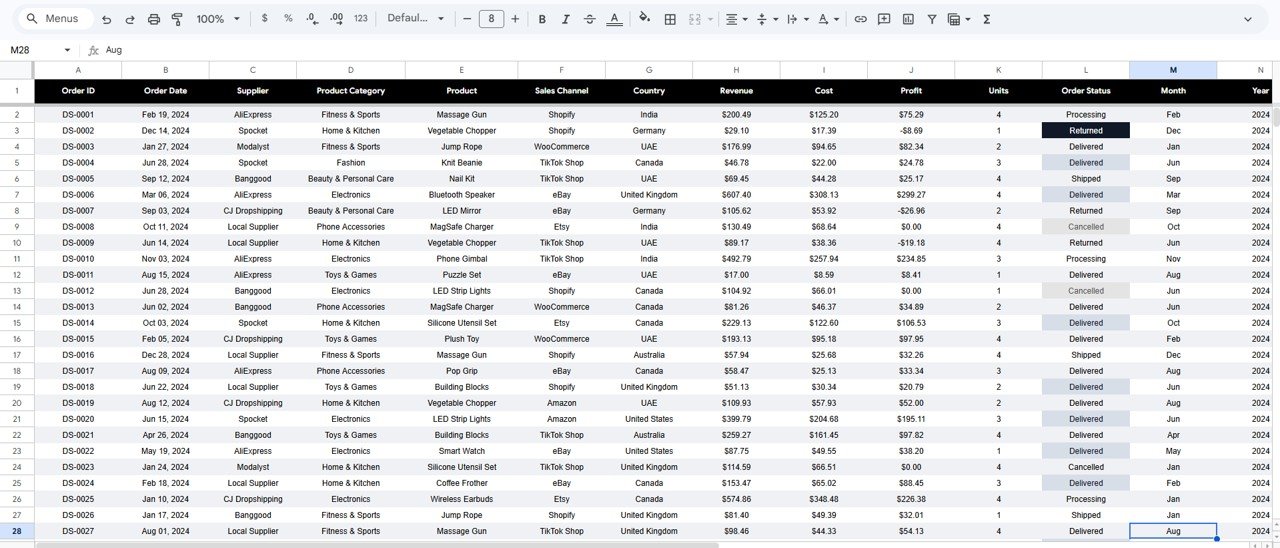
Data Sheet
🛒 Click here to Purchase the Drop Shipping Dashboard in Google Sheets
The Data sheet is where all order records are entered in a structured table. Add new rows following the same column layout and every dashboard tab updates automatically. The sheet supports unlimited rows and requires no pivot refresh or formula maintenance.
Drop Shipping Dashboard in Google Sheets vs. Excel Dashboard vs. Paid Analytics SaaS — Feature Comparison
| Feature | Drop Shipping Dashboard in Google Sheets | Excel Dashboard | Shopify / Triple Whale |
|---|---|---|---|
| Cost | $9.99 one-time | ~$20 one-time | $49–$299/month |
| Platform | Google Sheets (any browser) | Microsoft Excel (desktop) | SaaS web app |
| Setup time | Under 10 minutes | 10–15 minutes | Hours + API config |
| Real-time team sharing | ✅ Google Drive link | ❌ File-sharing only | ✅ Built-in |
| Mobile access | ✅ Google Sheets app | Limited | ✅ Native app |
| Customizable fields | ✅ Fully editable | ✅ Fully editable | ❌ Fixed schema |
| Supplier analysis | ✅ 3 dedicated supplier charts | Varies | ❌ Not included |
| Year-1 cost (5 users) | $9.99 total | ~$20 total | $588–$3,588 |
| Order-level search | ✅ Dedicated Search sheet | Varies | ✅ Order lookup included |
For drop shippers who want channel, supplier, and product analytics without paying $49/month for SaaS, the Drop Shipping Dashboard in Google Sheets sits in the sweet spot.
Who Should Use This Template
Perfect for:
- Drop shippers managing 2–50+ SKUs across Amazon, Shopify, eBay, or Etsy
- E-commerce entrepreneurs who need supplier profitability analysis without expensive BI tools
- Small business owners tracking multi-country order performance in Google Sheets
- Virtual assistants managing monthly dropshipping reporting for clients
- Teams that share dashboards across devices without installing any software
Not a fit if:
- You need real-time automated API data pulls from Shopify or WooCommerce (consider Looker Studio)
- You need inventory sync or warehouse management features
- Your team requires enterprise-grade access controls or audit trails
Real-World Use Cases
🛒 Click here to Purchase the Drop Shipping Dashboard in Google Sheets
Marcus runs a dropshipping store on Amazon and Shopify. He uses the Drop Shipping Dashboard in Google Sheets to compare monthly revenue and profit across both platforms, identify which product categories have the highest margins, and track his top 3 suppliers — all without paying $99/month for a SaaS analytics tool. The Channels tab alone saves him 2 hours per month in manual reporting.
Priya manages e-commerce operations for a small import business. She enters weekly order data into the Data sheet and uses the Channels tab to prepare a quarterly platform report for her director. The Google Sheets format means her director can view it from any browser without needing Excel installed.
A freelance e-commerce VA uses the template for 4 clients. She maintains one Google Sheets copy per client, uses the Suppliers tab to flag which suppliers have declining profit margins, and uses the Search sheet when clients ask about specific order records — all managed from a single Google Drive folder.
Advantages of the Drop Shipping Dashboard in Google Sheets
- Multi-dimensional slicers let you filter the Overview by channel, category, and country simultaneously — no formula editing required
- Supplier analysis with 3 dedicated charts gives drop shippers profitability intelligence that most SaaS tools don’t offer for free
- Google Sheets platform means instant browser-based access, real-time link sharing, and mobile compatibility without any software license
- Order Search sheet eliminates the need to manually search through data rows — type an ID, get the full record
- One-time purchase at $9.99 vs. $588–$3,588/year for comparable SaaS analytics platforms
- 6-tab structure separates Overview, Products, Channels, Suppliers, Search, and Data cleanly — every team member knows where to look
Opportunities for Improvement
🛒 Click here to Purchase the Drop Shipping Dashboard in Google Sheets
- Data entry is manual — there is no automatic sync from Shopify, Amazon Seller Central, or other platforms. A Zapier or Google Apps Script integration could be added by technical users
- The template is optimized for order-level data. If your business tracks returns separately, a returns sheet would need to be added manually
- The slicer-based filtering works best in Google Sheets on desktop; the mobile experience for slicers is functional but less fluid than desktop
Best Practices
- Use consistent naming for channels (e.g., always “Amazon” not “AMZ” or “amazon.com”) so the Channels tab charts group correctly
- Enter supplier names consistently to ensure the Suppliers tab aggregates correctly across all orders
- Add new orders at the bottom of the Data sheet — the dashboard will pick them up automatically without any pivot refresh
- Use the Search sheet regularly for order-level spot checks rather than scrolling through the Data sheet
- Make a backup copy of your Google Sheets file monthly in case of accidental overwrites
Explore Relevant Templates
If you use Power BI, check out the Drop Shipping Dashboard in Power BI for richer visualization options. For marketplace-specific seller tracking, the Seller Analytics Dashboard in Google Sheets is a strong companion. The SaaS Product Usage Dashboard in Google Sheets is useful for digital product sellers alongside physical drop shipping. Also see the Ecommerce Conversion Rate KPI Dashboard in Google Sheets and the SaaS Product Usage Dashboard post for related coverage. Browse all Google Sheets Dashboard Templates.
Frequently Asked Questions
🛒 Click here to Purchase the Drop Shipping Dashboard in Google Sheets
What KPIs does the Drop Shipping Dashboard in Google Sheets track?
The Drop Shipping Dashboard in Google Sheets tracks 4 core KPIs: Total Revenue, Total Profit, Total Orders, and Average Order Value. It includes 10+ charts covering revenue and profit by sales channel, product category, country, and supplier, plus a Monthly Revenue vs Profit trend chart across all 6 tabs.
Do I need Google Sheets experience to use this template?
No advanced experience is required. The Drop Shipping Dashboard in Google Sheets is pre-built — paste your order data into the Data sheet in the same column format and every chart and KPI card updates automatically. Slicers work with a single click and require no formula knowledge.
How does this compare to Shopify Analytics or Triple Whale?
Shopify Analytics and Triple Whale charge $49–$299/month and require platform API integrations. The Drop Shipping Dashboard in Google Sheets costs $9.99 as a one-time purchase, works with data from any platform (Amazon, eBay, Etsy, Shopify, WooCommerce), and is fully customizable with no lock-in or recurring fees.
Can I track multiple sales channels and suppliers in the same file?
Yes. The template includes a dedicated Channels tab with Revenue by Channel, Profit by Channel, and Monthly Revenue by Channel charts, plus a dedicated Suppliers tab with Revenue & Profit by Supplier, Units by Supplier, and Supplier Revenue by Category — all fed automatically from the Data sheet.
How long does setup take?
Under 10 minutes. After purchase, open the PDF guide to get the Google Sheets copy link, make your own copy in Google Drive, paste your order data in the same column format as the sample data, and the dashboard populates instantly. No pivot refresh, no macro enabling required.
Does the Drop Shipping Dashboard work on mobile?
Yes. Since it runs in Google Sheets, the dashboard is accessible on any iOS or Android device via the Google Sheets mobile app. Slicers are functional on mobile, though the desktop experience is more fluid for filtering.
Can I customize the categories, channels, or supplier names?
Yes. All values in the Data sheet are fully editable. Rename channels, add new product categories, or expand the supplier list and the dashboard charts update automatically to reflect your data structure.
About the Author
Built by PK — Microsoft Certified Professional with 15+ years of Excel, Google Sheets, and Power BI experience. Founder of NextGenTemplates, reaching 300K+ subscribers across YouTube channels. Every template is hand-built and tested before release. Follow the @NeoTechNavigators YouTube channel for Google Sheets tutorials and dashboard walkthroughs.
Conclusion
The Drop Shipping Dashboard in Google Sheets gives multi-channel drop shippers a clear, filterable view of revenue, profit, channels, suppliers, and individual orders — all in a single Google Sheets file that costs $9.99 once and requires no SaaS subscription. From Overview KPI cards to supplier-level profitability charts to order-level search, every tab is built around the real decisions drop shippers make every week.
🛒 Click here to Purchase the Drop Shipping Dashboard in Google Sheets
✅ Instant download · One-time payment · No subscription
📅 Last updated: June 2026