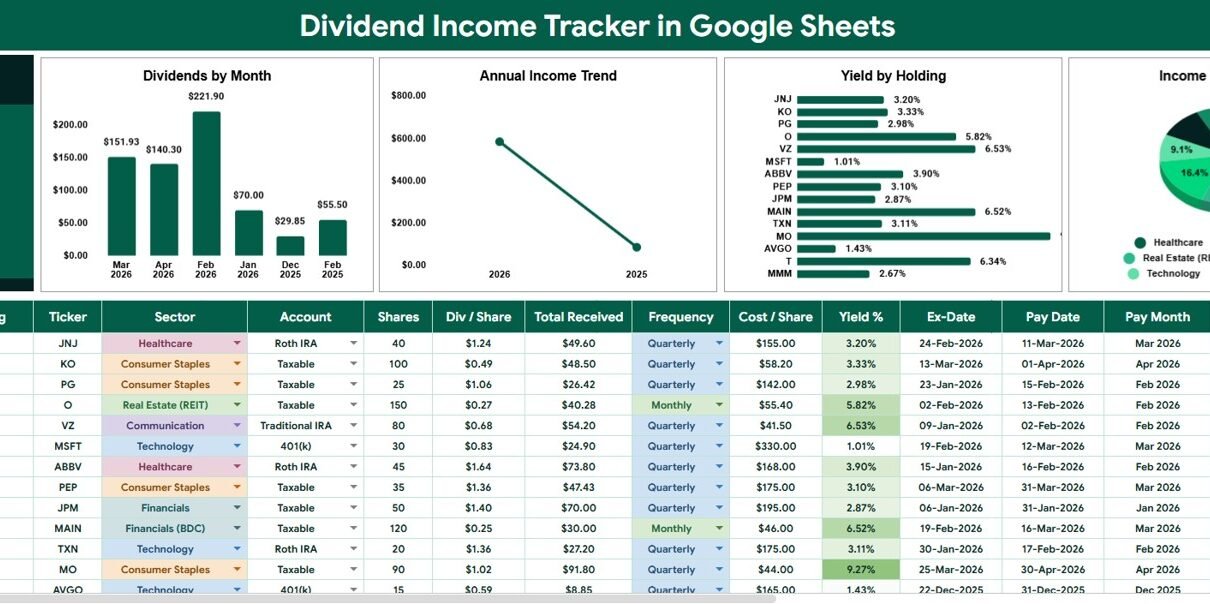
Dividend Income Tracker in Google Sheets is designed for investors who want a simple way to record dividend payments, monitor income trends, and review portfolio income without building a spreadsheet from scratch. A portfolio with 25 quarterly dividend holdings can create 100 payment checkpoints per year, and the workload grows when you add monthly payers, sector reviews, account splits, yield checks, and status notes. This Google Sheets tracker gives you a ready structure for that work: an Overview Page for charts and filters, plus a Dropdown List tab for cleaner setup and consistent data entry.Dividend Income Tracker in Google Sheets
Instead of relying on scattered notes, brokerage exports, and separate calculators, you can keep the main dividend story in one cloud-based spreadsheet. The template is especially useful for personal finance users, dividend growth investors, passive income planners, and advisors who want a light, editable reporting layer.
Key Features of Dividend Income Tracker in Google Sheets
The template focuses on the core questions dividend investors ask again and again: how much income did I receive, when did it arrive, which holdings produced it, and where is the income concentrated?
- Total dividend income view: The Overview Page includes a Total Dividends Received card for a fast headline number.
- Monthly trend analysis: The monthly chart shows whether income is consistent or concentrated in certain payment months.
- Annual comparison: The annual income chart helps you compare dividend performance across years.
- Yield review: The Yield by Holding chart supports holding-level income comparison.
- Sector allocation: The Income Mix by Sector chart helps you understand where dividend income is coming from.
- Dropdown control tab: Standardized dropdown options reduce messy labels and make the dashboard easier to filter.
- Google Sheets workflow: The file can be edited in the browser and shared through Google Drive permissions.
Dashboard Pages Explanation
1 – Overview Page
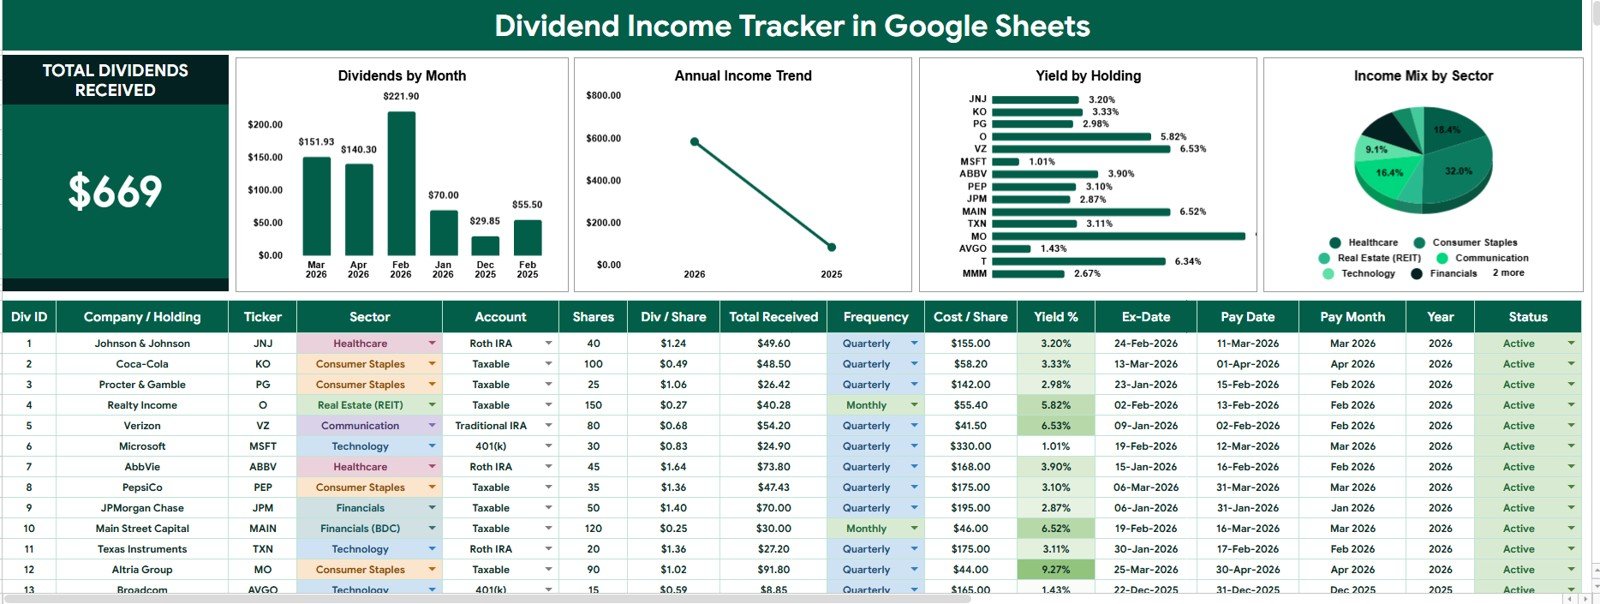
The Overview Page is the main dashboard page in the Dividend Income Tracker in Google Sheets. At the top of the sheet, the dashboard includes a card for Total Dividends Received, giving users an immediate view of the income recorded in the tracker.
The page also includes multiple slicers so users can quickly filter the dashboard and focus on a specific account, sector, frequency, holding status, month, year, or other available field. This is useful when a user wants to move from a full portfolio view to a more specific question, such as taxable account income or sector-level income exposure.
Dividends Received by Month: This chart shows dividend income across the months of the year. It helps users identify high-income months, quiet periods, and the timing pattern of dividend cash flow.
Annual Income by Year: This chart compares dividend income year over year. It helps users see whether their dividend stream is increasing, staying flat, or declining over time.
Yield by Holding: This chart compares yield across individual holdings. It helps users review which stocks, funds, or income assets are producing higher yield inside the portfolio.
Income Mix by Sector: This chart breaks dividend income into sectors. It helps users see whether too much dividend income depends on one sector, such as finance, energy, utilities, consumer staples, or real estate.Dividend Income Tracker in Google Sheets
Dividend Income Tracker in Google Sheets
2 – Dropdown List Tab
The Dropdown List tab is the control area for standardized inputs. Clean dropdowns matter because small spelling differences, such as “Tech” and “Technology”, can split chart results and make the dashboard harder to trust.
Sector Options by Investment Category: This area stores the sector options used for dividend holdings. It keeps sector reporting consistent across the tracker.Dividend Income Tracker in Google Sheets
Account Options by Account Type: This area lets users maintain account categories such as taxable brokerage, retirement account, individual account, family account, or any custom account structure.Dividend Income Tracker in Google Sheets
Dividend Frequency by Payment Schedule: This list supports standard payment schedules such as monthly, quarterly, semiannual, annual, or custom labels.Dividend Income Tracker in Google Sheets
Holding Status by Portfolio Stage: This list helps users separate active holdings, watchlist holdings, closed holdings, paused holdings, or other stages used in their workflow.Dividend Income Tracker in Google Sheets
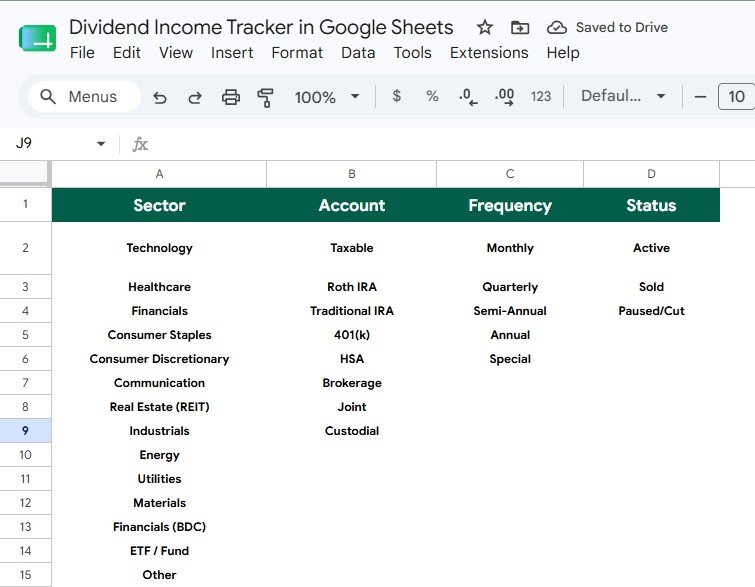
Dropdown List Tab
Dividend Income Tracker in Google Sheets vs. Microsoft Excel Tracker vs. Paid Investment SaaS – Feature Comparison
| Feature | Dividend Income Tracker in Google Sheets | Microsoft Excel Tracker | Paid Investment SaaS |
|---|---|---|---|
| Cost | One-time template price | Spreadsheet file, often self-built | Recurring monthly or annual fee |
| Platform | Google Sheets in the browser | Excel desktop or Excel online | Vendor web platform |
| Setup time | Start with a ready overview and dropdown structure | May require formulas, charts, and formatting | Requires account setup and configuration |
| Real-time team collaboration | Built around Google Drive sharing | Depends on OneDrive or local sharing process | Usually available but tied to plan limits |
| Mobile access | Available through Google Sheets mobile app or browser | Available through Excel app, depending on file location | Usually available through web or app |
| Customizable fields | Easy to edit inside the sheet | Easy if you know the workbook structure | Depends on vendor settings |
| Share with link | Yes, using Google Drive permissions | Yes, with cloud storage setup | Usually inside the paid app |
| Year-1 cost at 5 users | One purchase, then share your copy as needed | Depends on Microsoft licensing and setup | Can rise quickly when priced per user |
| Dividend-specific charts | Includes monthly dividends, annual income, yield, and sector mix | Must be built or adapted | May be available with broader portfolio modules |
Who Should Use This Template
This template is a good fit for individual investors who want a clear view of dividend income, dividend growth investors who review income by month and year, personal finance users who separate accounts, and advisors who need a simple client discussion sheet. It also works for finance students learning how income portfolios are organized.Dividend Income Tracker in Google Sheets
It is not meant to replace a brokerage account, tax platform, or automated market-data service. If you need live brokerage synchronization, tax form generation, dividend reinvestment automation, or compliance reporting, use a dedicated financial platform alongside or instead of a spreadsheet tracker.Dividend Income Tracker in Google Sheets
Real-World Use Cases
Dividend growth review: A long-term investor can use Annual Income by Year to see whether income is increasing after new contributions, dividend raises, or portfolio changes.
Cash-flow planning: A retiree or passive income planner can review Dividends Received by Month to identify which months need additional savings, side income, or expense planning.
Portfolio concentration check: An advisor can use Income Mix by Sector to discuss whether a client relies too much on a small number of sectors for dividend income.
Account-level organization: A household finance manager can separate taxable, retirement, and other account types so dividend records stay easier to audit later.
Advantages of Dividend Income Tracker in Google Sheets
The biggest advantage is simplicity. You do not need a full subscription platform just to understand dividend income patterns. The tracker keeps dividend analysis close to the data, and users can adjust labels, accounts, sectors, and status values as their portfolio changes.
Because it is a Google Sheets template, it also fits collaborative workflows. Google Workspace guidance explains that file owners can share a file, choose Viewer, Commenter, or Editor access, and adjust link access. That makes it practical to collaborate with a spouse, advisor, accountant, or team member while keeping control of permissions. You can review Google’s official file-sharing guidance here: Share files and folders in Drive.
Opportunities for Improvement
This tracker is intentionally lightweight. Users who want automatic dividend imports, live market prices, tax-lot history, or broker-level reconciliation will need additional tools. Some users may also want to add columns for withholding tax, reinvestment, currency, or ex-dividend dates. Since the template is editable, those fields can be added, but they are not the central workflow described in the supplied screenshots.
Another improvement opportunity is periodic reconciliation. A spreadsheet is only as reliable as the data entered into it. Users should compare their tracker against brokerage statements before using the totals for financial decisions.
Best Practices
Start by reviewing the sample data before replacing it. Then update the Dropdown List tab so sectors, accounts, frequencies, and holding statuses match your real portfolio. Use consistent names for holdings and sectors, because consistent labels make charts easier to trust.
Set a monthly review habit. At the end of each month, update dividend payments, check the Dividends Received by Month chart, and review whether annual income is moving in the right direction. Once per quarter, review Yield by Holding and Income Mix by Sector to understand whether the portfolio still matches your income strategy.
When sharing the file, choose the minimum permission level needed. For example, an advisor may only need Viewer or Commenter access, while a spouse or team member may need Editor access.
Explore Relevant Templates
If you want to track broader investment activity, see Investment Tracker in Google Sheets. For a wider money dashboard, explore Personal Finance KPI Dashboard in Google Sheets. You may also like Net Worth Tracker in Google Sheets and Emergency Fund Tracker in Google Sheets.
You can browse more ready-to-use templates in Google Sheets Financial Tools and Google Sheets Trackers.
Frequently Asked Questions
What is the Dividend Income Tracker in Google Sheets?
It is a Google Sheets template for recording dividend income, reviewing monthly and annual trends, comparing yield by holding, and analyzing dividend income by sector.
Does it include dashboard charts?
Yes. The Overview Page includes charts for Dividends Received by Month, Annual Income by Year, Yield by Holding, and Income Mix by Sector.
Can I change the sector and account options?
Yes. The Dropdown List tab includes setup areas for sector options, account options, dividend frequency, and holding status.
Does it pull data automatically from my broker?
No. It is a manual Google Sheets tracker. You enter or paste your dividend records into the template and use the dashboard to review them.
Can I use it for multiple accounts?
Yes. The account options are designed so you can separate different account types or portfolio buckets.Dividend Income Tracker in Google Sheets
Is it good for dividend tax reporting?
It can help organize records, but it is not tax software. Always verify tax numbers against official brokerage statements and professional advice.Dividend Income Tracker in Google Sheets
Can I share it with my advisor?
Yes. Since the tracker is built in Google Sheets, you can share the file through Google Drive with Viewer, Commenter, or Editor permissions.
About the Author
Built by PK – Microsoft Certified Professional with 15+ years of Excel, Google Sheets, and Power BI experience. Founder of NextGenTemplates, reaching 300K+ subscribers across YouTube channels. Every template is hand-built and tested before release.
Get the template: Download the Dividend Income Tracker in Google Sheets from NextGenTemplates and start tracking dividend payments, annual income, yield by holding, and sector mix in your own Google Sheets copy.
Conclusion
The Dividend Income Tracker in Google Sheets gives dividend investors a practical place to monitor income received, monthly payment timing, annual growth, yield by holding, and sector concentration. It is best for users who want spreadsheet flexibility, clean dashboard views, and a one-time template purchase instead of another recurring subscription.
Use it to review dividend income each month, prepare portfolio conversations, and keep your income records more organized. For step-by-step spreadsheet and dashboard tutorials, visit YouTube.com/@NeotechNavigators.