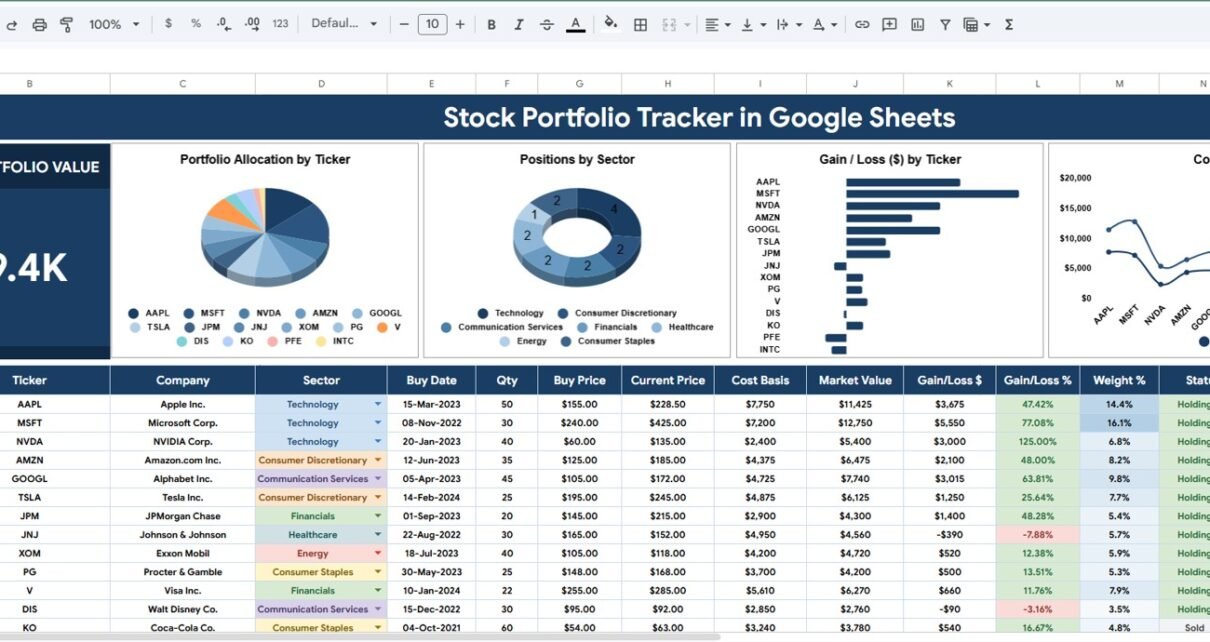
Gallup reported that 62% of U.S. adults owned stock in 2025, and the Federal Reserve reported $64.8 trillion in directly and indirectly held household equity shares in Q1 2026. With that much personal wealth tied to stocks, ETFs, and funds, investors need a clean way to see allocation, cost basis, market value, and gain/loss without relying only on brokerage screens. The Stock Portfolio Tracker in Google Sheets gives you a practical two-tab workbook for portfolio monitoring, dropdown setup, slicer filtering, and visual review.
Important: this tracker supports personal analysis and record-keeping. It is not a brokerage account, tax-lot accounting system, trading recommendation, or substitute for professional financial advice.
Key Features of Stock Portfolio Tracker in Google Sheets
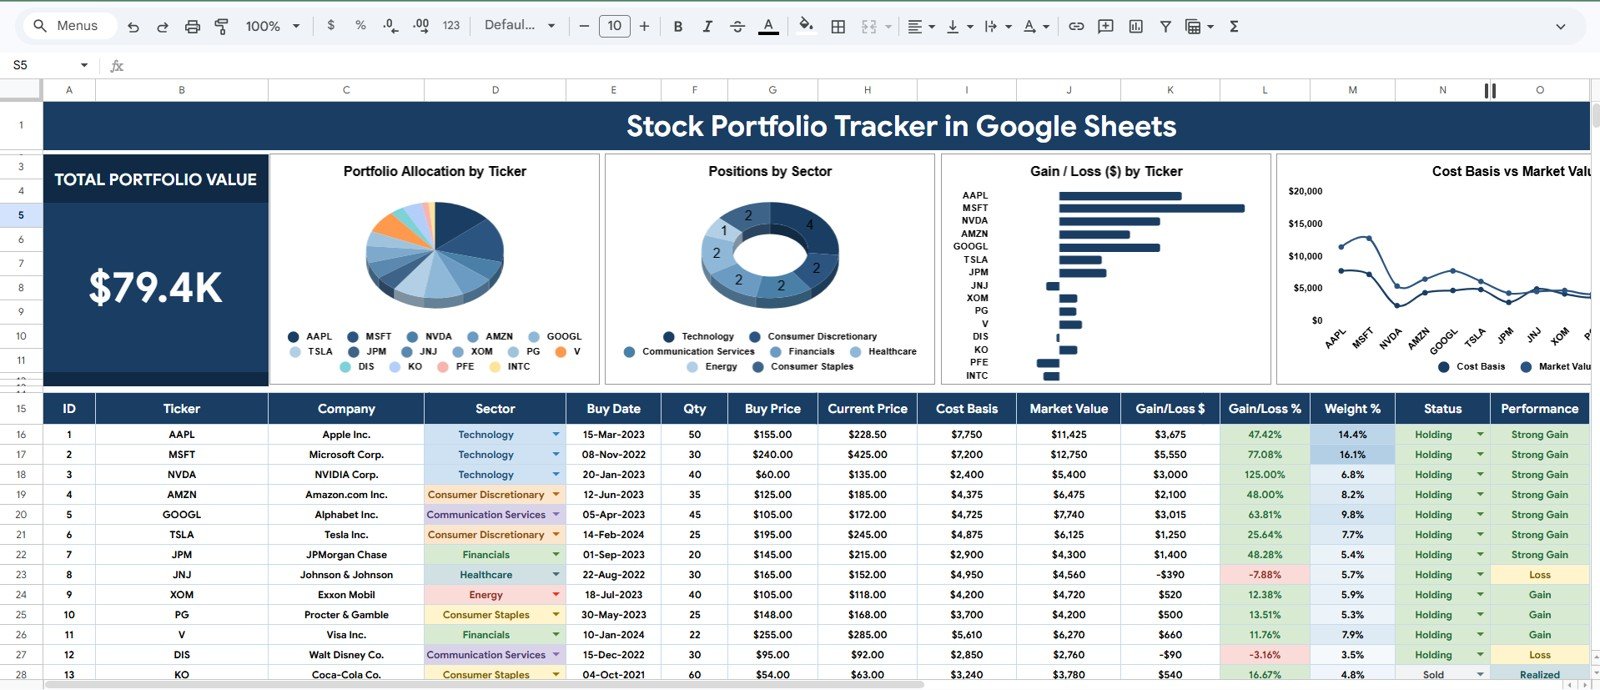
- Total Portfolio Value card: See the selected market value in one high-level card on the Overview page.Stock Portfolio Tracker in Google Sheets
- Portfolio Allocation by Ticker: Understand how much of the portfolio sits in each stock, ETF, or fund ticker.Stock Portfolio Tracker in Google Sheets
- Positions by Sector: Review sector exposure so concentration is easier to spot.
- Gain / Loss ($) by Ticker: Compare dollar gain or loss by holding.
- Cost Basis vs Market Value: See how each position’s entered cost basis compares with market value.Stock Portfolio Tracker in Google Sheets
- Multiple slicers: Filter the dashboard quickly during monthly reviews.
- Dropdown List tab: Maintain sector and position-status options in one location.
- Google Sheets access: Copy the tracker to Google Drive and customize it for your own portfolio.
Dashboard Pages Explanation
1. Overview Page
The Overview page is the main dashboard. At the top, the Total Portfolio Value card gives you the headline number for the selected holdings after filters are applied.
Portfolio Allocation by Ticker
This chart shows how portfolio value is distributed by ticker. It helps you see whether a single stock, ETF, or fund is taking up more of the portfolio than intended.
Positions by Sector
This chart groups your positions by sector. It is useful for identifying whether the portfolio is leaning heavily toward one area such as technology, financials, healthcare, or energy.
Gain / Loss ($) by Ticker
This chart compares dollar gain or loss for each ticker. It helps you identify which holdings are driving performance and which ones need closer review.
Cost Basis vs Market Value by Ticker
This chart compares the amount invested with current market value by ticker. It gives a quick visual read on unrealized movement and helps you check whether the data needs reconciliation.Stock Portfolio Tracker in Google Sheets
2. Dropdown List Tab
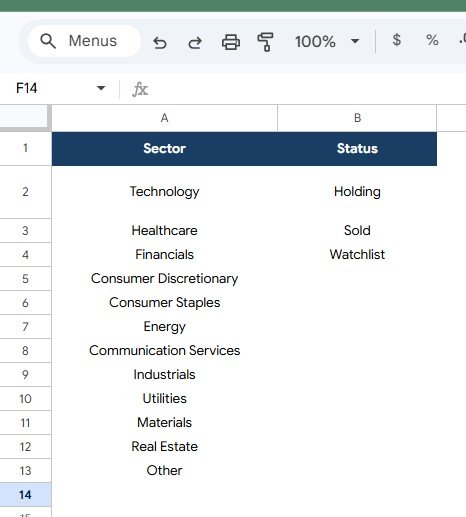
The Dropdown List tab stores the controlled values used across the workbook. Keeping dropdown values in one place reduces inconsistent labels and makes slicers and charts easier to read.
Sector Options by Portfolio Category: This area stores sector or category values used for classification. Clear sector names make the Positions by Sector chart more reliable.
Position Status by Tracking Stage: This area stores status values such as active, watchlist, closed, review, or custom labels. Consistent status choices make filtering easier during portfolio review.
Dropdown List Tab
Stock Portfolio Tracker in Google Sheets vs. Microsoft Excel vs. Paid Portfolio SaaS – Feature Comparison
| Feature | Google Sheets tracker | Microsoft Excel alternative | Paid portfolio SaaS |
|---|---|---|---|
| Cost | $6.99 one-time sale price | Workbook cost plus any Microsoft licensing | Usually monthly or annual |
| Platform | Google Sheets in Drive | Excel desktop or web | Vendor web or mobile app |
| Setup time | Copy file, update lists, enter positions | Open workbook and customize | Create account, connect accounts, or import data |
| Real-time collaboration | Native Google Drive sharing | Depends on OneDrive or SharePoint setup | Depends on plan |
| Mobile access | Google Sheets app or browser | Excel app or browser | Usually included |
| Customizable fields | Editable tickers, sectors, statuses, formulas, and charts | Usually editable if workbook is unlocked | Often limited by app settings |
| Share with link | Yes, with selected permissions | Yes, through Microsoft sharing tools | Usually account-based |
| Year-1 cost at 5 users | $6.99 total for the template | Template plus licensing | Can rise with users or premium features |
| Ticker allocation view | Included | Must be built or purchased | Varies by vendor |
| Brokerage login required | No | No | Often encouraged for automation |
Who Should Use This Template
- Individual investors who want a clean manual stock portfolio tracker in Google Sheets.
- Households that review portfolio allocation and gain/loss during monthly finance check-ins.
- Finance coaches who need a simple visual tool for client conversations.
- Students learning how cost basis, market value, sector exposure, and ticker allocation fit together.
- Investment clubs that want a shared spreadsheet view without a paid app subscription.
This template is not designed for high-frequency traders, institutional portfolio managers, automated tax-lot accounting, brokerage order placement, compliance reporting, or advanced risk modeling.
Real-World Use Cases
Maya: self-directed investor
Maya adds each holding with its ticker, sector, status, cost basis, and market value. Before investing new cash, she checks allocation by ticker and Positions by Sector to avoid adding more to an already concentrated area.
Jordan and Priya: household finance review
Jordan and Priya use the tracker during their monthly budget meeting. The Cost Basis vs Market Value chart helps them discuss portfolio movement without logging into multiple brokerage screens during the conversation.
Elena: finance coach
Elena duplicates the tracker for each coaching client. She uses Gain / Loss ($) by Ticker as a starting point, then asks the client to reconcile the numbers against official brokerage statements before making decisions.
Advantages of Stock Portfolio Tracker in Google Sheets
The main advantage is transparency. You can see the fields, update the dropdown lists, inspect the formulas, and adjust the workbook to match your preferred portfolio categories.
Google Sheets also makes sharing simple. You can give view-only access to a spouse, business partner, coach, or adviser while keeping control of edit permissions. Because the tracker is manual, it does not require bank or brokerage credentials.
Opportunities for Improvement
Users with advanced needs may want to extend the template. Possible additions include dividend tracking, realized gain/loss, tax lots, benchmark comparison, currency conversion, portfolio targets, and automatic price refreshes.
If you choose to add live stock data, Google documents the GOOGLEFINANCE function for Google Sheets. Availability and delays can vary, so any live-price extension should still be checked against your brokerage records.
Best Practices
- Update data on a schedule. Weekly or monthly updates are easier to audit than scattered changes.
- Keep sector labels consistent. Use the Dropdown List tab instead of typing new labels directly into the data area.
- Reconcile with brokerage statements. Treat the sheet as a planning aid, not the official record.
- Record the price date. If market value is manually entered, note when the values were updated.
- Protect sensitive access. Review Google Drive permissions before sharing the file.
- Keep a clean backup. Preserve an original copy before changing formulas or chart ranges.
Explore Relevant Templates
- Stock Portfolio Tracker in Google Sheets for ticker, sector, cost basis, market value, and gain/loss tracking.
- Investment Management Dashboard in Google Sheets for a wider investment-management reporting view.
- Personal Finance Net Worth Tracker in Google Sheets for assets, liabilities, and net worth tracking.
- Loan EMI Repayment Tracker in Google Sheets for installment-loan repayment visibility.
- Mortgage Payoff Tracker in Google Sheets for mortgage balance and payoff planning.
Want to build trackers like this step by step? The NextGenTemplates Academy learning paths teach the spreadsheet skills behind them, with practice files.
Get the Stock Portfolio Tracker in Google Sheets
Frequently Asked Questions
What does the Stock Portfolio Tracker in Google Sheets include?
It includes an Overview page with one portfolio value card, four portfolio charts, slicers, and a Dropdown List tab for sector and position-status options.
Can I track stocks and ETFs in the same file?
Yes. You can add each stock, ETF, fund, or custom holding as a ticker or position in the tracker.
Does the tracker connect directly to a brokerage account?
No. It is a manual Google Sheets tracker. This helps keep setup simple and avoids requiring brokerage login credentials.
Can I customize sectors and position statuses?
Yes. The Dropdown List tab lets you manage sector options and position-status values used by the workbook.
Does this calculate taxes?
No. It tracks portfolio value and gain/loss for analysis. Use official records and qualified tax guidance for tax reporting.
Can I share the tracker with someone else?
Yes. After copying it to Google Drive, you can share the file with view or edit permissions.
Is this suitable for professional trading?
No. It is designed for personal portfolio tracking and review, not trade execution, compliance reporting, or institutional portfolio management.
About the Author
Built by PK – Microsoft Certified Professional with 15+ years of Excel, Google Sheets, and Power BI experience. Founder of NextGenTemplates, reaching 300K+ subscribers across YouTube channels. Every template is hand-built and tested before release.
Conclusion
The Stock Portfolio Tracker in Google Sheets gives investors a clear way to review portfolio value, ticker allocation, sector exposure, gain/loss, and cost basis versus market value from one editable workbook. It fits people who want spreadsheet control, simple sharing, and a one-time purchase instead of another subscription.
Last updated: July 19, 2026.