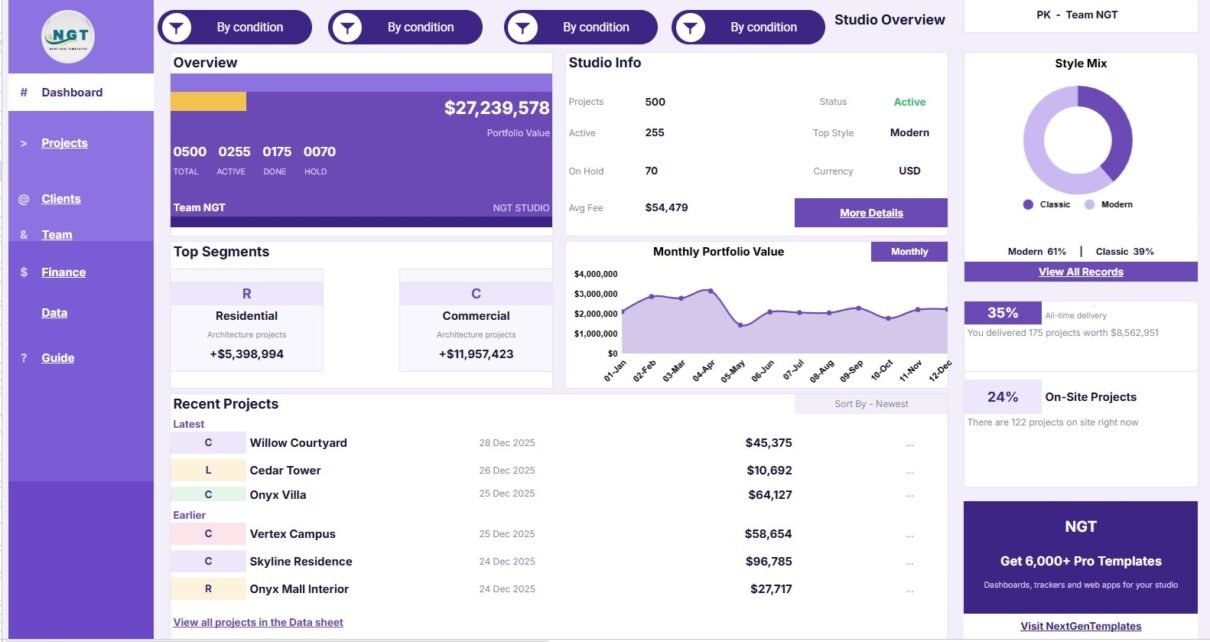
The Architecture and Design Dashboard in Google Sheets is a ready-to-use reporting template for studios that need project, client, team, budget, billing, and portfolio visibility in one editable spreadsheet. The file includes 6 working tabs, 5 dashboard pages, 13 overview KPI cards, and 34 analysis views, giving architecture firms and design teams a cleaner way to review work without building a dashboard from scratch.
This dashboard is built for teams that already keep project data in spreadsheets, exported reports, or manual trackers. Instead of jumping between separate project status lists, billing files, client summaries, and timesheet views, you can add records into the Data Sheet and review the full picture from the dashboard tabs. Because it is built in Google Sheets, it also supports familiar sharing and collaboration workflows through Google Drive. Google provides more details on Sheets collaboration in its official Google Docs Editors Help guide.
The Architecture and Design Dashboard in Google Sheets is a ready-to-use reporting template for studios that need project, client, team, budget, billing, and portfolio visibility in one editable spreadsheet. The file includes 6 working tabs, 5 dashboard pages, 13 overview KPI cards, and 34 analysis views, giving architecture firms and design teams a cleaner way to review work without building a dashboard from scratch.
This dashboard is built for teams that already keep project data in spreadsheets, exported reports, or manual trackers. Instead of jumping between separate project status lists, billing files, client summaries, and timesheet views, you can add records into the Data Sheet and review the full picture from the dashboard tabs. Because it is built in Google Sheets, it also supports familiar sharing and collaboration workflows through Google Drive. Google provides more details on Sheets collaboration in its official Google Docs Editors Help guide.
Click here to purchase the Architecture and Design Dashboard in Google Sheets
Key Features of Architecture and Design Dashboard in Google Sheets
- 6 connected sheet tabs covering Overview, Project Performance, Client Insights, Team and Hours, Budget and Billing, and Data Sheet.
- 13 overview cards for Total, Active, Done, Hold, Portfolio Value, Projects, On Hold, Avg Fee, Status, Top Style, Currency, All-time delivery, and On-Site Projects.
- 34 analysis views for project status, pipeline stage, delivery status, handover stage, client type, client segment, design hours, team capacity, revenue, cost, and margin.
- Slicers and filters help users focus the dashboard by project, client, date, status, design style, site status, discipline, and finance-related fields where available.
- Editable data structure lets teams replace sample records with real architecture and design project data.
- Google Sheets format makes it suitable for teams that want a shareable file instead of a locked reporting system.
Dashboard Pages Explanation
The dashboard is organized into focused pages so users can start with a high-level view and then move into project, client, team, and finance analysis. Each page has its own purpose, but the structure stays consistent so users can move through the file quickly during review meetings.
Page 1: Overview
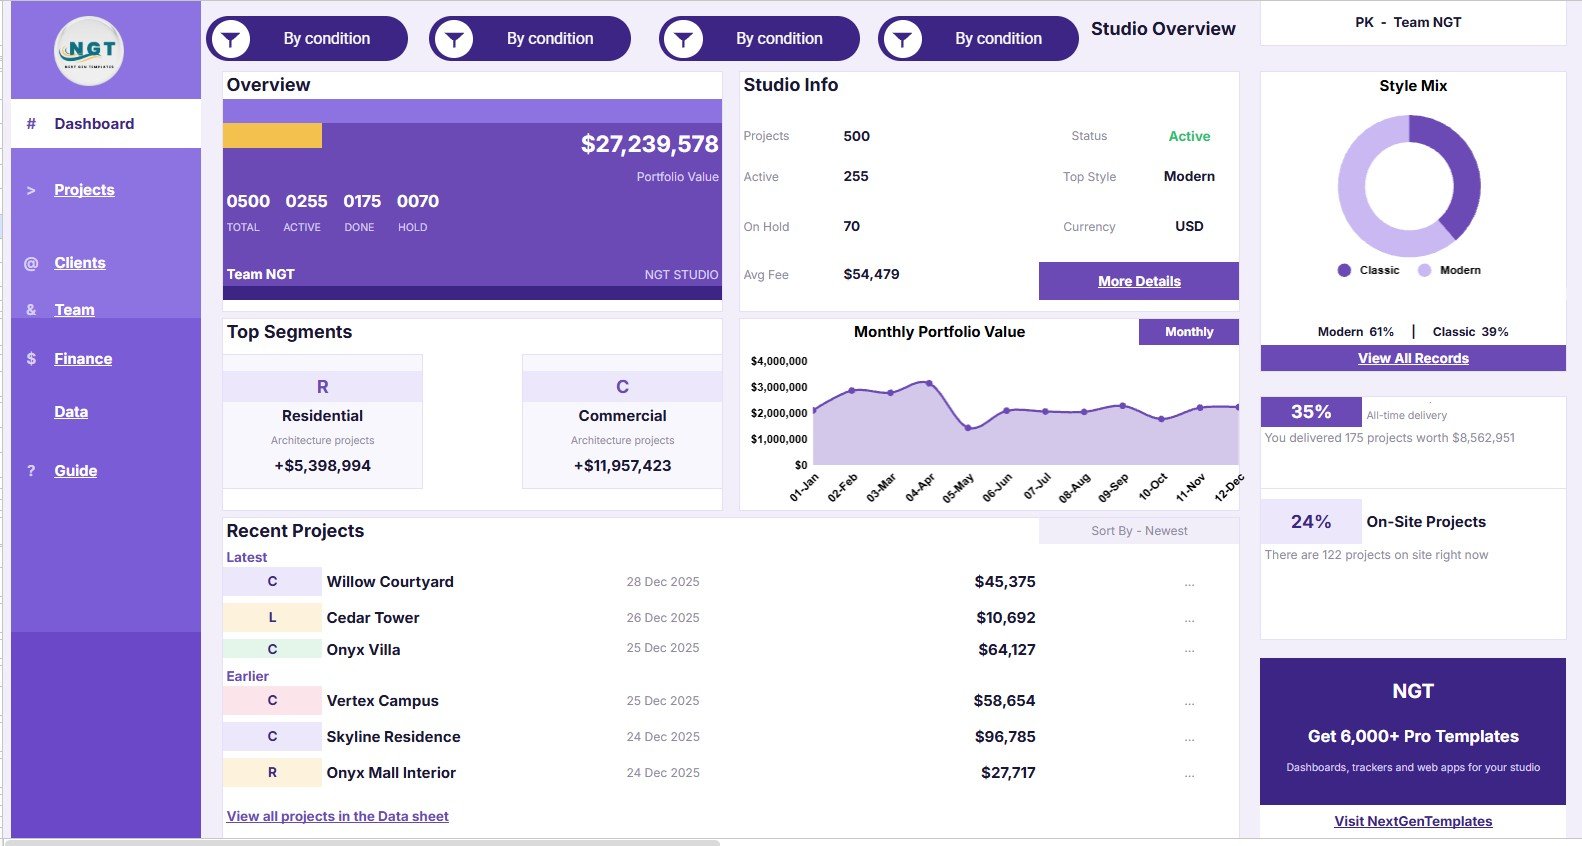
The Overview page is the executive summary for the architecture and design portfolio. At the top, KPI cards show Total, Active, Done, Hold, Portfolio Value, Projects, On Hold, Avg Fee, Status, Top Style, Currency, All-time delivery, and On-Site Projects.
Portfolio Value by Month: This view shows how total project value changes month by month. It helps owners see whether the portfolio is growing, slowing, or becoming concentrated in certain periods.
Projects by Style: This view compares projects by design style. It helps studios understand whether demand is leaning toward a particular architectural or interior design direction.
Portfolio Value by Segment: This view breaks value across business or client segments. It helps teams identify which segments contribute the most to the current pipeline.
Projects by Delivery Status: This view groups projects by delivery status. It helps project managers spot how much work is active, completed, pending, or delayed.
Projects by Site Status: This view separates projects by site activity. It helps teams understand which projects are on-site and which are still in design, planning, or non-site phases.
Recent Projects by Date: This view highlights the latest project records by date. It makes recent updates visible without asking users to search the Data Sheet manually.
Architecture and Design Dashboard in Google Sheets
Page 2: Project Performance
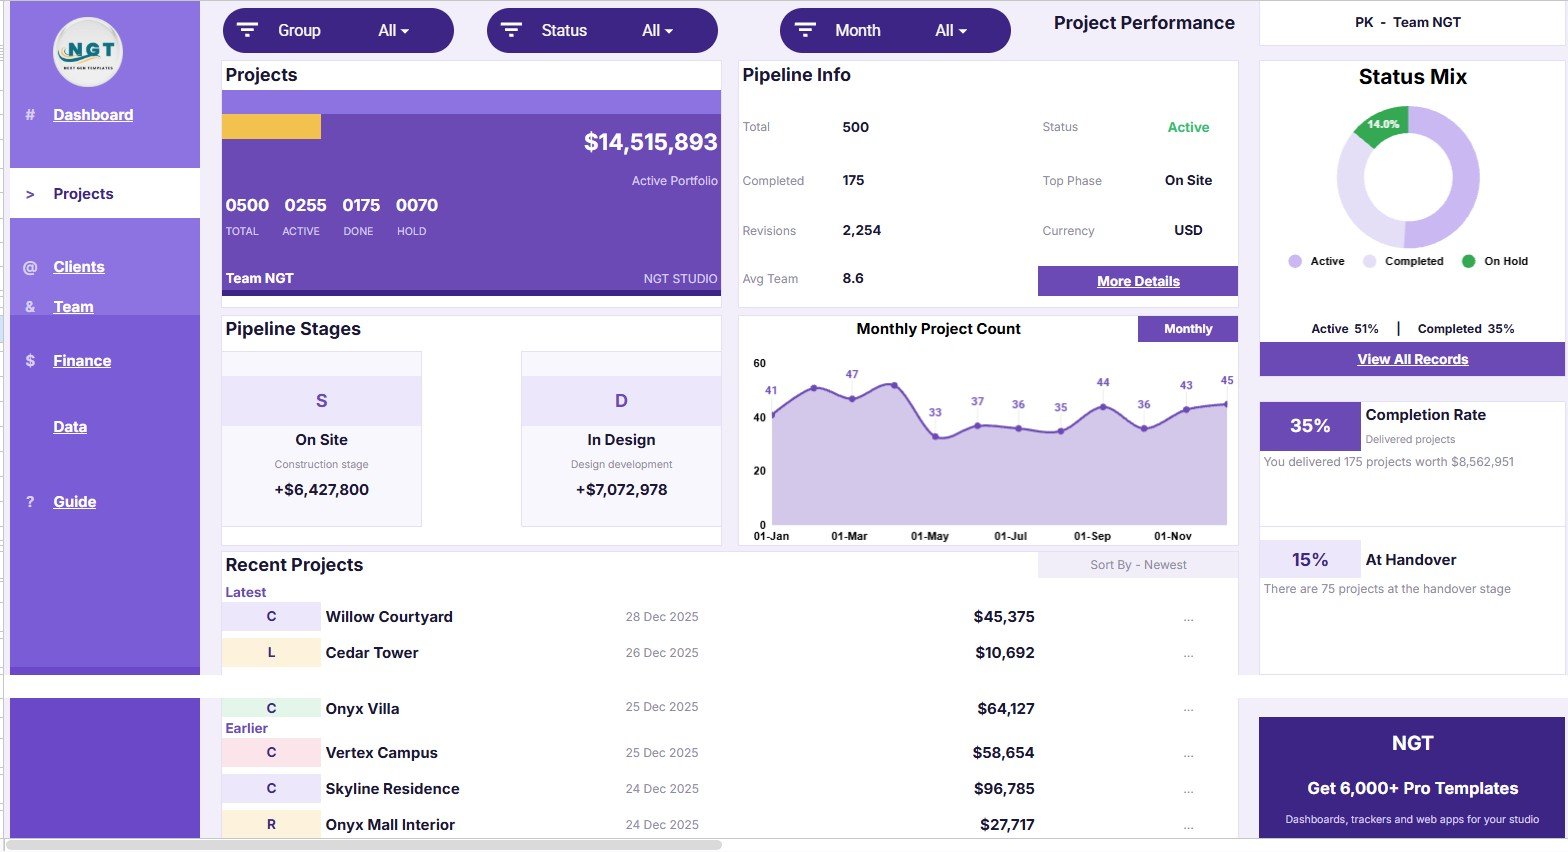
The Project Performance tab focuses on status, pipeline movement, handover progress, and completion behavior. It is useful for weekly operations meetings, client delivery reviews, and project manager check-ins.
Active Portfolio by Project Status: This view shows active portfolio value or workload by current project status. It helps identify whether the active portfolio is concentrated in one stage.
Project Count by Month: This view tracks the number of projects over time. It helps studios understand project volume trends and seasonality.
Projects by Status: This view groups the full project list by status. It provides a quick view of active, done, hold, and other project categories.
Project Value by Pipeline Stage: This view compares project value across pipeline stages. It helps leaders see where revenue potential is sitting before delivery is complete.
Completion Rate by Delivery Status: This view connects completion rate with delivery status. It helps teams compare delivery progress across different status groups.
Projects by Handover Stage: This view groups projects by handover stage. It helps identify which projects are close to client delivery and which still need completion work.
Recent Projects by Date: This view keeps recent project movement visible. It is helpful when reviewing what changed since the last internal meeting.
Project Performance
Page 3: Client Insights
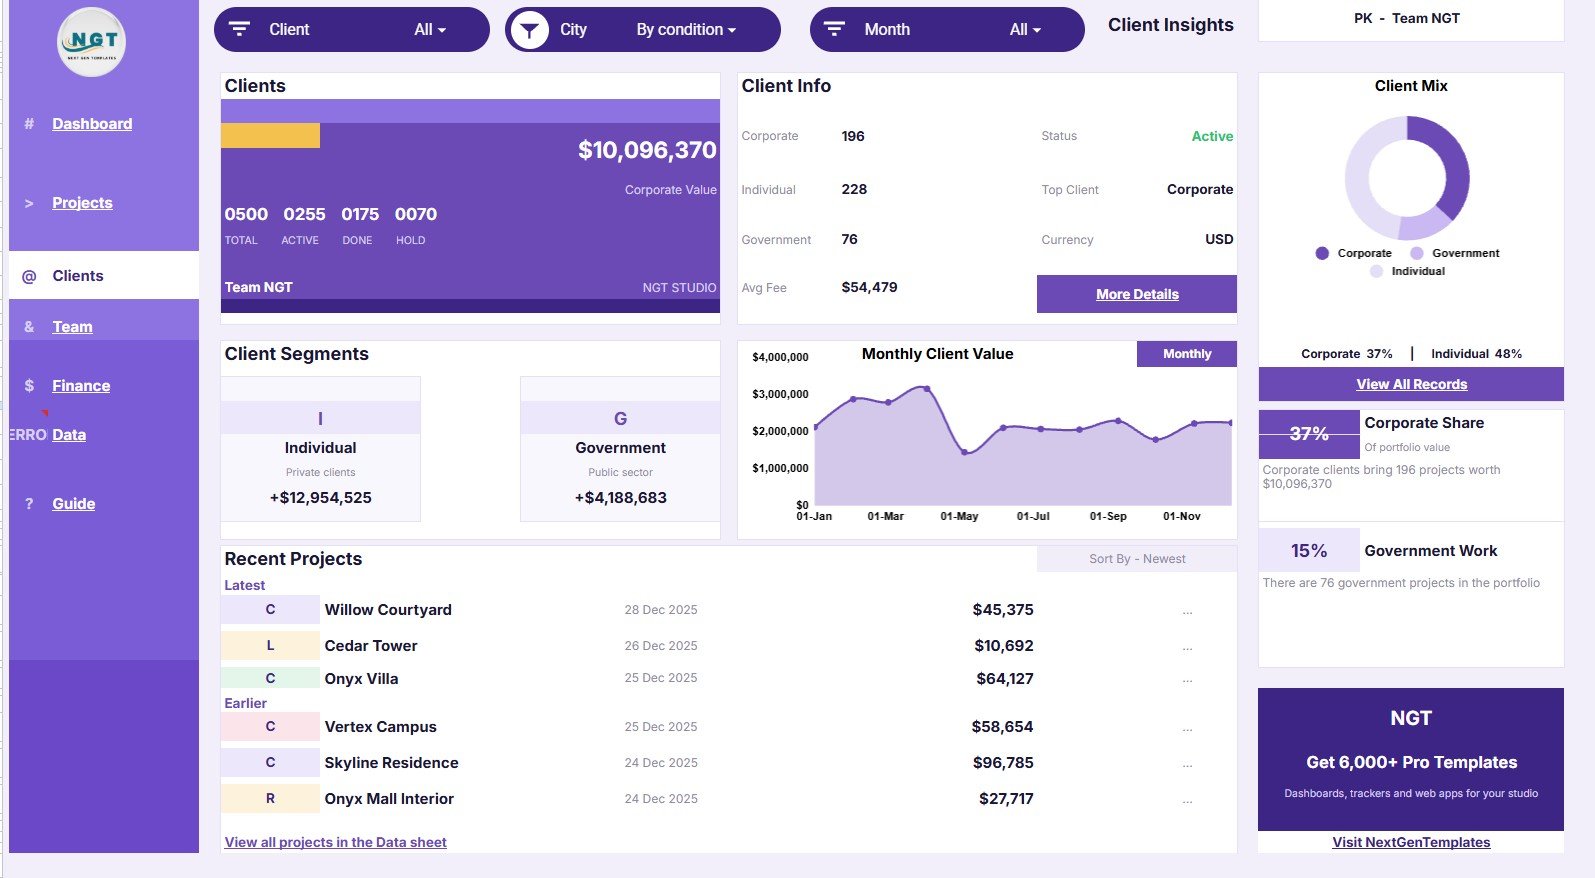
The Client Insights tab helps users understand the client side of the portfolio. It is especially useful for owners, business development leads, and account managers who want to see whether value is coming from corporate, government, or other client segments.
Corporate Value by Client Type: This view compares corporate value across client types. It helps teams understand which client groups are contributing the most corporate work.
Client Value by Month: This view shows client value over time. It helps identify months with stronger client contribution and periods that may need follow-up activity.
Projects by Client Type: This view counts projects by client type. It helps studios see whether their workload is balanced across client groups.
Client Value by Client Segment: This view compares value by client segment. It helps users identify high-value segments that deserve deeper relationship management.
Portfolio Value by Corporate Share: This view shows how portfolio value changes by corporate share. It helps owners understand how much of the portfolio is tied to corporate clients.
Projects by Government Work: This view separates projects based on government work. It helps firms monitor public-sector exposure and compare it with private client work.
Recent Projects by Date: This view shows newer project activity from the client perspective. It helps users connect recent records with the client mix.
Client Insights
Page 4: Team and Hours
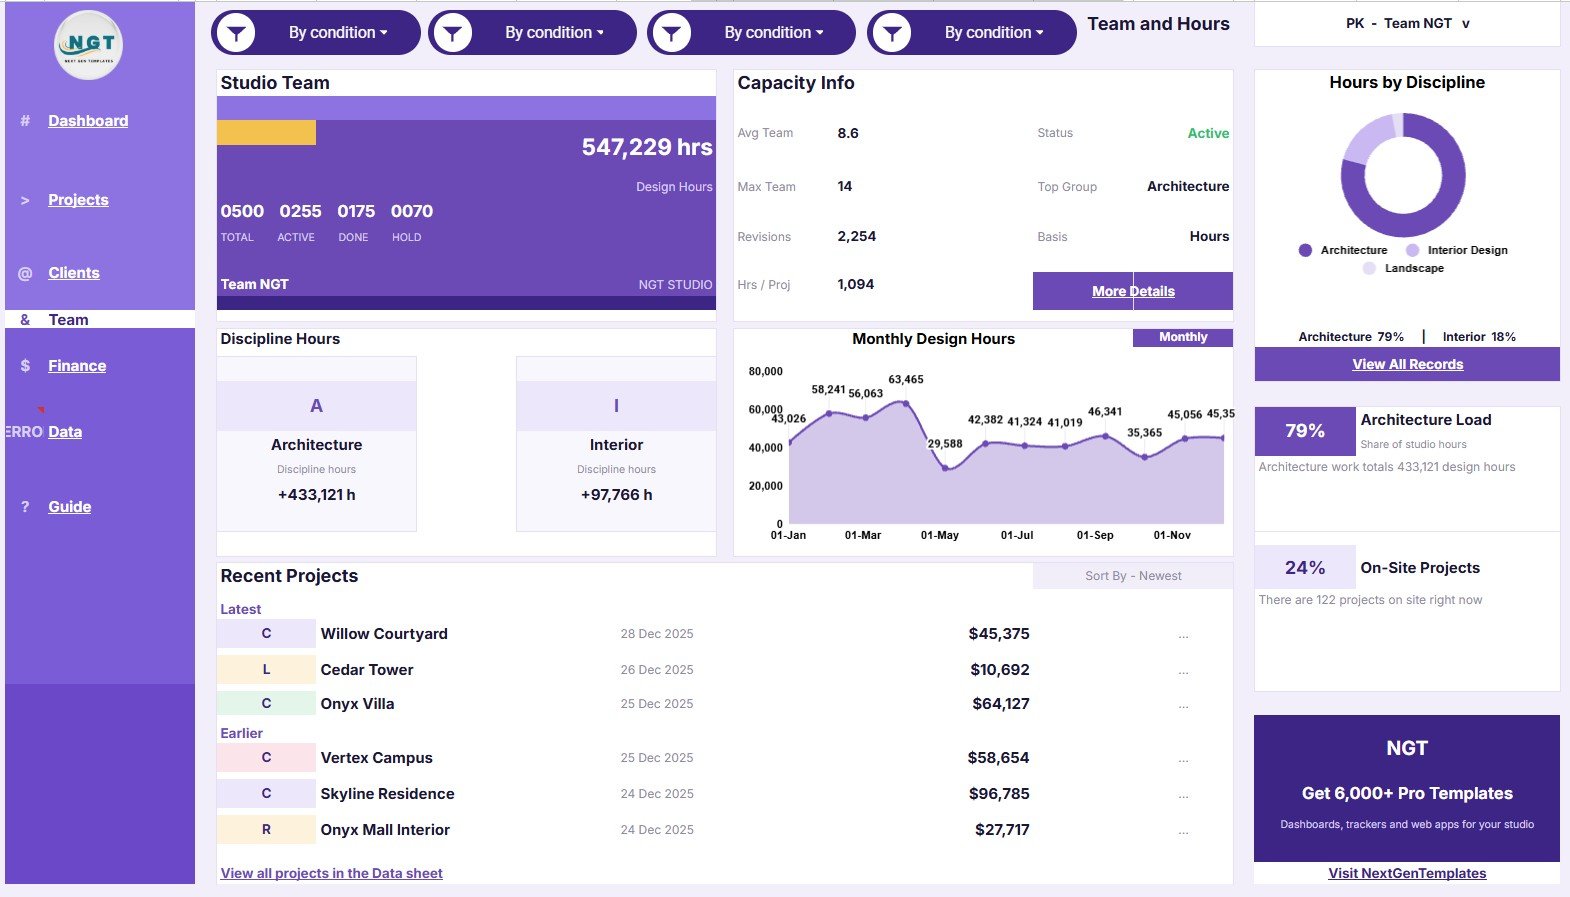
The Team and Hours tab is built for resource review. It helps studio leads see where design hours are going, how work is distributed by discipline, and whether team capacity is aligned with current project demand.
Design Hours by Month: This view shows monthly design hours. It helps managers identify busy periods and plan future workload more carefully.
Hours by Discipline: This view compares hours across disciplines. It helps reveal whether architecture, interiors, planning, or other design work is consuming most of the team’s time.
Design Hours by Discipline: This view focuses on design-hour distribution by discipline. It helps teams understand which skills are most in demand.
Capacity by Team: This view compares capacity across teams. It supports staffing decisions when some groups are overloaded and others have room.
Architecture Load by Discipline: This view shows architecture workload by discipline. It helps leaders understand where architectural effort is concentrated.
Projects by Site Status: This view compares projects by site status from a workload angle. It helps teams see how much active site work may affect capacity.
Recent Projects by Date: This view keeps new or recently updated projects visible. It helps managers connect recent project movement to resource planning.
Team and Hours
Page 5: Budget and Billing
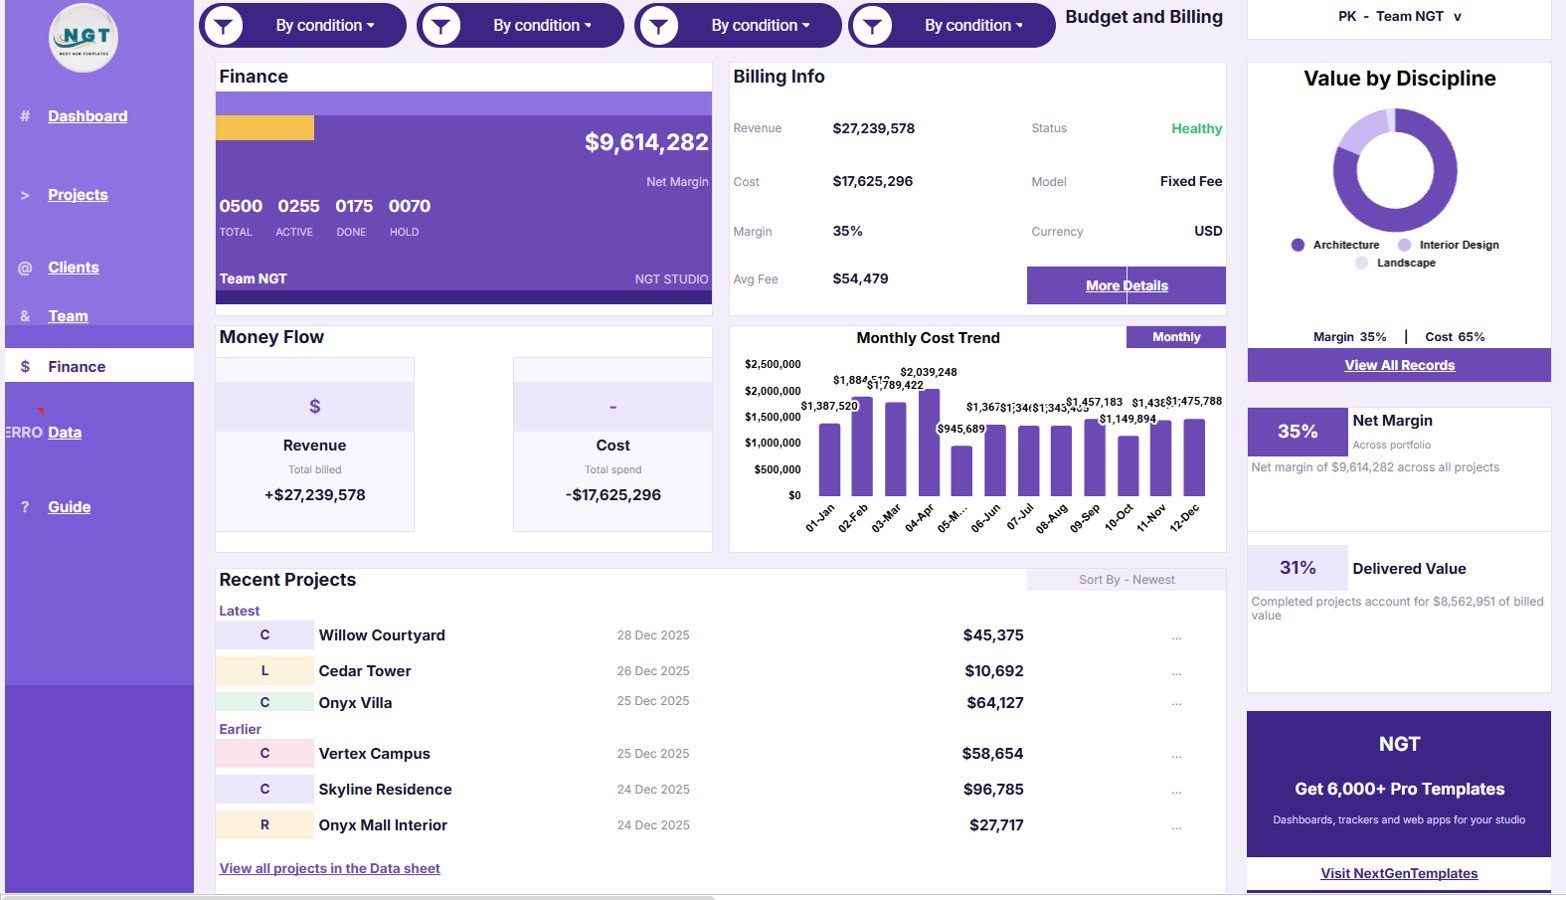
The Budget and Billing tab brings financial performance into the same reporting file. It helps owners and finance leads compare revenue, costs, value, margin, delivered work, and recent project activity.
Net Margin by Finance Summary: This view shows net margin by finance summary. It helps users understand whether the portfolio is producing healthy financial outcomes.
Revenue by Money Flow: This view compares revenue across money-flow categories. It helps identify how money is moving through the portfolio.
Cost by Month: This view tracks cost by month. It helps users see whether costs are rising during specific periods.
Value by Discipline: This view compares value across disciplines. It helps identify which design disciplines contribute the most value to the portfolio.
Margin by Portfolio: This view compares margin at the portfolio level. It helps owners see which parts of the portfolio are supporting profitability.
Delivered Value by Completion Status: This view connects delivered value with completion status. It helps teams see how much value is tied to completed or nearly completed work.
Recent Projects by Date: This view brings recent project records into the finance page. It helps teams connect new activity with billing and margin conversations.
Budget and Billing
Data Sheet
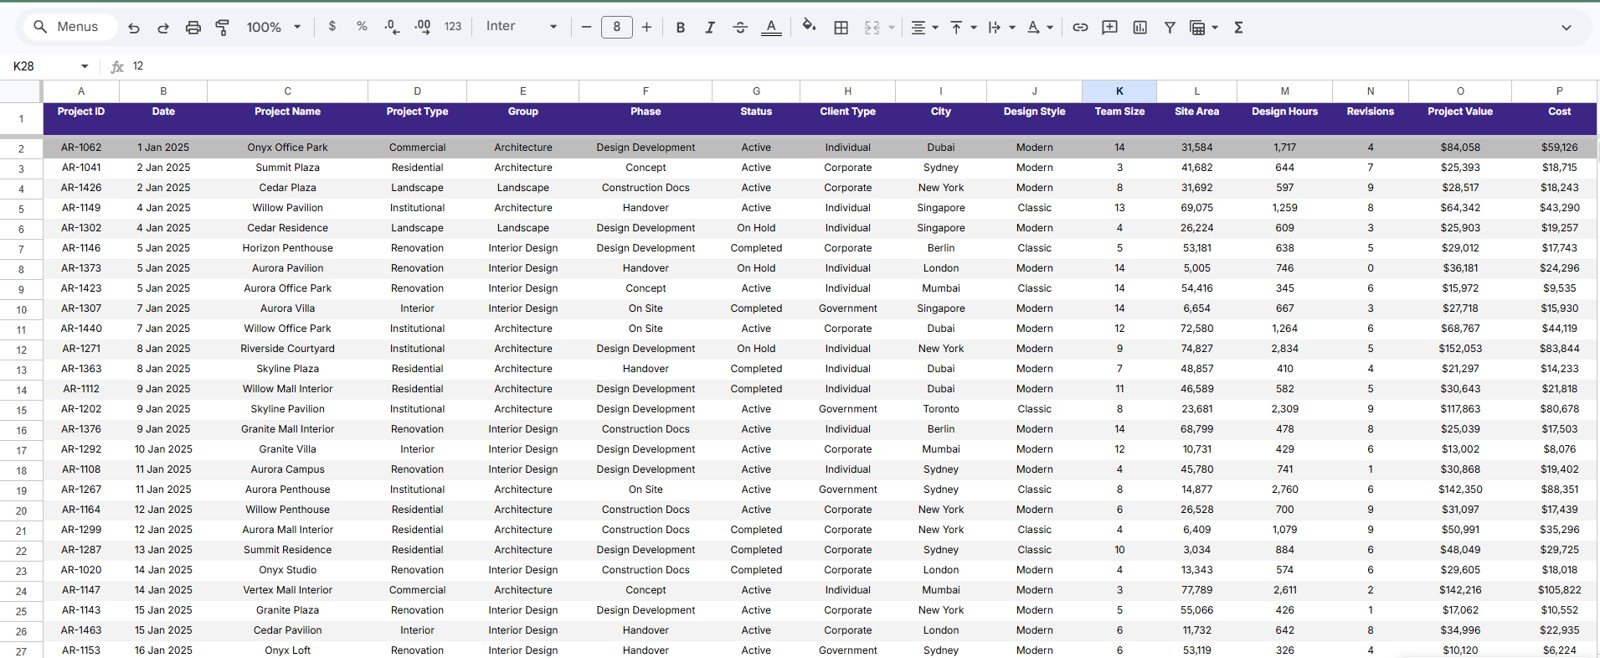
The Data Sheet is where users add architecture and design project records in the same format used by the dashboard. Keeping columns consistent is important because the dashboard pages, slicers, cards, and views rely on the structured data format.
Data Sheet tab
Architecture and Design Dashboard in Google Sheets vs. Microsoft Excel vs. Paid Project Management SaaS – Feature Comparison
| Feature | Architecture and Design Dashboard in Google Sheets | Microsoft Excel Dashboard | Paid Project Management SaaS |
|---|---|---|---|
| Cost | $9.99 one-time sale price | Template cost plus Excel access where needed | Monthly or annual subscription |
| Platform | Google Sheets in browser | Excel desktop or web | Vendor-hosted web platform |
| Setup time | Copy the sheet and replace sample rows | Open workbook and replace data | Configure workspace, users, permissions, and fields |
| Real-time team collaboration | Native Google Drive sharing | Available through Microsoft cloud sharing | Usually included by plan |
| Mobile access | Google Sheets app or browser | Excel app or browser | Vendor app or browser |
| Customizable fields | Editable sheet structure | Editable workbook structure | Limited by vendor configuration |
| Share with link | Yes, with permission controls | Yes, with compatible cloud storage | Usually account based |
| Year-1 cost at 5 users | $9.99 template price | Depends on existing licenses | Often a recurring team subscription |
| Architecture-specific reporting | Project, client, team, budget, billing, and data tabs included | Possible with custom setup | Varies by software plan |
Who Should Use This Template
This template is best for architecture firms, interior design studios, design consultants, project managers, project coordinators, and studio owners who already track work in spreadsheets and want a cleaner reporting layer. It is especially useful when a team needs to review project status, portfolio value, client mix, team capacity, and billing performance in one place.
It is not the right fit for teams that need automatic BIM integration, accounting software sync, resource approvals, client portals, proposal generation, or enterprise permissions. This is a dashboard template for structured project reporting, not a complete practice-management platform.
Real-World Use Cases
Studio owner review: A small architecture firm owner checks Portfolio Value, Active projects, On Hold work, Avg Fee, and Budget and Billing before a Monday management meeting.
Project manager delivery check: A project manager reviews Project Performance to compare delivery status, handover stage, project status, and completion rate before contacting clients.
Design operations planning: A design operations lead uses Team and Hours to compare discipline workload and capacity before assigning new work to architecture, interiors, or planning teams.
The Architecture and Design Dashboard in Google Sheets is a ready-to-use reporting template for studios that need project, client, team, budget, billing, and portfolio visibility in one editable spreadsheet. The file includes 6 working tabs, 5 dashboard pages, 13 overview KPI cards, and 34 analysis views, giving architecture firms and design teams a cleaner way to review work without building a dashboard from scratch.
This dashboard is built for teams that already keep project data in spreadsheets, exported reports, or manual trackers. Instead of jumping between separate project status lists, billing files, client summaries, and timesheet views, you can add records into the Data Sheet and review the full picture from the dashboard tabs. Because it is built in Google Sheets, it also supports familiar sharing and collaboration workflows through Google Drive. Google provides more details on Sheets collaboration in its official Google Docs Editors Help guide.
Click here to purchase the Architecture and Design Dashboard in Google Sheets
Key Features of Architecture and Design Dashboard in Google Sheets
- 6 connected sheet tabs covering Overview, Project Performance, Client Insights, Team and Hours, Budget and Billing, and Data Sheet.
- 13 overview cards for Total, Active, Done, Hold, Portfolio Value, Projects, On Hold, Avg Fee, Status, Top Style, Currency, All-time delivery, and On-Site Projects.
- 34 analysis views for project status, pipeline stage, delivery status, handover stage, client type, client segment, design hours, team capacity, revenue, cost, and margin.
- Slicers and filters help users focus the dashboard by project, client, date, status, design style, site status, discipline, and finance-related fields where available.
- Editable data structure lets teams replace sample records with real architecture and design project data.
- Google Sheets format makes it suitable for teams that want a shareable file instead of a locked reporting system.
Dashboard Pages Explanation
The dashboard is organized into focused pages so users can start with a high-level view and then move into project, client, team, and finance analysis. Each page has its own purpose, but the structure stays consistent so users can move through the file quickly during review meetings.
Page 1: Overview
The Overview page is the executive summary for the architecture and design portfolio. At the top, KPI cards show Total, Active, Done, Hold, Portfolio Value, Projects, On Hold, Avg Fee, Status, Top Style, Currency, All-time delivery, and On-Site Projects.
Portfolio Value by Month: This view shows how total project value changes month by month. It helps owners see whether the portfolio is growing, slowing, or becoming concentrated in certain periods.
Projects by Style: This view compares projects by design style. It helps studios understand whether demand is leaning toward a particular architectural or interior design direction.
Portfolio Value by Segment: This view breaks value across business or client segments. It helps teams identify which segments contribute the most to the current pipeline.
Projects by Delivery Status: This view groups projects by delivery status. It helps project managers spot how much work is active, completed, pending, or delayed.
Projects by Site Status: This view separates projects by site activity. It helps teams understand which projects are on-site and which are still in design, planning, or non-site phases.
Recent Projects by Date: This view highlights the latest project records by date. It makes recent updates visible without asking users to search the Data Sheet manually.
Architecture and Design Dashboard in Google Sheets
Page 2: Project Performance
The Project Performance tab focuses on status, pipeline movement, handover progress, and completion behavior. It is useful for weekly operations meetings, client delivery reviews, and project manager check-ins.Architecture and Design Dashboard in Google Sheets
Active Portfolio by Project Status: This view shows active portfolio value or workload by current project status. It helps identify whether the active portfolio is concentrated in one stage.Architecture and Design Dashboard in Google Sheets
Project Count by Month: This view tracks the number of projects over time. It helps studios understand project volume trends and seasonality.
Projects by Status: This view groups the full project list by status. It provides a quick view of active, done, hold, and other project categories.
Project Value by Pipeline Stage: This view compares project value across pipeline stages. It helps leaders see where revenue potential is sitting before delivery is complete.
Completion Rate by Delivery Status: This view connects completion rate with delivery status. It helps teams compare delivery progress across different status groups.
Projects by Handover Stage: This view groups projects by handover stage. It helps identify which projects are close to client delivery and which still need completion work.
Recent Projects by Date: This view keeps recent project movement visible. It is helpful when reviewing what changed since the last internal meeting.
Project Performance
Page 3: Client Insights
The Client Insights tab helps users understand the client side of the portfolio. It is especially useful for owners, business development leads, and account managers who want to see whether value is coming from corporate, government, or other client segments.
Corporate Value by Client Type: This view compares corporate value across client types. It helps teams understand which client groups are contributing the most corporate work.
Client Value by Month: This view shows client value over time. It helps identify months with stronger client contribution and periods that may need follow-up activity.
Projects by Client Type: This view counts projects by client type. It helps studios see whether their workload is balanced across client groups.
Client Value by Client Segment: This view compares value by client segment. It helps users identify high-value segments that deserve deeper relationship management.
Portfolio Value by Corporate Share: This view shows how portfolio value changes by corporate share. It helps owners understand how much of the portfolio is tied to corporate clients.
Projects by Government Work: This view separates projects based on government work. It helps firms monitor public-sector exposure and compare it with private client work.
Recent Projects by Date: This view shows newer project activity from the client perspective. It helps users connect recent records with the client mix.
Client Insights
Page 4: Team and Hours
The Team and Hours tab is built for resource review. It helps studio leads see where design hours are going, how work is distributed by discipline, and whether team capacity is aligned with current project demand.
Design Hours by Month: This view shows monthly design hours. It helps managers identify busy periods and plan future workload more carefully.
Hours by Discipline: This view compares hours across disciplines. It helps reveal whether architecture, interiors, planning, or other design work is consuming most of the team’s time.
Design Hours by Discipline: This view focuses on design-hour distribution by discipline. It helps teams understand which skills are most in demand.
Capacity by Team: This view compares capacity across teams. It supports staffing decisions when some groups are overloaded and others have room.
Architecture Load by Discipline: This view shows architecture workload by discipline. It helps leaders understand where architectural effort is concentrated.
Projects by Site Status: This view compares projects by site status from a workload angle. It helps teams see how much active site work may affect capacity.
Recent Projects by Date: This view keeps new or recently updated projects visible. It helps managers connect recent project movement to resource planning.
Team and Hours
Page 5: Budget and Billing
The Budget and Billing tab brings financial performance into the same reporting file. It helps owners and finance leads compare revenue, costs, value, margin, delivered work, and recent project activity.
Net Margin by Finance Summary: This view shows net margin by finance summary. It helps users understand whether the portfolio is producing healthy financial outcomes.
Revenue by Money Flow: This view compares revenue across money-flow categories. It helps identify how money is moving through the portfolio.
Cost by Month: This view tracks cost by month. It helps users see whether costs are rising during specific periods.
Value by Discipline: This view compares value across disciplines. It helps identify which design disciplines contribute the most value to the portfolio.
Margin by Portfolio: This view compares margin at the portfolio level. It helps owners see which parts of the portfolio are supporting profitability.
Delivered Value by Completion Status: This view connects delivered value with completion status. It helps teams see how much value is tied to completed or nearly completed work.
Recent Projects by Date: This view brings recent project records into the finance page. It helps teams connect new activity with billing and margin conversations.
Budget and Billing
Data Sheet
The Data Sheet is where users add architecture and design project records in the same format used by the dashboard. Keeping columns consistent is important because the dashboard pages, slicers, cards, and views rely on the structured data format.
Data Sheet tab
Architecture and Design Dashboard in Google Sheets vs. Microsoft Excel vs. Paid Project Management SaaS – Feature Comparison
| Feature | Architecture and Design Dashboard in Google Sheets | Microsoft Excel Dashboard | Paid Project Management SaaS |
|---|---|---|---|
| Cost | $9.99 one-time sale price | Template cost plus Excel access where needed | Monthly or annual subscription |
| Platform | Google Sheets in browser | Excel desktop or web | Vendor-hosted web platform |
| Setup time | Copy the sheet and replace sample rows | Open workbook and replace data | Configure workspace, users, permissions, and fields |
| Real-time team collaboration | Native Google Drive sharing | Available through Microsoft cloud sharing | Usually included by plan |
| Mobile access | Google Sheets app or browser | Excel app or browser | Vendor app or browser |
| Customizable fields | Editable sheet structure | Editable workbook structure | Limited by vendor configuration |
| Share with link | Yes, with permission controls | Yes, with compatible cloud storage | Usually account based |
| Year-1 cost at 5 users | $9.99 template price | Depends on existing licenses | Often a recurring team subscription |
| Architecture-specific reporting | Project, client, team, budget, billing, and data tabs included | Possible with custom setup | Varies by software plan |
Who Should Use This Template
This template is best for architecture firms, interior design studios, design consultants, project managers, project coordinators, and studio owners who already track work in spreadsheets and want a cleaner reporting layer. It is especially useful when a team needs to review project status, portfolio value, client mix, team capacity, and billing performance in one place.
It is not the right fit for teams that need automatic BIM integration, accounting software sync, resource approvals, client portals, proposal generation, or enterprise permissions. This is a dashboard template for structured project reporting, not a complete practice-management platform.
Real-World Use Cases
Studio owner review: A small architecture firm owner checks Portfolio Value, Active projects, On Hold work, Avg Fee, and Budget and Billing before a Monday management meeting.
Project manager delivery check: A project manager reviews Project Performance to compare delivery status, handover stage, project status, and completion rate before contacting clients.
Design operations planning: A design operations lead uses Team and Hours to compare discipline workload and capacity before assigning new work to architecture, interiors, or planning teams.
Advantages of Architecture and Design Dashboard in Google Sheets
- One file for multiple views: project, client, team, budget, billing, and data tracking live in the same template.
- Lower cost than SaaS: the $9.99 sale price is a one-time template purchase rather than a recurring per-user subscription.
- Easy collaboration: Google Sheets sharing makes it simple to give teammates view or edit access.
- Clear dashboard pages: each tab focuses on a specific management question instead of crowding every metric onto one page.
- Editable structure: teams can adapt labels and records if they understand the sheet formulas and dashboard references.
Opportunities for Improvement
- No automatic integrations: accounting systems, time-tracking tools, BIM systems, and CRM platforms do not sync automatically.
- Manual data quality matters: inconsistent status names, missing dates, and mixed currencies can reduce reporting quality.
- Not a workflow approval system: approvals, permissions, client portals, and automated notifications require separate tools or custom development.
Best Practices
- Keep the Data Sheet column headers and structure intact unless you are comfortable updating formulas and dashboard references.
- Use consistent naming for project status, delivery status, site status, client type, discipline, and style.
- Check dates and currency fields before using the dashboard for billing or margin review.
- Give most users viewer access and limit editor access to the people responsible for maintaining the data.
- Create a backup copy before making major structural changes to the workbook.
Explore Relevant Templates
Looking for more Google Sheets dashboards and project tracking templates? These related products may also help:
- Interior Design KPI Dashboard in Google Sheets
- Construction Project Cost Dashboard in Google Sheets
- Project Task Management Dashboard in Google Sheets
- Browse all Google Sheets dashboard templates
Frequently Asked Questions
What is the Architecture and Design Dashboard in Google Sheets?
It is a ready-to-use Google Sheets dashboard template for tracking architecture and design projects, portfolio value, client insights, team hours, budgets, billing, delivery status, and margins.
How many pages are included?
The template includes 6 working tabs: Overview, Project Performance, Client Insights, Team and Hours, Budget and Billing, and Data Sheet.
What KPIs are shown on the Overview page?
The Overview page includes Total, Active, Done, Hold, Portfolio Value, Projects, On Hold, Avg Fee, Status, Top Style, Currency, All-time delivery, and On-Site Projects.
Can I add my own project records?
Yes. Add your records into the Data Sheet using the same structure as the sample data so the dashboard pages continue to update correctly.
Does this template automatically connect to accounting or project management tools?
No. The template is designed for manual entry or pasted/exported data. Automatic integrations are not included.
Can multiple users work with the dashboard?
Yes. Since it is built in Google Sheets, you can share the file through Google Drive with viewer, commenter, or editor permissions.
Who is this dashboard best for?
It is best for architecture firms, interior design studios, project managers, consultants, and design operations teams that need practical portfolio and project reporting in Google Sheets.
About the Author
Built by PK – Microsoft Certified Professional with 15+ years of Excel, Google Sheets, and Power BI experience. Founder of NextGenTemplates, reaching 300K+ subscribers across YouTube channels. Every template is hand-built and tested before release.
The Architecture and Design Dashboard in Google Sheets is a ready-to-use reporting template for studios that need project, client, team, budget, billing, and portfolio visibility in one editable spreadsheet. The file includes 6 working tabs, 5 dashboard pages, 13 overview KPI cards, and 34 analysis views, giving architecture firms and design teams a cleaner way to review work without building a dashboard from scratch.
This dashboard is built for teams that already keep project data in spreadsheets, exported reports, or manual trackers. Instead of jumping between separate project status lists, billing files, client summaries, and timesheet views, you can add records into the Data Sheet and review the full picture from the dashboard tabs. Because it is built in Google Sheets, it also supports familiar sharing and collaboration workflows through Google Drive. Google provides more details on Sheets collaboration in its official Google Docs Editors Help guide.
Click here to purchase the Architecture and Design Dashboard in Google Sheets
Key Features of Architecture and Design Dashboard in Google Sheets
- 6 connected sheet tabs covering Overview, Project Performance, Client Insights, Team and Hours, Budget and Billing, and Data Sheet.Architecture and Design Dashboard in Google Sheets
- 13 overview cards for Total, Active, Done, Hold, Portfolio Value, Projects, On Hold, Avg Fee, Status, Top Style, Currency, All-time delivery, and On-Site Projects.
- 34 analysis views for project status, pipeline stage, delivery status, handover stage, client type, client segment, design hours, team capacity, revenue, cost, and margin.
- Slicers and filters help users focus the dashboard by project, client, date, status, design style, site status, discipline, and finance-related fields where available.
- Editable data structure lets teams replace sample records with real architecture and design project data.
- Google Sheets format makes it suitable for teams that want a shareable file instead of a locked reporting system.
Dashboard Pages Explanation
The dashboard is organized into focused pages so users can start with a high-level view and then move into project, client, team, and finance analysis. Each page has its own purpose, but the structure stays consistent so users can move through the file quickly during review meetings.
Page 1: Overview
The Overview page is the executive summary for the architecture and design portfolio. At the top, KPI cards show Total, Active, Done, Hold, Portfolio Value, Projects, On Hold, Avg Fee, Status, Top Style, Currency, All-time delivery, and On-Site Projects.Architecture and Design Dashboard in Google Sheets
Portfolio Value by Month: This view shows how total project value changes month by month. It helps owners see whether the portfolio is growing, slowing, or becoming concentrated in certain periods.
Projects by Style: This view compares projects by design style. It helps studios understand whether demand is leaning toward a particular architectural or interior design direction.
Portfolio Value by Segment: This view breaks value across business or client segments. It helps teams identify which segments contribute the most to the current pipeline.
Projects by Delivery Status: This view groups projects by delivery status. It helps project managers spot how much work is active, completed, pending, or delayed.
Projects by Site Status: This view separates projects by site activity. It helps teams understand which projects are on-site and which are still in design, planning, or non-site phases.
Recent Projects by Date: This view highlights the latest project records by date. It makes recent updates visible without asking users to search the Data Sheet manually.
Architecture and Design Dashboard in Google Sheets
Page 2: Project Performance
The Project Performance tab focuses on status, pipeline movement, handover progress, and completion behavior. It is useful for weekly operations meetings, client delivery reviews, and project manager check-ins.
Active Portfolio by Project Status: This view shows active portfolio value or workload by current project status. It helps identify whether the active portfolio is concentrated in one stage.
Project Count by Month: This view tracks the number of projects over time. It helps studios understand project volume trends and seasonality.
Projects by Status: This view groups the full project list by status. It provides a quick view of active, done, hold, and other project categories.
Project Value by Pipeline Stage: This view compares project value across pipeline stages. It helps leaders see where revenue potential is sitting before delivery is complete.
Completion Rate by Delivery Status: This view connects completion rate with delivery status. It helps teams compare delivery progress across different status groups.
Projects by Handover Stage: This view groups projects by handover stage. It helps identify which projects are close to client delivery and which still need completion work.
Recent Projects by Date: This view keeps recent project movement visible. It is helpful when reviewing what changed since the last internal meeting.
Project Performance
Page 3: Client Insights
The Client Insights tab helps users understand the client side of the portfolio. It is especially useful for owners, business development leads, and account managers who want to see whether value is coming from corporate, government, or other client segments.
Corporate Value by Client Type: This view compares corporate value across client types. It helps teams understand which client groups are contributing the most corporate work.
Client Value by Month: This view shows client value over time. It helps identify months with stronger client contribution and periods that may need follow-up activity.
Projects by Client Type: This view counts projects by client type. It helps studios see whether their workload is balanced across client groups.
Client Value by Client Segment: This view compares value by client segment. It helps users identify high-value segments that deserve deeper relationship management.
Portfolio Value by Corporate Share: This view shows how portfolio value changes by corporate share. It helps owners understand how much of the portfolio is tied to corporate clients.
Projects by Government Work: This view separates projects based on government work. It helps firms monitor public-sector exposure and compare it with private client work.
Recent Projects by Date: This view shows newer project activity from the client perspective. It helps users connect recent records with the client mix.
Client Insights
Page 4: Team and Hours
The Team and Hours tab is built for resource review. It helps studio leads see where design hours are going, how work is distributed by discipline, and whether team capacity is aligned with current project demand.
Design Hours by Month: This view shows monthly design hours. It helps managers identify busy periods and plan future workload more carefully.
Hours by Discipline: This view compares hours across disciplines. It helps reveal whether architecture, interiors, planning, or other design work is consuming most of the team’s time.
Design Hours by Discipline: This view focuses on design-hour distribution by discipline. It helps teams understand which skills are most in demand.
Capacity by Team: This view compares capacity across teams. It supports staffing decisions when some groups are overloaded and others have room.
Architecture Load by Discipline: This view shows architecture workload by discipline. It helps leaders understand where architectural effort is concentrated.
Projects by Site Status: This view compares projects by site status from a workload angle. It helps teams see how much active site work may affect capacity.
Recent Projects by Date: This view keeps new or recently updated projects visible. It helps managers connect recent project movement to resource planning.
Team and Hours
Page 5: Budget and Billing
The Budget and Billing tab brings financial performance into the same reporting file. It helps owners and finance leads compare revenue, costs, value, margin, delivered work, and recent project activity.
Net Margin by Finance Summary: This view shows net margin by finance summary. It helps users understand whether the portfolio is producing healthy financial outcomes.
Revenue by Money Flow: This view compares revenue across money-flow categories. It helps identify how money is moving through the portfolio.
Cost by Month: This view tracks cost by month. It helps users see whether costs are rising during specific periods.
Value by Discipline: This view compares value across disciplines. It helps identify which design disciplines contribute the most value to the portfolio.
Margin by Portfolio: This view compares margin at the portfolio level. It helps owners see which parts of the portfolio are supporting profitability.
Delivered Value by Completion Status: This view connects delivered value with completion status. It helps teams see how much value is tied to completed or nearly completed work.
Recent Projects by Date: This view brings recent project records into the finance page. It helps teams connect new activity with billing and margin conversations.
Budget and Billing
Data Sheet
The Data Sheet is where users add architecture and design project records in the same format used by the dashboard. Keeping columns consistent is important because the dashboard pages, slicers, cards, and views rely on the structured data format.
Data Sheet tab
Architecture and Design Dashboard in Google Sheets vs. Microsoft Excel vs. Paid Project Management SaaS – Feature Comparison
| Feature | Architecture and Design Dashboard in Google Sheets | Microsoft Excel Dashboard | Paid Project Management SaaS |
|---|---|---|---|
| Cost | $9.99 one-time sale price | Template cost plus Excel access where needed | Monthly or annual subscription |
| Platform | Google Sheets in browser | Excel desktop or web | Vendor-hosted web platform |
| Setup time | Copy the sheet and replace sample rows | Open workbook and replace data | Configure workspace, users, permissions, and fields |
| Real-time team collaboration | Native Google Drive sharing | Available through Microsoft cloud sharing | Usually included by plan |
| Mobile access | Google Sheets app or browser | Excel app or browser | Vendor app or browser |
| Customizable fields | Editable sheet structure | Editable workbook structure | Limited by vendor configuration |
| Share with link | Yes, with permission controls | Yes, with compatible cloud storage | Usually account based |
| Year-1 cost at 5 users | $9.99 template price | Depends on existing licenses | Often a recurring team subscription |
| Architecture-specific reporting | Project, client, team, budget, billing, and data tabs included | Possible with custom setup | Varies by software plan |
Who Should Use This Template
This template is best for architecture firms, interior design studios, design consultants, project managers, project coordinators, and studio owners who already track work in spreadsheets and want a cleaner reporting layer. It is especially useful when a team needs to review project status, portfolio value, client mix, team capacity, and billing performance in one place.
It is not the right fit for teams that need automatic BIM integration, accounting software sync, resource approvals, client portals, proposal generation, or enterprise permissions. This is a dashboard template for structured project reporting, not a complete practice-management platform.
Real-World Use Cases
Studio owner review: A small architecture firm owner checks Portfolio Value, Active projects, On Hold work, Avg Fee, and Budget and Billing before a Monday management meeting.
Project manager delivery check: A project manager reviews Project Performance to compare delivery status, handover stage, project status, and completion rate before contacting clients.
Design operations planning: A design operations lead uses Team and Hours to compare discipline workload and capacity before assigning new work to architecture, interiors, or planning teams.
Advantages of Architecture and Design Dashboard in Google Sheets
- One file for multiple views: project, client, team, budget, billing, and data tracking live in the same template.
- Lower cost than SaaS: the $9.99 sale price is a one-time template purchase rather than a recurring per-user subscription.
- Easy collaboration: Google Sheets sharing makes it simple to give teammates view or edit access.
- Clear dashboard pages: each tab focuses on a specific management question instead of crowding every metric onto one page.
- Editable structure: teams can adapt labels and records if they understand the sheet formulas and dashboard references.
Opportunities for Improvement
- No automatic integrations: accounting systems, time-tracking tools, BIM systems, and CRM platforms do not sync automatically.
- Manual data quality matters: inconsistent status names, missing dates, and mixed currencies can reduce reporting quality.
- Not a workflow approval system: approvals, permissions, client portals, and automated notifications require separate tools or custom development.
Best Practices
- Keep the Data Sheet column headers and structure intact unless you are comfortable updating formulas and dashboard references.
- Use consistent naming for project status, delivery status, site status, client type, discipline, and style.
- Check dates and currency fields before using the dashboard for billing or margin review.
- Give most users viewer access and limit editor access to the people responsible for maintaining the data.
- Create a backup copy before making major structural changes to the workbook.
Explore Relevant Templates
Looking for more Google Sheets dashboards and project tracking templates? These related products may also help:
- Interior Design KPI Dashboard in Google Sheets
- Construction Project Cost Dashboard in Google Sheets
- Project Task Management Dashboard in Google Sheets
- Browse all Google Sheets dashboard templates
Frequently Asked Questions
What is the Architecture and Design Dashboard in Google Sheets?
It is a ready-to-use Google Sheets dashboard template for tracking architecture and design projects, portfolio value, client insights, team hours, budgets, billing, delivery status, and margins.
How many pages are included?
The template includes 6 working tabs: Overview, Project Performance, Client Insights, Team and Hours, Budget and Billing, and Data Sheet.
What KPIs are shown on the Overview page?
The Overview page includes Total, Active, Done, Hold, Portfolio Value, Projects, On Hold, Avg Fee, Status, Top Style, Currency, All-time delivery, and On-Site Projects.
Can I add my own project records?
Yes. Add your records into the Data Sheet using the same structure as the sample data so the dashboard pages continue to update correctly.
Does this template automatically connect to accounting or project management tools?
No. The template is designed for manual entry or pasted/exported data. Automatic integrations are not included.
Can multiple users work with the dashboard?
Yes. Since it is built in Google Sheets, you can share the file through Google Drive with viewer, commenter, or editor permissions.
Who is this dashboard best for?
It is best for architecture firms, interior design studios, project managers, consultants, and design operations teams that need practical portfolio and project reporting in Google Sheets.
About the Author
Built by PK – Microsoft Certified Professional with 15+ years of Excel, Google Sheets, and Power BI experience. Founder of NextGenTemplates, reaching 300K+ subscribers across YouTube channels. Every template is hand-built and tested before release.
Conclusion
The Architecture and Design Dashboard in Google Sheets gives design teams a practical way to review portfolio value, project performance, client mix, team hours, budget movement, billing, and margin without starting from a blank spreadsheet. It is simple enough for spreadsheet users and structured enough for recurring business reviews.
Download the Architecture and Design Dashboard in Google Sheets from NextGenTemplates and start turning architecture project records into clearer decisions.
Visit our YouTube channel for dashboard walkthroughs and tutorials: YouTube.com/@NextGenTemplates
Conclusion
The Architecture and Design Dashboard in Google Sheets gives design teams a practical way to review portfolio value, project performance, client mix, team hours, budget movement, billing, and margin without starting from a blank spreadsheet. It is simple enough for spreadsheet users and structured enough for recurring business reviews.
Download the Architecture and Design Dashboard in Google Sheets from NextGenTemplates and start turning architecture project records into clearer decisions.
Visit our YouTube channel for dashboard walkthroughs and tutorials: YouTube.com/@NextGenTemplates
Advantages of Architecture and Design Dashboard in Google Sheets
- One file for multiple views: project, client, team, budget, billing, and data tracking live in the same template.
- Lower cost than SaaS: the $9.99 sale price is a one-time template purchase rather than a recurring per-user subscription.
- Easy collaboration: Google Sheets sharing makes it simple to give teammates view or edit access.
- Clear dashboard pages: each tab focuses on a specific management question instead of crowding every metric onto one page.
- Editable structure: teams can adapt labels and records if they understand the sheet formulas and dashboard references.
Opportunities for Improvement
- No automatic integrations: accounting systems, time-tracking tools, BIM systems, and CRM platforms do not sync automatically.
- Manual data quality matters: inconsistent status names, missing dates, and mixed currencies can reduce reporting quality.
- Not a workflow approval system: approvals, permissions, client portals, and automated notifications require separate tools or custom development.
Best Practices
- Keep the Data Sheet column headers and structure intact unless you are comfortable updating formulas and dashboard references.
- Use consistent naming for project status, delivery status, site status, client type, discipline, and style.
- Check dates and currency fields before using the dashboard for billing or margin review.
- Give most users viewer access and limit editor access to the people responsible for maintaining the data.
- Create a backup copy before making major structural changes to the workbook.
Explore Relevant Templates
Looking for more Google Sheets dashboards and project tracking templates? These related products may also help:
The Architecture and Design Dashboard in Google Sheets is a ready-to-use reporting template for studios that need project, client, team, budget, billing, and portfolio visibility in one editable spreadsheet. The file includes 6 working tabs, 5 dashboard pages, 13 overview KPI cards, and 34 analysis views, giving architecture firms and design teams a cleaner way to review work without building a dashboard from scratch.
This dashboard is built for teams that already keep project data in spreadsheets, exported reports, or manual trackers. Instead of jumping between separate project status lists, billing files, client summaries, and timesheet views, you can add records into the Data Sheet and review the full picture from the dashboard tabs. Because it is built in Google Sheets, it also supports familiar sharing and collaboration workflows through Google Drive. Google provides more details on Sheets collaboration in its official Google Docs Editors Help guide.
Click here to purchase the Architecture and Design Dashboard in Google Sheets
Key Features of Architecture and Design Dashboard in Google Sheets
- 6 connected sheet tabs covering Overview, Project Performance, Client Insights, Team and Hours, Budget and Billing, and Data Sheet.
- 13 overview cards for Total, Active, Done, Hold, Portfolio Value, Projects, On Hold, Avg Fee, Status, Top Style, Currency, All-time delivery, and On-Site Projects.
- 34 analysis views for project status, pipeline stage, delivery status, handover stage, client type, client segment, design hours, team capacity, revenue, cost, and margin.
- Slicers and filters help users focus the dashboard by project, client, date, status, design style, site status, discipline, and finance-related fields where available.
- Editable data structure lets teams replace sample records with real architecture and design project data.
- Google Sheets format makes it suitable for teams that want a shareable file instead of a locked reporting system.
Dashboard Pages Explanation
The dashboard is organized into focused pages so users can start with a high-level view and then move into project, client, team, and finance analysis. Each page has its own purpose, but the structure stays consistent so users can move through the file quickly during review meetings.
Page 1: Overview
The Overview page is the executive summary for the architecture and design portfolio. At the top, KPI cards show Total, Active, Done, Hold, Portfolio Value, Projects, On Hold, Avg Fee, Status, Top Style, Currency, All-time delivery, and On-Site Projects.
Portfolio Value by Month: This view shows how total project value changes month by month. It helps owners see whether the portfolio is growing, slowing, or becoming concentrated in certain periods.
Projects by Style: This view compares projects by design style. It helps studios understand whether demand is leaning toward a particular architectural or interior design direction.
Portfolio Value by Segment: This view breaks value across business or client segments. It helps teams identify which segments contribute the most to the current pipeline.
Projects by Delivery Status: This view groups projects by delivery status. It helps project managers spot how much work is active, completed, pending, or delayed.
Projects by Site Status: This view separates projects by site activity. It helps teams understand which projects are on-site and which are still in design, planning, or non-site phases.
Recent Projects by Date: This view highlights the latest project records by date. It makes recent updates visible without asking users to search the Data Sheet manually.
Architecture and Design Dashboard in Google Sheets
Page 2: Project Performance
The Project Performance tab focuses on status, pipeline movement, handover progress, and completion behavior. It is useful for weekly operations meetings, client delivery reviews, and project manager check-ins.
Active Portfolio by Project Status: This view shows active portfolio value or workload by current project status. It helps identify whether the active portfolio is concentrated in one stage.
Project Count by Month: This view tracks the number of projects over time. It helps studios understand project volume trends and seasonality.
Projects by Status: This view groups the full project list by status. It provides a quick view of active, done, hold, and other project categories.
Project Value by Pipeline Stage: This view compares project value across pipeline stages. It helps leaders see where revenue potential is sitting before delivery is complete.
Completion Rate by Delivery Status: This view connects completion rate with delivery status. It helps teams compare delivery progress across different status groups.Architecture and Design Dashboard in Google Sheets
Projects by Handover Stage: This view groups projects by handover stage. It helps identify which projects are close to client delivery and which still need completion work.
Recent Projects by Date: This view keeps recent project movement visible. It is helpful when reviewing what changed since the last internal meeting.
Project Performance
Page 3: Client Insights
The Client Insights tab helps users understand the client side of the portfolio. It is especially useful for owners, business development leads, and account managers who want to see whether value is coming from corporate, government, or other client segments.
Corporate Value by Client Type: This view compares corporate value across client types. It helps teams understand which client groups are contributing the most corporate work.
Client Value by Month: This view shows client value over time. It helps identify months with stronger client contribution and periods that may need follow-up activity.
Projects by Client Type: This view counts projects by client type. It helps studios see whether their workload is balanced across client groups.
Client Value by Client Segment: This view compares value by client segment. It helps users identify high-value segments that deserve deeper relationship management.
Portfolio Value by Corporate Share: This view shows how portfolio value changes by corporate share. It helps owners understand how much of the portfolio is tied to corporate clients.
Projects by Government Work: This view separates projects based on government work. It helps firms monitor public-sector exposure and compare it with private client work.
Recent Projects by Date: This view shows newer project activity from the client perspective. It helps users connect recent records with the client mix.
Client Insights
Page 4: Team and Hours
The Team and Hours tab is built for resource review. It helps studio leads see where design hours are going, how work is distributed by discipline, and whether team capacity is aligned with current project demand.
Design Hours by Month: This view shows monthly design hours. It helps managers identify busy periods and plan future workload more carefully.
Hours by Discipline: This view compares hours across disciplines. It helps reveal whether architecture, interiors, planning, or other design work is consuming most of the team’s time.
Design Hours by Discipline: This view focuses on design-hour distribution by discipline. It helps teams understand which skills are most in demand.
Capacity by Team: This view compares capacity across teams. It supports staffing decisions when some groups are overloaded and others have room.
The Architecture and Design Dashboard in Google Sheets is a ready-to-use reporting template for studios that need project, client, team, budget, billing, and portfolio visibility in one editable spreadsheet. The file includes 6 working tabs, 5 dashboard pages, 13 overview KPI cards, and 34 analysis views, giving architecture firms and design teams a cleaner way to review work without building a dashboard from scratch.
This dashboard is built for teams that already keep project data in spreadsheets, exported reports, or manual trackers. Instead of jumping between separate project status lists, billing files, client summaries, and timesheet views, you can add records into the Data Sheet and review the full picture from the dashboard tabs. Because it is built in Google Sheets, it also supports familiar sharing and collaboration workflows through Google Drive. Google provides more details on Sheets collaboration in its official Google Docs Editors Help guide.
Click here to purchase the Architecture and Design Dashboard in Google Sheets
Key Features of Architecture and Design Dashboard in Google Sheets
- 6 connected sheet tabs covering Overview, Project Performance, Client Insights, Team and Hours, Budget and Billing, and Data Sheet.
- 13 overview cards for Total, Active, Done, Hold, Portfolio Value, Projects, On Hold, Avg Fee, Status, Top Style, Currency, All-time delivery, and On-Site Projects.
- 34 analysis views for project status, pipeline stage, delivery status, handover stage, client type, client segment, design hours, team capacity, revenue, cost, and margin.
- Slicers and filters help users focus the dashboard by project, client, date, status, design style, site status, discipline, and finance-related fields where available.
- Editable data structure lets teams replace sample records with real architecture and design project data.
- Google Sheets format makes it suitable for teams that want a shareable file instead of a locked reporting system.
Dashboard Pages Explanation
The dashboard is organized into focused pages so users can start with a high-level view and then move into project, client, team, and finance analysis. Each page has its own purpose, but the structure stays consistent so users can move through the file quickly during review meetings.
Page 1: Overview
The Overview page is the executive summary for the architecture and design portfolio. At the top, KPI cards show Total, Active, Done, Hold, Portfolio Value, Projects, On Hold, Avg Fee, Status, Top Style, Currency, All-time delivery, and On-Site Projects.
Portfolio Value by Month: This view shows how total project value changes month by month. It helps owners see whether the portfolio is growing, slowing, or becoming concentrated in certain periods.
Projects by Style: This view compares projects by design style. It helps studios understand whether demand is leaning toward a particular architectural or interior design direction.
Portfolio Value by Segment: This view breaks value across business or client segments. It helps teams identify which segments contribute the most to the current pipeline.
Projects by Delivery Status: This view groups projects by delivery status. It helps project managers spot how much work is active, completed, pending, or delayed.
Projects by Site Status: This view separates projects by site activity. It helps teams understand which projects are on-site and which are still in design, planning, or non-site phases.
Recent Projects by Date: This view highlights the latest project records by date. It makes recent updates visible without asking users to search the Data Sheet manually.
Architecture and Design Dashboard in Google Sheets
Page 2: Project Performance
The Project Performance tab focuses on status, pipeline movement, handover progress, and completion behavior. It is useful for weekly operations meetings, client delivery reviews, and project manager check-ins.
Active Portfolio by Project Status: This view shows active portfolio value or workload by current project status. It helps identify whether the active portfolio is concentrated in one stage.
Project Count by Month: This view tracks the number of projects over time. It helps studios understand project volume trends and seasonality.
Projects by Status: This view groups the full project list by status. It provides a quick view of active, done, hold, and other project categories.
Project Value by Pipeline Stage: This view compares project value across pipeline stages. It helps leaders see where revenue potential is sitting before delivery is complete.
Completion Rate by Delivery Status: This view connects completion rate with delivery status. It helps teams compare delivery progress across different status groups.
Projects by Handover Stage: This view groups projects by handover stage. It helps identify which projects are close to client delivery and which still need completion work.
Recent Projects by Date: This view keeps recent project movement visible. It is helpful when reviewing what changed since the last internal meeting.
Project Performance
Page 3: Client Insights
The Client Insights tab helps users understand the client side of the portfolio. It is especially useful for owners, business development leads, and account managers who want to see whether value is coming from corporate, government, or other client segments.
Corporate Value by Client Type: This view compares corporate value across client types. It helps teams understand which client groups are contributing the most corporate work.
Client Value by Month: This view shows client value over time. It helps identify months with stronger client contribution and periods that may need follow-up activity.
Projects by Client Type: This view counts projects by client type. It helps studios see whether their workload is balanced across client groups.
Client Value by Client Segment: This view compares value by client segment. It helps users identify high-value segments that deserve deeper relationship management.
Portfolio Value by Corporate Share: This view shows how portfolio value changes by corporate share. It helps owners understand how much of the portfolio is tied to corporate clients.
Projects by Government Work: This view separates projects based on government work. It helps firms monitor public-sector exposure and compare it with private client work.
Recent Projects by Date: This view shows newer project activity from the client perspective. It helps users connect recent records with the client mix.
Client Insights
Page 4: Team and Hours
The Team and Hours tab is built for resource review. It helps studio leads see where design hours are going, how work is distributed by discipline, and whether team capacity is aligned with current project demand.
Design Hours by Month: This view shows monthly design hours. It helps managers identify busy periods and plan future workload more carefully.
Hours by Discipline: This view compares hours across disciplines. It helps reveal whether architecture, interiors, planning, or other design work is consuming most of the team’s time.
Design Hours by Discipline: This view focuses on design-hour distribution by discipline. It helps teams understand which skills are most in demand.
Capacity by Team: This view compares capacity across teams. It supports staffing decisions when some groups are overloaded and others have room.
Architecture Load by Discipline: This view shows architecture workload by discipline. It helps leaders understand where architectural effort is concentrated.
Projects by Site Status: This view compares projects by site status from a workload angle. It helps teams see how much active site work may affect capacity.
Recent Projects by Date: This view keeps new or recently updated projects visible. It helps managers connect recent project movement to resource planning.Architecture and Design Dashboard in Google Sheets
Team and Hours
Page 5: Budget and Billing
The Budget and Billing tab brings financial performance into the same reporting file. It helps owners and finance leads compare revenue, costs, value, margin, delivered work, and recent project activity.
Net Margin by Finance Summary: This view shows net margin by finance summary. It helps users understand whether the portfolio is producing healthy financial outcomes.
Revenue by Money Flow: This view compares revenue across money-flow categories. It helps identify how money is moving through the portfolio.
Cost by Month: This view tracks cost by month. It helps users see whether costs are rising during specific periods.
Value by Discipline: This view compares value across disciplines. It helps identify which design disciplines contribute the most value to the portfolio.
Margin by Portfolio: This view compares margin at the portfolio level. It helps owners see which parts of the portfolio are supporting profitability.
Delivered Value by Completion Status: This view connects delivered value with completion status. It helps teams see how much value is tied to completed or nearly completed work.
Recent Projects by Date: This view brings recent project records into the finance page. It helps teams connect new activity with billing and margin conversations.
Budget and Billing
Data Sheet
The Data Sheet is where users add architecture and design project records in the same format used by the dashboard. Keeping columns consistent is important because the dashboard pages, slicers, cards, and views rely on the structured data format.
Data Sheet tab
Architecture and Design Dashboard in Google Sheets vs. Microsoft Excel vs. Paid Project Management SaaS – Feature Comparison
| Feature | Architecture and Design Dashboard in Google Sheets | Microsoft Excel Dashboard | Paid Project Management SaaS |
|---|---|---|---|
| Cost | $9.99 one-time sale price | Template cost plus Excel access where needed | Monthly or annual subscription |
| Platform | Google Sheets in browser | Excel desktop or web | Vendor-hosted web platform |
| Setup time | Copy the sheet and replace sample rows | Open workbook and replace data | Configure workspace, users, permissions, and fields |
| Real-time team collaboration | Native Google Drive sharing | Available through Microsoft cloud sharing | Usually included by plan |
| Mobile access | Google Sheets app or browser | Excel app or browser | Vendor app or browser |
| Customizable fields | Editable sheet structure | Editable workbook structure | Limited by vendor configuration |
| Share with link | Yes, with permission controls | Yes, with compatible cloud storage | Usually account based |
| Year-1 cost at 5 users | $9.99 template price | Depends on existing licenses | Often a recurring team subscription |
| Architecture-specific reporting | Project, client, team, budget, billing, and data tabs included | Possible with custom setup | Varies by software plan |
Who Should Use This Template
This template is best for architecture firms, interior design studios, design consultants, project managers, project coordinators, and studio owners who already track work in spreadsheets and want a cleaner reporting layer. It is especially useful when a team needs to review project status, portfolio value, client mix, team capacity, and billing performance in one place.
It is not the right fit for teams that need automatic BIM integration, accounting software sync, resource approvals, client portals, proposal generation, or enterprise permissions. This is a dashboard template for structured project reporting, not a complete practice-management platform.
Real-World Use Cases
Studio owner review: A small architecture firm owner checks Portfolio Value, Active projects, On Hold work, Avg Fee, and Budget and Billing before a Monday management meeting.
Project manager delivery check: A project manager reviews Project Performance to compare delivery status, handover stage, project status, and completion rate before contacting clients.
Design operations planning: A design operations lead uses Team and Hours to compare discipline workload and capacity before assigning new work to architecture, interiors, or planning teams.
Advantages of Architecture and Design Dashboard in Google Sheets
- One file for multiple views: project, client, team, budget, billing, and data tracking live in the same template.
- Lower cost than SaaS: the $9.99 sale price is a one-time template purchase rather than a recurring per-user subscription.
- Easy collaboration: Google Sheets sharing makes it simple to give teammates view or edit access.
- Clear dashboard pages: each tab focuses on a specific management question instead of crowding every metric onto one page.
- Editable structure: teams can adapt labels and records if they understand the sheet formulas and dashboard references.
Opportunities for Improvement
- No automatic integrations: accounting systems, time-tracking tools, BIM systems, and CRM platforms do not sync automatically.
- Manual data quality matters: inconsistent status names, missing dates, and mixed currencies can reduce reporting quality.Architecture and Design Dashboard in Google Sheets
- Not a workflow approval system: approvals, permissions, client portals, and automated notifications require separate tools or custom development.Architecture and Design Dashboard in Google Sheets
Best Practices
- Keep the Data Sheet column headers and structure intact unless you are comfortable updating formulas and dashboard references.
- Use consistent naming for project status, delivery status, site status, client type, discipline, and style.
- Check dates and currency fields before using the dashboard for billing or margin review.
- Give most users viewer access and limit editor access to the people responsible for maintaining the data.
- Create a backup copy before making major structural changes to the workbook.
Explore Relevant Templates
Looking for more Google Sheets dashboards and project tracking templates? These related products may also help:
- Interior Design KPI Dashboard in Google Sheets
- Construction Project Cost Dashboard in Google Sheets
- Project Task Management Dashboard in Google Sheets
- Browse all Google Sheets dashboard templates
Frequently Asked Questions
What is the Architecture and Design Dashboard in Google Sheets?
It is a ready-to-use Google Sheets dashboard template for tracking architecture and design projects, portfolio value, client insights, team hours, budgets, billing, delivery status, and margins.
How many pages are included?
The template includes 6 working tabs: Overview, Project Performance, Client Insights, Team and Hours, Budget and Billing, and Data Sheet.
What KPIs are shown on the Overview page?
The Overview page includes Total, Active, Done, Hold, Portfolio Value, Projects, On Hold, Avg Fee, Status, Top Style, Currency, All-time delivery, and On-Site Projects.
Can I add my own project records?
Yes. Add your records into the Data Sheet using the same structure as the sample data so the dashboard pages continue to update correctly.
Does this template automatically connect to accounting or project management tools?
No. The template is designed for manual entry or pasted/exported data. Automatic integrations are not included.
Can multiple users work with the dashboard?
Yes. Since it is built in Google Sheets, you can share the file through Google Drive with viewer, commenter, or editor permissions.
Who is this dashboard best for?
It is best for architecture firms, interior design studios, project managers, consultants, and design operations teams that need practical portfolio and project reporting in Google Sheets.
About the Author
Built by PK – Microsoft Certified Professional with 15+ years of Excel, Google Sheets, and Power BI experience. Founder of NextGenTemplates, reaching 300K+ subscribers across YouTube channels. Every template is hand-built and tested before release.
Conclusion
The Architecture and Design Dashboard in Google Sheets gives design teams a practical way to review portfolio value, project performance, client mix, team hours, budget movement, billing, and margin without starting from a blank spreadsheet. It is simple enough for spreadsheet users and structured enough for recurring business reviews.
The Architecture and Design Dashboard in Google Sheets is a ready-to-use reporting template for studios that need project, client, team, budget, billing, and portfolio visibility in one editable spreadsheet. The file includes 6 working tabs, 5 dashboard pages, 13 overview KPI cards, and 34 analysis views, giving architecture firms and design teams a cleaner way to review work without building a dashboard from scratch.
This dashboard is built for teams that already keep project data in spreadsheets, exported reports, or manual trackers. Instead of jumping between separate project status lists, billing files, client summaries, and timesheet views, you can add records into the Data Sheet and review the full picture from the dashboard tabs. Because it is built in Google Sheets, it also supports familiar sharing and collaboration workflows through Google Drive. Google provides more details on Sheets collaboration in its official Google Docs Editors Help guide.
Click here to purchase the Architecture and Design Dashboard in Google Sheets
Key Features of Architecture and Design Dashboard in Google Sheets
- 6 connected sheet tabs covering Overview, Project Performance, Client Insights, Team and Hours, Budget and Billing, and Data Sheet.
- 13 overview cards for Total, Active, Done, Hold, Portfolio Value, Projects, On Hold, Avg Fee, Status, Top Style, Currency, All-time delivery, and On-Site Projects.
- 34 analysis views for project status, pipeline stage, delivery status, handover stage, client type, client segment, design hours, team capacity, revenue, cost, and margin.
- Slicers and filters help users focus the dashboard by project, client, date, status, design style, site status, discipline, and finance-related fields where available.
- Editable data structure lets teams replace sample records with real architecture and design project data.
- Google Sheets format makes it suitable for teams that want a shareable file instead of a locked reporting system.
Dashboard Pages Explanation
The dashboard is organized into focused pages so users can start with a high-level view and then move into project, client, team, and finance analysis. Each page has its own purpose, but the structure stays consistent so users can move through the file quickly during review meetings.
Page 1: Overview
The Overview page is the executive summary for the architecture and design portfolio. At the top, KPI cards show Total, Active, Done, Hold, Portfolio Value, Projects, On Hold, Avg Fee, Status, Top Style, Currency, All-time delivery, and On-Site Projects.
Portfolio Value by Month: This view shows how total project value changes month by month. It helps owners see whether the portfolio is growing, slowing, or becoming concentrated in certain periods.
Projects by Style: This view compares projects by design style. It helps studios understand whether demand is leaning toward a particular architectural or interior design direction.
Portfolio Value by Segment: This view breaks value across business or client segments. It helps teams identify which segments contribute the most to the current pipeline.
Projects by Delivery Status: This view groups projects by delivery status. It helps project managers spot how much work is active, completed, pending, or delayed.
Projects by Site Status: This view separates projects by site activity. It helps teams understand which projects are on-site and which are still in design, planning, or non-site phases.
Recent Projects by Date: This view highlights the latest project records by date. It makes recent updates visible without asking users to search the Data Sheet manually.
Architecture and Design Dashboard in Google Sheets
Page 2: Project Performance
The Project Performance tab focuses on status, pipeline movement, handover progress, and completion behavior. It is useful for weekly operations meetings, client delivery reviews, and project manager check-ins.
Active Portfolio by Project Status: This view shows active portfolio value or workload by current project status. It helps identify whether the active portfolio is concentrated in one stage.
Project Count by Month: This view tracks the number of projects over time. It helps studios understand project volume trends and seasonality.
Projects by Status: This view groups the full project list by status. It provides a quick view of active, done, hold, and other project categories.
Project Value by Pipeline Stage: This view compares project value across pipeline stages. It helps leaders see where revenue potential is sitting before delivery is complete.
Completion Rate by Delivery Status: This view connects completion rate with delivery status. It helps teams compare delivery progress across different status groups.
Projects by Handover Stage: This view groups projects by handover stage. It helps identify which projects are close to client delivery and which still need completion work.
Recent Projects by Date: This view keeps recent project movement visible. It is helpful when reviewing what changed since the last internal meeting.
Project Performance
Page 3: Client Insights
The Client Insights tab helps users understand the client side of the portfolio. It is especially useful for owners, business development leads, and account managers who want to see whether value is coming from corporate, government, or other client segments.
Corporate Value by Client Type: This view compares corporate value across client types. It helps teams understand which client groups are contributing the most corporate work.
Client Value by Month: This view shows client value over time. It helps identify months with stronger client contribution and periods that may need follow-up activity.
Projects by Client Type: This view counts projects by client type. It helps studios see whether their workload is balanced across client groups.
Client Value by Client Segment: This view compares value by client segment. It helps users identify high-value segments that deserve deeper relationship management.
Portfolio Value by Corporate Share: This view shows how portfolio value changes by corporate share. It helps owners understand how much of the portfolio is tied to corporate clients.
Projects by Government Work: This view separates projects based on government work. It helps firms monitor public-sector exposure and compare it with private client work.
Recent Projects by Date: This view shows newer project activity from the client perspective. It helps users connect recent records with the client mix.
Client Insights
Page 4: Team and Hours
The Team and Hours tab is built for resource review. It helps studio leads see where design hours are going, how work is distributed by discipline, and whether team capacity is aligned with current project demand.
Design Hours by Month: This view shows monthly design hours. It helps managers identify busy periods and plan future workload more carefully.
Hours by Discipline: This view compares hours across disciplines. It helps reveal whether architecture, interiors, planning, or other design work is consuming most of the team’s time.
Design Hours by Discipline: This view focuses on design-hour distribution by discipline. It helps teams understand which skills are most in demand.
Capacity by Team: This view compares capacity across teams. It supports staffing decisions when some groups are overloaded and others have room.
Architecture Load by Discipline: This view shows architecture workload by discipline. It helps leaders understand where architectural effort is concentrated.
Projects by Site Status: This view compares projects by site status from a workload angle. It helps teams see how much active site work may affect capacity.
Recent Projects by Date: This view keeps new or recently updated projects visible. It helps managers connect recent project movement to resource planning.
Team and Hours
Page 5: Budget and Billing
The Budget and Billing tab brings financial performance into the same reporting file. It helps owners and finance leads compare revenue, costs, value, margin, delivered work, and recent project activity.
Net Margin by Finance Summary: This view shows net margin by finance summary. It helps users understand whether the portfolio is producing healthy financial outcomes.
Revenue by Money Flow: This view compares revenue across money-flow categories. It helps identify how money is moving through the portfolio.
Cost by Month: This view tracks cost by month. It helps users see whether costs are rising during specific periods.
Value by Discipline: This view compares value across disciplines. It helps identify which design disciplines contribute the most value to the portfolio.
Margin by Portfolio: This view compares margin at the portfolio level. It helps owners see which parts of the portfolio are supporting profitability.
Delivered Value by Completion Status: This view connects delivered value with completion status. It helps teams see how much value is tied to completed or nearly completed work.
Recent Projects by Date: This view brings recent project records into the finance page. It helps teams connect new activity with billing and margin conversations.
Budget and Billing
Data Sheet
The Data Sheet is where users add architecture and design project records in the same format used by the dashboard. Keeping columns consistent is important because the dashboard pages, slicers, cards, and views rely on the structured data format.
Data Sheet tab
Architecture and Design Dashboard in Google Sheets vs. Microsoft Excel vs. Paid Project Management SaaS – Feature Comparison
| Feature | Architecture and Design Dashboard in Google Sheets | Microsoft Excel Dashboard | Paid Project Management SaaS |
|---|---|---|---|
| Cost | $9.99 one-time sale price | Template cost plus Excel access where needed | Monthly or annual subscription |
| Platform | Google Sheets in browser | Excel desktop or web | Vendor-hosted web platform |
| Setup time | Copy the sheet and replace sample rows | Open workbook and replace data | Configure workspace, users, permissions, and fields |
| Real-time team collaboration | Native Google Drive sharing | Available through Microsoft cloud sharing | Usually included by plan |
| Mobile access | Google Sheets app or browser | Excel app or browser | Vendor app or browser |
| Customizable fields | Editable sheet structure | Editable workbook structure | Limited by vendor configuration |
| Share with link | Yes, with permission controls | Yes, with compatible cloud storage | Usually account based |
| Year-1 cost at 5 users | $9.99 template price | Depends on existing licenses | Often a recurring team subscription |
| Architecture-specific reporting | Project, client, team, budget, billing, and data tabs included | Possible with custom setup | Varies by software plan |
Who Should Use This Template
This template is best for architecture firms, interior design studios, design consultants, project managers, project coordinators, and studio owners who already track work in spreadsheets and want a cleaner reporting layer. It is especially useful when a team needs to review project status, portfolio value, client mix, team capacity, and billing performance in one place.
It is not the right fit for teams that need automatic BIM integration, accounting software sync, resource approvals, client portals, proposal generation, or enterprise permissions. This is a dashboard template for structured project reporting, not a complete practice-management platform.
Real-World Use Cases
Studio owner review: A small architecture firm owner checks Portfolio Value, Active projects, On Hold work, Avg Fee, and Budget and Billing before a Monday management meeting.
Project manager delivery check: A project manager reviews Project Performance to compare delivery status, handover stage, project status, and completion rate before contacting clients.
Design operations planning: A design operations lead uses Team and Hours to compare discipline workload and capacity before assigning new work to architecture, interiors, or planning teams.
Advantages of Architecture and Design Dashboard in Google Sheets
- One file for multiple views: project, client, team, budget, billing, and data tracking live in the same template.
- Lower cost than SaaS: the $9.99 sale price is a one-time template purchase rather than a recurring per-user subscription.
- Easy collaboration: Google Sheets sharing makes it simple to give teammates view or edit access.
- Clear dashboard pages: each tab focuses on a specific management question instead of crowding every metric onto one page.
- Editable structure: teams can adapt labels and records if they understand the sheet formulas and dashboard references.
Opportunities for Improvement
- No automatic integrations: accounting systems, time-tracking tools, BIM systems, and CRM platforms do not sync automatically.
- Manual data quality matters: inconsistent status names, missing dates, and mixed currencies can reduce reporting quality.
- Not a workflow approval system: approvals, permissions, client portals, and automated notifications require separate tools or custom development.
Best Practices
- Keep the Data Sheet column headers and structure intact unless you are comfortable updating formulas and dashboard references.
- Use consistent naming for project status, delivery status, site status, client type, discipline, and style.
- Check dates and currency fields before using the dashboard for billing or margin review.
- Give most users viewer access and limit editor access to the people responsible for maintaining the data.
- Create a backup copy before making major structural changes to the workbook.
Explore Relevant Templates
Looking for more Google Sheets dashboards and project tracking templates? These related products may also help:
- Interior Design KPI Dashboard in Google Sheets
- Construction Project Cost Dashboard in Google Sheets
- Project Task Management Dashboard in Google Sheets
- Browse all Google Sheets dashboard templates
Frequently Asked Questions
What is the Architecture and Design Dashboard in Google Sheets?
It is a ready-to-use Google Sheets dashboard template for tracking architecture and design projects, portfolio value, client insights, team hours, budgets, billing, delivery status, and margins.
How many pages are included?
The template includes 6 working tabs: Overview, Project Performance, Client Insights, Team and Hours, Budget and Billing, and Data Sheet.
What KPIs are shown on the Overview page?
The Overview page includes Total, Active, Done, Hold, Portfolio Value, Projects, On Hold, Avg Fee, Status, Top Style, Currency, All-time delivery, and On-Site Projects.
Can I add my own project records?
Yes. Add your records into the Data Sheet using the same structure as the sample data so the dashboard pages continue to update correctly.
Does this template automatically connect to accounting or project management tools?
No. The template is designed for manual entry or pasted/exported data. Automatic integrations are not included.
Can multiple users work with the dashboard?
Yes. Since it is built in Google Sheets, you can share the file through Google Drive with viewer, commenter, or editor permissions.
Who is this dashboard best for?
It is best for architecture firms, interior design studios, project managers, consultants, and design operations teams that need practical portfolio and project reporting in Google Sheets.
About the Author
Built by PK – Microsoft Certified Professional with 15+ years of Excel, Google Sheets, and Power BI experience. Founder of NextGenTemplates, reaching 300K+ subscribers across YouTube channels. Every template is hand-built and tested before release.
Conclusion
The Architecture and Design Dashboard in Google Sheets gives design teams a practical way to review portfolio value, project performance, client mix, team hours, budget movement, billing, and margin without starting from a blank spreadsheet. It is simple enough for spreadsheet users and structured enough for recurring business reviews.
Download the Architecture and Design Dashboard in Google Sheets from NextGenTemplates and start turning architecture project records into clearer decisions.
Visit our YouTube channel for dashboard walkthroughs and tutorials: YouTube.com/@NextGenTemplates
Download the Architecture and Design Dashboard in Google Sheets from NextGenTemplates and start turning architecture project records into clearer decisions.
Visit our YouTube channel for dashboard walkthroughs and tutorials: YouTube.com/@NextGenTemplates
Architecture Load by Discipline: This view shows architecture workload by discipline. It helps leaders understand where architectural effort is concentrated.
Projects by Site Status: This view compares projects by site status from a workload angle. It helps teams see how much active site work may affect capacity.
Recent Projects by Date: This view keeps new or recently updated projects visible. It helps managers connect recent project movement to resource planning.
Team and Hours
Page 5: Budget and Billing
The Budget and Billing tab brings financial performance into the same reporting file. It helps owners and finance leads compare revenue, costs, value, margin, delivered work, and recent project activity.
Net Margin by Finance Summary: This view shows net margin by finance summary. It helps users understand whether the portfolio is producing healthy financial outcomes.
Revenue by Money Flow: This view compares revenue across money-flow categories. It helps identify how money is moving through the portfolio.
Cost by Month: This view tracks cost by month. It helps users see whether costs are rising during specific periods.
Value by Discipline: This view compares value across disciplines. It helps identify which design disciplines contribute the most value to the portfolio.
Margin by Portfolio: This view compares margin at the portfolio level. It helps owners see which parts of the portfolio are supporting profitability.
Delivered Value by Completion Status: This view connects delivered value with completion status. It helps teams see how much value is tied to completed or nearly completed work.
Recent Projects by Date: This view brings recent project records into the finance page. It helps teams connect new activity with billing and margin conversations.
Budget and Billing
Data Sheet
The Data Sheet is where users add architecture and design project records in the same format used by the dashboard. Keeping columns consistent is important because the dashboard pages, slicers, cards, and views rely on the structured data format.
Data Sheet tab
Architecture and Design Dashboard in Google Sheets vs. Microsoft Excel vs. Paid Project Management SaaS – Feature Comparison
| Feature | Architecture and Design Dashboard in Google Sheets | Microsoft Excel Dashboard | Paid Project Management SaaS |
|---|---|---|---|
| Cost | $9.99 one-time sale price | Template cost plus Excel access where needed | Monthly or annual subscription |
| Platform | Google Sheets in browser | Excel desktop or web | Vendor-hosted web platform |
| Setup time | Copy the sheet and replace sample rows | Open workbook and replace data | Configure workspace, users, permissions, and fields |
| Real-time team collaboration | Native Google Drive sharing | Available through Microsoft cloud sharing | Usually included by plan |
| Mobile access | Google Sheets app or browser | Excel app or browser | Vendor app or browser |
| Customizable fields | Editable sheet structure | Editable workbook structure | Limited by vendor configuration |
| Share with link | Yes, with permission controls | Yes, with compatible cloud storage | Usually account based |
| Year-1 cost at 5 users | $9.99 template price | Depends on existing licenses | Often a recurring team subscription |
| Architecture-specific reporting | Project, client, team, budget, billing, and data tabs included | Possible with custom setup | Varies by software plan |
Who Should Use This Template
This template is best for architecture firms, interior design studios, design consultants, project managers, project coordinators, and studio owners who already track work in spreadsheets and want a cleaner reporting layer. It is especially useful when a team needs to review project status, portfolio value, client mix, team capacity, and billing performance in one place.
It is not the right fit for teams that need automatic BIM integration, accounting software sync, resource approvals, client portals, proposal generation, or enterprise permissions. This is a dashboard template for structured project reporting, not a complete practice-management platform.
Real-World Use Cases
Studio owner review: A small architecture firm owner checks Portfolio Value, Active projects, On Hold work, Avg Fee, and Budget and Billing before a Monday management meeting.
Project manager delivery check: A project manager reviews Project Performance to compare delivery status, handover stage, project status, and completion rate before contacting clients.
Design operations planning: A design operations lead uses Team and Hours to compare discipline workload and capacity before assigning new work to architecture, interiors, or planning teams.
Advantages of Architecture and Design Dashboard in Google Sheets
- One file for multiple views: project, client, team, budget, billing, and data tracking live in the same template.
- Lower cost than SaaS: the $9.99 sale price is a one-time template purchase rather than a recurring per-user subscription.
- Easy collaboration: Google Sheets sharing makes it simple to give teammates view or edit access.
- Clear dashboard pages: each tab focuses on a specific management question instead of crowding every metric onto one page.
- Editable structure: teams can adapt labels and records if they understand the sheet formulas and dashboard references.
Opportunities for Improvement
- No automatic integrations: accounting systems, time-tracking tools, BIM systems, and CRM platforms do not sync automatically.
- Manual data quality matters: inconsistent status names, missing dates, and mixed currencies can reduce reporting quality.
- Not a workflow approval system: approvals, permissions, client portals, and automated notifications require separate tools or custom development.
Best Practices
- Keep the Data Sheet column headers and structure intact unless you are comfortable updating formulas and dashboard references.
- Use consistent naming for project status, delivery status, site status, client type, discipline, and style.
- Check dates and currency fields before using the dashboard for billing or margin review.
- Give most users viewer access and limit editor access to the people responsible for maintaining the data.
- Create a backup copy before making major structural changes to the workbook.
Explore Relevant Templates
Looking for more Google Sheets dashboards and project tracking templates? These related products may also help:
- Interior Design KPI Dashboard in Google Sheets
- Construction Project Cost Dashboard in Google Sheets
- Project Task Management Dashboard in Google Sheets
- Browse all Google Sheets dashboard templates
Frequently Asked Questions
What is the Architecture and Design Dashboard in Google Sheets?
It is a ready-to-use Google Sheets dashboard template for tracking architecture and design projects, portfolio value, client insights, team hours, budgets, billing, delivery status, and margins.
How many pages are included?
The template includes 6 working tabs: Overview, Project Performance, Client Insights, Team and Hours, Budget and Billing, and Data Sheet.
What KPIs are shown on the Overview page?
The Overview page includes Total, Active, Done, Hold, Portfolio Value, Projects, On Hold, Avg Fee, Status, Top Style, Currency, All-time delivery, and On-Site Projects.
Can I add my own project records?
Yes. Add your records into the Data Sheet using the same structure as the sample data so the dashboard pages continue to update correctly.
Does this template automatically connect to accounting or project management tools?
No. The template is designed for manual entry or pasted/exported data. Automatic integrations are not included.
Can multiple users work with the dashboard?
Yes. Since it is built in Google Sheets, you can share the file through Google Drive with viewer, commenter, or editor permissions.
Who is this dashboard best for?
It is best for architecture firms, interior design studios, project managers, consultants, and design operations teams that need practical portfolio and project reporting in Google Sheets.
About the Author
Built by PK – Microsoft Certified Professional with 15+ years of Excel, Google Sheets, and Power BI experience. Founder of NextGenTemplates, reaching 300K+ subscribers across YouTube channels. Every template is hand-built and tested before release.
Conclusion
The Architecture and Design Dashboard in Google Sheets gives design teams a practical way to review portfolio value, project performance, client mix, team hours, budget movement, billing, and margin without starting from a blank spreadsheet. It is simple enough for spreadsheet users and structured enough for recurring business reviews.
Download the Architecture and Design Dashboard in Google Sheets from NextGenTemplates and start turning architecture project records into clearer decisions.
Visit our YouTube channel for dashboard walkthroughs and tutorials: YouTube.com/@NextGenTemplates
- Interior Design KPI Dashboard in Google Sheets
- Construction Project Cost Dashboard in Google Sheets
- Project Task Management Dashboard in Google Sheets
- Browse all Google Sheets dashboard templates
Frequently Asked Questions
What is the Architecture and Design Dashboard in Google Sheets?
It is a ready-to-use Google Sheets dashboard template for tracking architecture and design projects, portfolio value, client insights, team hours, budgets, billing, delivery status, and margins.
How many pages are included?
The template includes 6 working tabs: Overview, Project Performance, Client Insights, Team and Hours, Budget and Billing, and Data Sheet.
What KPIs are shown on the Overview page?
The Overview page includes Total, Active, Done, Hold, Portfolio Value, Projects, On Hold, Avg Fee, Status, Top Style, Currency, All-time delivery, and On-Site Projects.
Can I add my own project records?
Yes. Add your records into the Data Sheet using the same structure as the sample data so the dashboard pages continue to update correctly.
Does this template automatically connect to accounting or project management tools?
No. The template is designed for manual entry or pasted/exported data. Automatic integrations are not included.
Can multiple users work with the dashboard?
Yes. Since it is built in Google Sheets, you can share the file through Google Drive with viewer, commenter, or editor permissions.
Who is this dashboard best for?
It is best for architecture firms, interior design studios, project managers, consultants, and design operations teams that need practical portfolio and project reporting in Google Sheets.
About the Author
Built by PK – Microsoft Certified Professional with 15+ years of Excel, Google Sheets, and Power BI experience. Founder of NextGenTemplates, reaching 300K+ subscribers across YouTube channels. Every template is hand-built and tested before release.
Conclusion
The Architecture and Design Dashboard in Google Sheets gives design teams a practical way to review portfolio value, project performance, client mix, team hours, budget movement, billing, and margin without starting from a blank spreadsheet. It is simple enough for spreadsheet users and structured enough for recurring business reviews.
Download the Architecture and Design Dashboard in Google Sheets from NextGenTemplates and start turning architecture project records into clearer decisions.
Visit our YouTube channel for dashboard walkthroughs and tutorials: YouTube.com/@NextGenTemplates
Click here to purchase the Architecture and Design Dashboard in Google Sheets
Key Features of Architecture and Design Dashboard in Google Sheets
- 6 connected sheet tabs covering Overview, Project Performance, Client Insights, Team and Hours, Budget and Billing, and Data Sheet.
- 13 overview cards for Total, Active, Done, Hold, Portfolio Value, Projects, On Hold, Avg Fee, Status, Top Style, Currency, All-time delivery, and On-Site Projects.
- 34 analysis views for project status, pipeline stage, delivery status, handover stage, client type, client segment, design hours, team capacity, revenue, cost, and margin.
- Slicers and filters help users focus the dashboard by project, client, date, status, design style, site status, discipline, and finance-related fields where available.
- Editable data structure lets teams replace sample records with real architecture and design project data.
- Google Sheets format makes it suitable for teams that want a shareable file instead of a locked reporting system.
The Architecture and Design Dashboard in Google Sheets is a ready-to-use reporting template for studios that need project, client, team, budget, billing, and portfolio visibility in one editable spreadsheet. The file includes 6 working tabs, 5 dashboard pages, 13 overview KPI cards, and 34 analysis views, giving architecture firms and design teams a cleaner way to review work without building a dashboard from scratch.
This dashboard is built for teams that already keep project data in spreadsheets, exported reports, or manual trackers. Instead of jumping between separate project status lists, billing files, client summaries, and timesheet views, you can add records into the Data Sheet and review the full picture from the dashboard tabs. Because it is built in Google Sheets, it also supports familiar sharing and collaboration workflows through Google Drive. Google provides more details on Sheets collaboration in its official Google Docs Editors Help guide.
Click here to purchase the Architecture and Design Dashboard in Google Sheets
Key Features of Architecture and Design Dashboard in Google Sheets
- 6 connected sheet tabs covering Overview, Project Performance, Client Insights, Team and Hours, Budget and Billing, and Data Sheet.
- 13 overview cards for Total, Active, Done, Hold, Portfolio Value, Projects, On Hold, Avg Fee, Status, Top Style, Currency, All-time delivery, and On-Site Projects.
- 34 analysis views for project status, pipeline stage, delivery status, handover stage, client type, client segment, design hours, team capacity, revenue, cost, and margin.
- Slicers and filters help users focus the dashboard by project, client, date, status, design style, site status, discipline, and finance-related fields where available.
- Editable data structure lets teams replace sample records with real architecture and design project data.
- Google Sheets format makes it suitable for teams that want a shareable file instead of a locked reporting system.
Dashboard Pages Explanation
The dashboard is organized into focused pages so users can start with a high-level view and then move into project, client, team, and finance analysis. Each page has its own purpose, but the structure stays consistent so users can move through the file quickly during review meetings.
Page 1: Overview
The Overview page is the executive summary for the architecture and design portfolio. At the top, KPI cards show Total, Active, Done, Hold, Portfolio Value, Projects, On Hold, Avg Fee, Status, Top Style, Currency, All-time delivery, and On-Site Projects.
Portfolio Value by Month: This view shows how total project value changes month by month. It helps owners see whether the portfolio is growing, slowing, or becoming concentrated in certain periods.
Projects by Style: This view compares projects by design style. It helps studios understand whether demand is leaning toward a particular architectural or interior design direction.
Portfolio Value by Segment: This view breaks value across business or client segments. It helps teams identify which segments contribute the most to the current pipeline.
Projects by Delivery Status: This view groups projects by delivery status. It helps project managers spot how much work is active, completed, pending, or delayed.
Projects by Site Status: This view separates projects by site activity. It helps teams understand which projects are on-site and which are still in design, planning, or non-site phases.
Recent Projects by Date: This view highlights the latest project records by date. It makes recent updates visible without asking users to search the Data Sheet manually.
Architecture and Design Dashboard in Google SheetsPage 2: Project Performance
The Project Performance tab focuses on status, pipeline movement, handover progress, and completion behavior. It is useful for weekly operations meetings, client delivery reviews, and project manager check-ins.
Active Portfolio by Project Status: This view shows active portfolio value or workload by current project status. It helps identify whether the active portfolio is concentrated in one stage.
Project Count by Month: This view tracks the number of projects over time. It helps studios understand project volume trends and seasonality.
Projects by Status: This view groups the full project list by status. It provides a quick view of active, done, hold, and other project categories.
Project Value by Pipeline Stage: This view compares project value across pipeline stages. It helps leaders see where revenue potential is sitting before delivery is complete.
Completion Rate by Delivery Status: This view connects completion rate with delivery status. It helps teams compare delivery progress across different status groups.
Projects by Handover Stage: This view groups projects by handover stage. It helps identify which projects are close to client delivery and which still need completion work.
Recent Projects by Date: This view keeps recent project movement visible. It is helpful when reviewing what changed since the last internal meeting.
Project PerformancePage 3: Client Insights
The Client Insights tab helps users understand the client side of the portfolio. It is especially useful for owners, business development leads, and account managers who want to see whether value is coming from corporate, government, or other client segments.
Corporate Value by Client Type: This view compares corporate value across client types. It helps teams understand which client groups are contributing the most corporate work.
Client Value by Month: This view shows client value over time. It helps identify months with stronger client contribution and periods that may need follow-up activity.
Projects by Client Type: This view counts projects by client type. It helps studios see whether their workload is balanced across client groups.
Client Value by Client Segment: This view compares value by client segment. It helps users identify high-value segments that deserve deeper relationship management.
Portfolio Value by Corporate Share: This view shows how portfolio value changes by corporate share. It helps owners understand how much of the portfolio is tied to corporate clients.
Projects by Government Work: This view separates projects based on government work. It helps firms monitor public-sector exposure and compare it with private client work.
Recent Projects by Date: This view shows newer project activity from the client perspective. It helps users connect recent records with the client mix.
Client InsightsPage 4: Team and Hours
The Team and Hours tab is built for resource review. It helps studio leads see where design hours are going, how work is distributed by discipline, and whether team capacity is aligned with current project demand.
Design Hours by Month: This view shows monthly design hours. It helps managers identify busy periods and plan future workload more carefully.
Hours by Discipline: This view compares hours across disciplines. It helps reveal whether architecture, interiors, planning, or other design work is consuming most of the team’s time.
Design Hours by Discipline: This view focuses on design-hour distribution by discipline. It helps teams understand which skills are most in demand.
Capacity by Team: This view compares capacity across teams. It supports staffing decisions when some groups are overloaded and others have room.
Architecture Load by Discipline: This view shows architecture workload by discipline. It helps leaders understand where architectural effort is concentrated.
Projects by Site Status: This view compares projects by site status from a workload angle. It helps teams see how much active site work may affect capacity.
Recent Projects by Date: This view keeps new or recently updated projects visible. It helps managers connect recent project movement to resource planning.
Team and HoursPage 5: Budget and Billing
The Budget and Billing tab brings financial performance into the same reporting file. It helps owners and finance leads compare revenue, costs, value, margin, delivered work, and recent project activity.
Net Margin by Finance Summary: This view shows net margin by finance summary. It helps users understand whether the portfolio is producing healthy financial outcomes.
Revenue by Money Flow: This view compares revenue across money-flow categories. It helps identify how money is moving through the portfolio.
Cost by Month: This view tracks cost by month. It helps users see whether costs are rising during specific periods.
Value by Discipline: This view compares value across disciplines. It helps identify which design disciplines contribute the most value to the portfolio.
Margin by Portfolio: This view compares margin at the portfolio level. It helps owners see which parts of the portfolio are supporting profitability.
Delivered Value by Completion Status: This view connects delivered value with completion status. It helps teams see how much value is tied to completed or nearly completed work.
Recent Projects by Date: This view brings recent project records into the finance page. It helps teams connect new activity with billing and margin conversations.
Budget and BillingData Sheet
The Data Sheet is where users add architecture and design project records in the same format used by the dashboard. Keeping columns consistent is important because the dashboard pages, slicers, cards, and views rely on the structured data format.
Data Sheet tabArchitecture and Design Dashboard in Google Sheets vs. Microsoft Excel vs. Paid Project Management SaaS – Feature Comparison
Feature Architecture and Design Dashboard in Google Sheets Microsoft Excel Dashboard Paid Project Management SaaS Cost $9.99 one-time sale price Template cost plus Excel access where needed Monthly or annual subscription Platform Google Sheets in browser Excel desktop or web Vendor-hosted web platform Setup time Copy the sheet and replace sample rows Open workbook and replace data Configure workspace, users, permissions, and fields Real-time team collaboration Native Google Drive sharing Available through Microsoft cloud sharing Usually included by plan Mobile access Google Sheets app or browser Excel app or browser Vendor app or browser Customizable fields Editable sheet structure Editable workbook structure Limited by vendor configuration Share with link Yes, with permission controls Yes, with compatible cloud storage Usually account based Year-1 cost at 5 users $9.99 template price Depends on existing licenses Often a recurring team subscription Architecture-specific reporting Project, client, team, budget, billing, and data tabs included Possible with custom setup Varies by software plan Who Should Use This Template
This template is best for architecture firms, interior design studios, design consultants, project managers, project coordinators, and studio owners who already track work in spreadsheets and want a cleaner reporting layer. It is especially useful when a team needs to review project status, portfolio value, client mix, team capacity, and billing performance in one place.
It is not the right fit for teams that need automatic BIM integration, accounting software sync, resource approvals, client portals, proposal generation, or enterprise permissions. This is a dashboard template for structured project reporting, not a complete practice-management platform.
Real-World Use Cases
Studio owner review: A small architecture firm owner checks Portfolio Value, Active projects, On Hold work, Avg Fee, and Budget and Billing before a Monday management meeting.
Project manager delivery check: A project manager reviews Project Performance to compare delivery status, handover stage, project status, and completion rate before contacting clients.
Design operations planning: A design operations lead uses Team and Hours to compare discipline workload and capacity before assigning new work to architecture, interiors, or planning teams.
Advantages of Architecture and Design Dashboard in Google Sheets
- One file for multiple views: project, client, team, budget, billing, and data tracking live in the same template.
- Lower cost than SaaS: the $9.99 sale price is a one-time template purchase rather than a recurring per-user subscription.
- Easy collaboration: Google Sheets sharing makes it simple to give teammates view or edit access.
- Clear dashboard pages: each tab focuses on a specific management question instead of crowding every metric onto one page.
- Editable structure: teams can adapt labels and records if they understand the sheet formulas and dashboard references.
Opportunities for Improvement
- No automatic integrations: accounting systems, time-tracking tools, BIM systems, and CRM platforms do not sync automatically.
- Manual data quality matters: inconsistent status names, missing dates, and mixed currencies can reduce reporting quality.
- Not a workflow approval system: approvals, permissions, client portals, and automated notifications require separate tools or custom development.
Best Practices
- Keep the Data Sheet column headers and structure intact unless you are comfortable updating formulas and dashboard references.
- Use consistent naming for project status, delivery status, site status, client type, discipline, and style.
- Check dates and currency fields before using the dashboard for billing or margin review.
- Give most users viewer access and limit editor access to the people responsible for maintaining the data.
- Create a backup copy before making major structural changes to the workbook.
Explore Relevant Templates
Looking for more Google Sheets dashboards and project tracking templates? These related products may also help:
- Interior Design KPI Dashboard in Google Sheets
- Construction Project Cost Dashboard in Google Sheets
- Project Task Management Dashboard in Google Sheets
- Browse all Google Sheets dashboard templates
Frequently Asked Questions
What is the Architecture and Design Dashboard in Google Sheets?
It is a ready-to-use Google Sheets dashboard template for tracking architecture and design projects, portfolio value, client insights, team hours, budgets, billing, delivery status, and margins.
How many pages are included?
The template includes 6 working tabs: Overview, Project Performance, Client Insights, Team and Hours, Budget and Billing, and Data Sheet.
What KPIs are shown on the Overview page?
The Overview page includes Total, Active, Done, Hold, Portfolio Value, Projects, On Hold, Avg Fee, Status, Top Style, Currency, All-time delivery, and On-Site Projects.
Can I add my own project records?
Yes. Add your records into the Data Sheet using the same structure as the sample data so the dashboard pages continue to update correctly.
Does this template automatically connect to accounting or project management tools?
No. The template is designed for manual entry or pasted/exported data. Automatic integrations are not included.
Can multiple users work with the dashboard?
Yes. Since it is built in Google Sheets, you can share the file through Google Drive with viewer, commenter, or editor permissions.
Who is this dashboard best for?
It is best for architecture firms, interior design studios, project managers, consultants, and design operations teams that need practical portfolio and project reporting in Google Sheets.
About the Author
Built by PK – Microsoft Certified Professional with 15+ years of Excel, Google Sheets, and Power BI experience. Founder of NextGenTemplates, reaching 300K+ subscribers across YouTube channels. Every template is hand-built and tested before release.
Conclusion
The Architecture and Design Dashboard in Google Sheets gives design teams a practical way to review portfolio value, project performance, client mix, team hours, budget movement, billing, and margin without starting from a blank spreadsheet. It is simple enough for spreadsheet users and structured enough for recurring business reviews.
Download the Architecture and Design Dashboard in Google Sheets from NextGenTemplates and start turning architecture project records into clearer decisions.
Visit our YouTube channel for dashboard walkthroughs and tutorials: YouTube.com/@NextGenTemplates
Dashboard Pages Explanation
The dashboard is organized into focused pages so users can start with a high-level view and then move into project, client, team, and finance analysis. Each page has its own purpose, but the structure stays consistent so users can move through the file quickly during review meetings.
Page 1: Overview
The Overview page is the executive summary for the architecture and design portfolio. At the top, KPI cards show Total, Active, Done, Hold, Portfolio Value, Projects, On Hold, Avg Fee, Status, Top Style, Currency, All-time delivery, and On-Site Projects.
Portfolio Value by Month: This view shows how total project value changes month by month. It helps owners see whether the portfolio is growing, slowing, or becoming concentrated in certain periods.
Projects by Style: This view compares projects by design style. It helps studios understand whether demand is leaning toward a particular architectural or interior design direction.
Portfolio Value by Segment: This view breaks value across business or client segments. It helps teams identify which segments contribute the most to the current pipeline.
Projects by Delivery Status: This view groups projects by delivery status. It helps project managers spot how much work is active, completed, pending, or delayed.
Projects by Site Status: This view separates projects by site activity. It helps teams understand which projects are on-site and which are still in design, planning, or non-site phases.
Recent Projects by Date: This view highlights the latest project records by date. It makes recent updates visible without asking users to search the Data Sheet manually.
Architecture and Design Dashboard in Google Sheets
Page 2: Project Performance
The Project Performance tab focuses on status, pipeline movement, handover progress, and completion behavior. It is useful for weekly operations meetings, client delivery reviews, and project manager check-ins.
Active Portfolio by Project Status: This view shows active portfolio value or workload by current project status. It helps identify whether the active portfolio is concentrated in one stage.
Project Count by Month: This view tracks the number of projects over time. It helps studios understand project volume trends and seasonality.
Projects by Status: This view groups the full project list by status. It provides a quick view of active, done, hold, and other project categories.
Project Value by Pipeline Stage: This view compares project value across pipeline stages. It helps leaders see where revenue potential is sitting before delivery is complete.
Completion Rate by Delivery Status: This view connects completion rate with delivery status. It helps teams compare delivery progress across different status groups.
Projects by Handover Stage: This view groups projects by handover stage. It helps identify which projects are close to client delivery and which still need completion work.
Recent Projects by Date: This view keeps recent project movement visible. It is helpful when reviewing what changed since the last internal meeting.
Project Performance
Page 3: Client Insights
The Client Insights tab helps users understand the client side of the portfolio. It is especially useful for owners, business development leads, and account managers who want to see whether value is coming from corporate, government, or other client segments.
Corporate Value by Client Type: This view compares corporate value across client types. It helps teams understand which client groups are contributing the most corporate work.
Client Value by Month: This view shows client value over time. It helps identify months with stronger client contribution and periods that may need follow-up activity.
Projects by Client Type: This view counts projects by client type. It helps studios see whether their workload is balanced across client groups.
Client Value by Client Segment: This view compares value by client segment. It helps users identify high-value segments that deserve deeper relationship management.
Portfolio Value by Corporate Share: This view shows how portfolio value changes by corporate share. It helps owners understand how much of the portfolio is tied to corporate clients.
Projects by Government Work: This view separates projects based on government work. It helps firms monitor public-sector exposure and compare it with private client work.
Recent Projects by Date: This view shows newer project activity from the client perspective. It helps users connect recent records with the client mix.
Client Insights
Page 4: Team and Hours
The Team and Hours tab is built for resource review. It helps studio leads see where design hours are going, how work is distributed by discipline, and whether team capacity is aligned with current project demand.
Design Hours by Month: This view shows monthly design hours. It helps managers identify busy periods and plan future workload more carefully.
Hours by Discipline: This view compares hours across disciplines. It helps reveal whether architecture, interiors, planning, or other design work is consuming most of the team’s time.
Design Hours by Discipline: This view focuses on design-hour distribution by discipline. It helps teams understand which skills are most in demand.
Capacity by Team: This view compares capacity across teams. It supports staffing decisions when some groups are overloaded and others have room.
Architecture Load by Discipline: This view shows architecture workload by discipline. It helps leaders understand where architectural effort is concentrated.
Projects by Site Status: This view compares projects by site status from a workload angle. It helps teams see how much active site work may affect capacity.
Recent Projects by Date: This view keeps new or recently updated projects visible. It helps managers connect recent project movement to resource planning.
Team and Hours
Page 5: Budget and Billing
The Budget and Billing tab brings financial performance into the same reporting file. It helps owners and finance leads compare revenue, costs, value, margin, delivered work, and recent project activity.
Net Margin by Finance Summary: This view shows net margin by finance summary. It helps users understand whether the portfolio is producing healthy financial outcomes.
Revenue by Money Flow: This view compares revenue across money-flow categories. It helps identify how money is moving through the portfolio.
Cost by Month: This view tracks cost by month. It helps users see whether costs are rising during specific periods.
Value by Discipline: This view compares value across disciplines. It helps identify which design disciplines contribute the most value to the portfolio.
Margin by Portfolio: This view compares margin at the portfolio level. It helps owners see which parts of the portfolio are supporting profitability.
Delivered Value by Completion Status: This view connects delivered value with completion status. It helps teams see how much value is tied to completed or nearly completed work.
Recent Projects by Date: This view brings recent project records into the finance page. It helps teams connect new activity with billing and margin conversations.
Budget and Billing
Data Sheet
The Data Sheet is where users add architecture and design project records in the same format used by the dashboard. Keeping columns consistent is important because the dashboard pages, slicers, cards, and views rely on the structured data format.
Data Sheet tab
Architecture and Design Dashboard in Google Sheets vs. Microsoft Excel vs. Paid Project Management SaaS – Feature Comparison
| Feature | Architecture and Design Dashboard in Google Sheets | Microsoft Excel Dashboard | Paid Project Management SaaS |
|---|---|---|---|
| Cost | $9.99 one-time sale price | Template cost plus Excel access where needed | Monthly or annual subscription |
| Platform | Google Sheets in browser | Excel desktop or web | Vendor-hosted web platform |
| Setup time | Copy the sheet and replace sample rows | Open workbook and replace data | Configure workspace, users, permissions, and fields |
| Real-time team collaboration | Native Google Drive sharing | Available through Microsoft cloud sharing | Usually included by plan |
| Mobile access | Google Sheets app or browser | Excel app or browser | Vendor app or browser |
| Customizable fields | Editable sheet structure | Editable workbook structure | Limited by vendor configuration |
| Share with link | Yes, with permission controls | Yes, with compatible cloud storage | Usually account based |
| Year-1 cost at 5 users | $9.99 template price | Depends on existing licenses | Often a recurring team subscription |
| Architecture-specific reporting | Project, client, team, budget, billing, and data tabs included | Possible with custom setup | Varies by software plan |
Who Should Use This Template
This template is best for architecture firms, interior design studios, design consultants, project managers, project coordinators, and studio owners who already track work in spreadsheets and want a cleaner reporting layer. It is especially useful when a team needs to review project status, portfolio value, client mix, team capacity, and billing performance in one place.
It is not the right fit for teams that need automatic BIM integration, accounting software sync, resource approvals, client portals, proposal generation, or enterprise permissions. This is a dashboard template for structured project reporting, not a complete practice-management platform.
Real-World Use Cases
Studio owner review: A small architecture firm owner checks Portfolio Value, Active projects, On Hold work, Avg Fee, and Budget and Billing before a Monday management meeting.
Project manager delivery check: A project manager reviews Project Performance to compare delivery status, handover stage, project status, and completion rate before contacting clients.
Design operations planning: A design operations lead uses Team and Hours to compare discipline workload and capacity before assigning new work to architecture, interiors, or planning teams.
Advantages of Architecture and Design Dashboard in Google Sheets
- One file for multiple views: project, client, team, budget, billing, and data tracking live in the same template.
- Lower cost than SaaS: the $9.99 sale price is a one-time template purchase rather than a recurring per-user subscription.
- Easy collaboration: Google Sheets sharing makes it simple to give teammates view or edit access.
- Clear dashboard pages: each tab focuses on a specific management question instead of crowding every metric onto one page.
- Editable structure: teams can adapt labels and records if they understand the sheet formulas and dashboard references.
Opportunities for Improvement
- No automatic integrations: accounting systems, time-tracking tools, BIM systems, and CRM platforms do not sync automatically.
- Manual data quality matters: inconsistent status names, missing dates, and mixed currencies can reduce reporting quality.
- Not a workflow approval system: approvals, permissions, client portals, and automated notifications require separate tools or custom development.
Best Practices
- Keep the Data Sheet column headers and structure intact unless you are comfortable updating formulas and dashboard references.
- Use consistent naming for project status, delivery status, site status, client type, discipline, and style.
- Check dates and currency fields before using the dashboard for billing or margin review.
- Give most users viewer access and limit editor access to the people responsible for maintaining the data.
- Create a backup copy before making major structural changes to the workbook.
Explore Relevant Templates
Looking for more Google Sheets dashboards and project tracking templates? These related products may also help:
- Interior Design KPI Dashboard in Google Sheets
- Construction Project Cost Dashboard in Google Sheets
- Project Task Management Dashboard in Google Sheets
- Browse all Google Sheets dashboard templates
Frequently Asked Questions
What is the Architecture and Design Dashboard in Google Sheets?
It is a ready-to-use Google Sheets dashboard template for tracking architecture and design projects, portfolio value, client insights, team hours, budgets, billing, delivery status, and margins.
How many pages are included?
The template includes 6 working tabs: Overview, Project Performance, Client Insights, Team and Hours, Budget and Billing, and Data Sheet.
What KPIs are shown on the Overview page?
The Overview page includes Total, Active, Done, Hold, Portfolio Value, Projects, On Hold, Avg Fee, Status, Top Style, Currency, All-time delivery, and On-Site Projects.
Can I add my own project records?
Yes. Add your records into the Data Sheet using the same structure as the sample data so the dashboard pages continue to update correctly.
Does this template automatically connect to accounting or project management tools?
No. The template is designed for manual entry or pasted/exported data. Automatic integrations are not included.
Can multiple users work with the dashboard?
Yes. Since it is built in Google Sheets, you can share the file through Google Drive with viewer, commenter, or editor permissions.
Who is this dashboard best for?
It is best for architecture firms, interior design studios, project managers, consultants, and design operations teams that need practical portfolio and project reporting in Google Sheets.
About the Author
Built by PK – Microsoft Certified Professional with 15+ years of Excel, Google Sheets, and Power BI experience. Founder of NextGenTemplates, reaching 300K+ subscribers across YouTube channels. Every template is hand-built and tested before release.
Conclusion
The Architecture and Design Dashboard in Google Sheets gives design teams a practical way to review portfolio value, project performance, client mix, team hours, budget movement, billing, and margin without starting from a blank spreadsheet. It is simple enough for spreadsheet users and structured enough for recurring business reviews.
The Architecture and Design Dashboard in Google Sheets is a ready-to-use reporting template for studios that need project, client, team, budget, billing, and portfolio visibility in one editable spreadsheet. The file includes 6 working tabs, 5 dashboard pages, 13 overview KPI cards, and 34 analysis views, giving architecture firms and design teams a cleaner way to review work without building a dashboard from scratch.
This dashboard is built for teams that already keep project data in spreadsheets, exported reports, or manual trackers. Instead of jumping between separate project status lists, billing files, client summaries, and timesheet views, you can add records into the Data Sheet and review the full picture from the dashboard tabs. Because it is built in Google Sheets, it also supports familiar sharing and collaboration workflows through Google Drive. Google provides more details on Sheets collaboration in its official Google Docs Editors Help guide.
Click here to purchase the Architecture and Design Dashboard in Google Sheets
Key Features of Architecture and Design Dashboard in Google Sheets
- 6 connected sheet tabs covering Overview, Project Performance, Client Insights, Team and Hours, Budget and Billing, and Data Sheet.
- 13 overview cards for Total, Active, Done, Hold, Portfolio Value, Projects, On Hold, Avg Fee, Status, Top Style, Currency, All-time delivery, and On-Site Projects.
- 34 analysis views for project status, pipeline stage, delivery status, handover stage, client type, client segment, design hours, team capacity, revenue, cost, and margin.
- Slicers and filters help users focus the dashboard by project, client, date, status, design style, site status, discipline, and finance-related fields where available.
- Editable data structure lets teams replace sample records with real architecture and design project data.
- Google Sheets format makes it suitable for teams that want a shareable file instead of a locked reporting system.
Dashboard Pages Explanation
The dashboard is organized into focused pages so users can start with a high-level view and then move into project, client, team, and finance analysis. Each page has its own purpose, but the structure stays consistent so users can move through the file quickly during review meetings.
Page 1: Overview
The Overview page is the executive summary for the architecture and design portfolio. At the top, KPI cards show Total, Active, Done, Hold, Portfolio Value, Projects, On Hold, Avg Fee, Status, Top Style, Currency, All-time delivery, and On-Site Projects.
Portfolio Value by Month: This view shows how total project value changes month by month. It helps owners see whether the portfolio is growing, slowing, or becoming concentrated in certain periods.
Projects by Style: This view compares projects by design style. It helps studios understand whether demand is leaning toward a particular architectural or interior design direction.
Portfolio Value by Segment: This view breaks value across business or client segments. It helps teams identify which segments contribute the most to the current pipeline.
Projects by Delivery Status: This view groups projects by delivery status. It helps project managers spot how much work is active, completed, pending, or delayed.
Projects by Site Status: This view separates projects by site activity. It helps teams understand which projects are on-site and which are still in design, planning, or non-site phases.
Recent Projects by Date: This view highlights the latest project records by date. It makes recent updates visible without asking users to search the Data Sheet manually.
Architecture and Design Dashboard in Google Sheets
Page 2: Project Performance
The Project Performance tab focuses on status, pipeline movement, handover progress, and completion behavior. It is useful for weekly operations meetings, client delivery reviews, and project manager check-ins.
Active Portfolio by Project Status: This view shows active portfolio value or workload by current project status. It helps identify whether the active portfolio is concentrated in one stage.
Project Count by Month: This view tracks the number of projects over time. It helps studios understand project volume trends and seasonality.
Projects by Status: This view groups the full project list by status. It provides a quick view of active, done, hold, and other project categories.
Project Value by Pipeline Stage: This view compares project value across pipeline stages. It helps leaders see where revenue potential is sitting before delivery is complete.
Completion Rate by Delivery Status: This view connects completion rate with delivery status. It helps teams compare delivery progress across different status groups.
Projects by Handover Stage: This view groups projects by handover stage. It helps identify which projects are close to client delivery and which still need completion work.
Recent Projects by Date: This view keeps recent project movement visible. It is helpful when reviewing what changed since the last internal meeting.
Project Performance
Page 3: Client Insights
The Client Insights tab helps users understand the client side of the portfolio. It is especially useful for owners, business development leads, and account managers who want to see whether value is coming from corporate, government, or other client segments.
Corporate Value by Client Type: This view compares corporate value across client types. It helps teams understand which client groups are contributing the most corporate work.
Client Value by Month: This view shows client value over time. It helps identify months with stronger client contribution and periods that may need follow-up activity.
Projects by Client Type: This view counts projects by client type. It helps studios see whether their workload is balanced across client groups.
The Architecture and Design Dashboard in Google Sheets is a ready-to-use reporting template for studios that need project, client, team, budget, billing, and portfolio visibility in one editable spreadsheet. The file includes 6 working tabs, 5 dashboard pages, 13 overview KPI cards, and 34 analysis views, giving architecture firms and design teams a cleaner way to review work without building a dashboard from scratch.
This dashboard is built for teams that already keep project data in spreadsheets, exported reports, or manual trackers. Instead of jumping between separate project status lists, billing files, client summaries, and timesheet views, you can add records into the Data Sheet and review the full picture from the dashboard tabs. Because it is built in Google Sheets, it also supports familiar sharing and collaboration workflows through Google Drive. Google provides more details on Sheets collaboration in its official Google Docs Editors Help guide.
Click here to purchase the Architecture and Design Dashboard in Google Sheets
Key Features of Architecture and Design Dashboard in Google Sheets
- 6 connected sheet tabs covering Overview, Project Performance, Client Insights, Team and Hours, Budget and Billing, and Data Sheet.
- 13 overview cards for Total, Active, Done, Hold, Portfolio Value, Projects, On Hold, Avg Fee, Status, Top Style, Currency, All-time delivery, and On-Site Projects.
- 34 analysis views for project status, pipeline stage, delivery status, handover stage, client type, client segment, design hours, team capacity, revenue, cost, and margin.
- Slicers and filters help users focus the dashboard by project, client, date, status, design style, site status, discipline, and finance-related fields where available.
- Editable data structure lets teams replace sample records with real architecture and design project data.
- Google Sheets format makes it suitable for teams that want a shareable file instead of a locked reporting system.
Dashboard Pages Explanation
The dashboard is organized into focused pages so users can start with a high-level view and then move into project, client, team, and finance analysis. Each page has its own purpose, but the structure stays consistent so users can move through the file quickly during review meetings.
Page 1: Overview
The Overview page is the executive summary for the architecture and design portfolio. At the top, KPI cards show Total, Active, Done, Hold, Portfolio Value, Projects, On Hold, Avg Fee, Status, Top Style, Currency, All-time delivery, and On-Site Projects.
Portfolio Value by Month: This view shows how total project value changes month by month. It helps owners see whether the portfolio is growing, slowing, or becoming concentrated in certain periods.
Projects by Style: This view compares projects by design style. It helps studios understand whether demand is leaning toward a particular architectural or interior design direction.
Portfolio Value by Segment: This view breaks value across business or client segments. It helps teams identify which segments contribute the most to the current pipeline.
Projects by Delivery Status: This view groups projects by delivery status. It helps project managers spot how much work is active, completed, pending, or delayed.
Projects by Site Status: This view separates projects by site activity. It helps teams understand which projects are on-site and which are still in design, planning, or non-site phases.
Recent Projects by Date: This view highlights the latest project records by date. It makes recent updates visible without asking users to search the Data Sheet manually.
Architecture and Design Dashboard in Google Sheets
Page 2: Project Performance
The Project Performance tab focuses on status, pipeline movement, handover progress, and completion behavior. It is useful for weekly operations meetings, client delivery reviews, and project manager check-ins.
Active Portfolio by Project Status: This view shows active portfolio value or workload by current project status. It helps identify whether the active portfolio is concentrated in one stage.
Project Count by Month: This view tracks the number of projects over time. It helps studios understand project volume trends and seasonality.
Projects by Status: This view groups the full project list by status. It provides a quick view of active, done, hold, and other project categories.
Project Value by Pipeline Stage: This view compares project value across pipeline stages. It helps leaders see where revenue potential is sitting before delivery is complete.
Completion Rate by Delivery Status: This view connects completion rate with delivery status. It helps teams compare delivery progress across different status groups.
Projects by Handover Stage: This view groups projects by handover stage. It helps identify which projects are close to client delivery and which still need completion work.
Recent Projects by Date: This view keeps recent project movement visible. It is helpful when reviewing what changed since the last internal meeting.
Project Performance
Page 3: Client Insights
The Client Insights tab helps users understand the client side of the portfolio. It is especially useful for owners, business development leads, and account managers who want to see whether value is coming from corporate, government, or other client segments.
Corporate Value by Client Type: This view compares corporate value across client types. It helps teams understand which client groups are contributing the most corporate work.
Client Value by Month: This view shows client value over time. It helps identify months with stronger client contribution and periods that may need follow-up activity.
The Architecture and Design Dashboard in Google Sheets is a ready-to-use reporting template for studios that need project, client, team, budget, billing, and portfolio visibility in one editable spreadsheet. The file includes 6 working tabs, 5 dashboard pages, 13 overview KPI cards, and 34 analysis views, giving architecture firms and design teams a cleaner way to review work without building a dashboard from scratch.
This dashboard is built for teams that already keep project data in spreadsheets, exported reports, or manual trackers. Instead of jumping between separate project status lists, billing files, client summaries, and timesheet views, you can add records into the Data Sheet and review the full picture from the dashboard tabs. Because it is built in Google Sheets, it also supports familiar sharing and collaboration workflows through Google Drive. Google provides more details on Sheets collaboration in its official Google Docs Editors Help guide.
Click here to purchase the Architecture and Design Dashboard in Google Sheets
Key Features of Architecture and Design Dashboard in Google Sheets
- 6 connected sheet tabs covering Overview, Project Performance, Client Insights, Team and Hours, Budget and Billing, and Data Sheet.
- 13 overview cards for Total, Active, Done, Hold, Portfolio Value, Projects, On Hold, Avg Fee, Status, Top Style, Currency, All-time delivery, and On-Site Projects.
- 34 analysis views for project status, pipeline stage, delivery status, handover stage, client type, client segment, design hours, team capacity, revenue, cost, and margin.
- Slicers and filters help users focus the dashboard by project, client, date, status, design style, site status, discipline, and finance-related fields where available.
- Editable data structure lets teams replace sample records with real architecture and design project data.
- Google Sheets format makes it suitable for teams that want a shareable file instead of a locked reporting system.
Dashboard Pages Explanation
The dashboard is organized into focused pages so users can start with a high-level view and then move into project, client, team, and finance analysis. Each page has its own purpose, but the structure stays consistent so users can move through the file quickly during review meetings.
Page 1: Overview
The Overview page is the executive summary for the architecture and design portfolio. At the top, KPI cards show Total, Active, Done, Hold, Portfolio Value, Projects, On Hold, Avg Fee, Status, Top Style, Currency, All-time delivery, and On-Site Projects.
Portfolio Value by Month: This view shows how total project value changes month by month. It helps owners see whether the portfolio is growing, slowing, or becoming concentrated in certain periods.
Projects by Style: This view compares projects by design style. It helps studios understand whether demand is leaning toward a particular architectural or interior design direction.
Portfolio Value by Segment: This view breaks value across business or client segments. It helps teams identify which segments contribute the most to the current pipeline.
Projects by Delivery Status: This view groups projects by delivery status. It helps project managers spot how much work is active, completed, pending, or delayed.
Projects by Site Status: This view separates projects by site activity. It helps teams understand which projects are on-site and which are still in design, planning, or non-site phases.
Recent Projects by Date: This view highlights the latest project records by date. It makes recent updates visible without asking users to search the Data Sheet manually.
Architecture and Design Dashboard in Google Sheets
Page 2: Project Performance
The Project Performance tab focuses on status, pipeline movement, handover progress, and completion behavior. It is useful for weekly operations meetings, client delivery reviews, and project manager check-ins.
Active Portfolio by Project Status: This view shows active portfolio value or workload by current project status. It helps identify whether the active portfolio is concentrated in one stage.
Project Count by Month: This view tracks the number of projects over time. It helps studios understand project volume trends and seasonality.
Projects by Status: This view groups the full project list by status. It provides a quick view of active, done, hold, and other project categories.
Project Value by Pipeline Stage: This view compares project value across pipeline stages. It helps leaders see where revenue potential is sitting before delivery is complete.
Completion Rate by Delivery Status: This view connects completion rate with delivery status. It helps teams compare delivery progress across different status groups.
Projects by Handover Stage: This view groups projects by handover stage. It helps identify which projects are close to client delivery and which still need completion work.
Recent Projects by Date: This view keeps recent project movement visible. It is helpful when reviewing what changed since the last internal meeting.
Project Performance
Page 3: Client Insights
The Client Insights tab helps users understand the client side of the portfolio. It is especially useful for owners, business development leads, and account managers who want to see whether value is coming from corporate, government, or other client segments.
Corporate Value by Client Type: This view compares corporate value across client types. It helps teams understand which client groups are contributing the most corporate work.
Client Value by Month: This view shows client value over time. It helps identify months with stronger client contribution and periods that may need follow-up activity.
Projects by Client Type: This view counts projects by client type. It helps studios see whether their workload is balanced across client groups.
Client Value by Client Segment: This view compares value by client segment. It helps users identify high-value segments that deserve deeper relationship management.
Portfolio Value by Corporate Share: This view shows how portfolio value changes by corporate share. It helps owners understand how much of the portfolio is tied to corporate clients.
Projects by Government Work: This view separates projects based on government work. It helps firms monitor public-sector exposure and compare it with private client work.
Recent Projects by Date: This view shows newer project activity from the client perspective. It helps users connect recent records with the client mix.
Client Insights
Page 4: Team and Hours
The Team and Hours tab is built for resource review. It helps studio leads see where design hours are going, how work is distributed by discipline, and whether team capacity is aligned with current project demand.
Design Hours by Month: This view shows monthly design hours. It helps managers identify busy periods and plan future workload more carefully.
Hours by Discipline: This view compares hours across disciplines. It helps reveal whether architecture, interiors, planning, or other design work is consuming most of the team’s time.
Design Hours by Discipline: This view focuses on design-hour distribution by discipline. It helps teams understand which skills are most in demand.
Capacity by Team: This view compares capacity across teams. It supports staffing decisions when some groups are overloaded and others have room.
Architecture Load by Discipline: This view shows architecture workload by discipline. It helps leaders understand where architectural effort is concentrated.
Projects by Site Status: This view compares projects by site status from a workload angle. It helps teams see how much active site work may affect capacity.
Recent Projects by Date: This view keeps new or recently updated projects visible. It helps managers connect recent project movement to resource planning.
Team and Hours
Page 5: Budget and Billing
The Budget and Billing tab brings financial performance into the same reporting file. It helps owners and finance leads compare revenue, costs, value, margin, delivered work, and recent project activity.
Net Margin by Finance Summary: This view shows net margin by finance summary. It helps users understand whether the portfolio is producing healthy financial outcomes.
Revenue by Money Flow: This view compares revenue across money-flow categories. It helps identify how money is moving through the portfolio.
Cost by Month: This view tracks cost by month. It helps users see whether costs are rising during specific periods.
Value by Discipline: This view compares value across disciplines. It helps identify which design disciplines contribute the most value to the portfolio.
Margin by Portfolio: This view compares margin at the portfolio level. It helps owners see which parts of the portfolio are supporting profitability.
Delivered Value by Completion Status: This view connects delivered value with completion status. It helps teams see how much value is tied to completed or nearly completed work.
Recent Projects by Date: This view brings recent project records into the finance page. It helps teams connect new activity with billing and margin conversations.
Budget and Billing
Data Sheet
The Data Sheet is where users add architecture and design project records in the same format used by the dashboard. Keeping columns consistent is important because the dashboard pages, slicers, cards, and views rely on the structured data format.
Data Sheet tab
Architecture and Design Dashboard in Google Sheets vs. Microsoft Excel vs. Paid Project Management SaaS – Feature Comparison
| Feature | Architecture and Design Dashboard in Google Sheets | Microsoft Excel Dashboard | Paid Project Management SaaS |
|---|---|---|---|
| Cost | $9.99 one-time sale price | Template cost plus Excel access where needed | Monthly or annual subscription |
| Platform | Google Sheets in browser | Excel desktop or web | Vendor-hosted web platform |
| Setup time | Copy the sheet and replace sample rows | Open workbook and replace data | Configure workspace, users, permissions, and fields |
| Real-time team collaboration | Native Google Drive sharing | Available through Microsoft cloud sharing | Usually included by plan |
| Mobile access | Google Sheets app or browser | Excel app or browser | Vendor app or browser |
| Customizable fields | Editable sheet structure | Editable workbook structure | Limited by vendor configuration |
| Share with link | Yes, with permission controls | Yes, with compatible cloud storage | Usually account based |
| Year-1 cost at 5 users | $9.99 template price | Depends on existing licenses | Often a recurring team subscription |
| Architecture-specific reporting | Project, client, team, budget, billing, and data tabs included | Possible with custom setup | Varies by software plan |
Who Should Use This Template
This template is best for architecture firms, interior design studios, design consultants, project managers, project coordinators, and studio owners who already track work in spreadsheets and want a cleaner reporting layer. It is especially useful when a team needs to review project status, portfolio value, client mix, team capacity, and billing performance in one place.
It is not the right fit for teams that need automatic BIM integration, accounting software sync, resource approvals, client portals, proposal generation, or enterprise permissions. This is a dashboard template for structured project reporting, not a complete practice-management platform.
Real-World Use Cases
Studio owner review: A small architecture firm owner checks Portfolio Value, Active projects, On Hold work, Avg Fee, and Budget and Billing before a Monday management meeting.
Project manager delivery check: A project manager reviews Project Performance to compare delivery status, handover stage, project status, and completion rate before contacting clients.
Design operations planning: A design operations lead uses Team and Hours to compare discipline workload and capacity before assigning new work to architecture, interiors, or planning teams.
Advantages of Architecture and Design Dashboard in Google Sheets
- One file for multiple views: project, client, team, budget, billing, and data tracking live in the same template.
- Lower cost than SaaS: the $9.99 sale price is a one-time template purchase rather than a recurring per-user subscription.
- Easy collaboration: Google Sheets sharing makes it simple to give teammates view or edit access.
- Clear dashboard pages: each tab focuses on a specific management question instead of crowding every metric onto one page.
- Editable structure: teams can adapt labels and records if they understand the sheet formulas and dashboard references.
Opportunities for Improvement
- No automatic integrations: accounting systems, time-tracking tools, BIM systems, and CRM platforms do not sync automatically.
- Manual data quality matters: inconsistent status names, missing dates, and mixed currencies can reduce reporting quality.
- Not a workflow approval system: approvals, permissions, client portals, and automated notifications require separate tools or custom development.
Best Practices
- Keep the Data Sheet column headers and structure intact unless you are comfortable updating formulas and dashboard references.
- Use consistent naming for project status, delivery status, site status, client type, discipline, and style.
- Check dates and currency fields before using the dashboard for billing or margin review.
- Give most users viewer access and limit editor access to the people responsible for maintaining the data.
- Create a backup copy before making major structural changes to the workbook.
Explore Relevant Templates
Looking for more Google Sheets dashboards and project tracking templates? These related products may also help:
- Interior Design KPI Dashboard in Google Sheets
- Construction Project Cost Dashboard in Google Sheets
- Project Task Management Dashboard in Google Sheets
- Browse all Google Sheets dashboard templates
Frequently Asked Questions
What is the Architecture and Design Dashboard in Google Sheets?
It is a ready-to-use Google Sheets dashboard template for tracking architecture and design projects, portfolio value, client insights, team hours, budgets, billing, delivery status, and margins.
How many pages are included?
The template includes 6 working tabs: Overview, Project Performance, Client Insights, Team and Hours, Budget and Billing, and Data Sheet.
What KPIs are shown on the Overview page?
The Overview page includes Total, Active, Done, Hold, Portfolio Value, Projects, On Hold, Avg Fee, Status, Top Style, Currency, All-time delivery, and On-Site Projects.
Can I add my own project records?
Yes. Add your records into the Data Sheet using the same structure as the sample data so the dashboard pages continue to update correctly.
Does this template automatically connect to accounting or project management tools?
No. The template is designed for manual entry or pasted/exported data. Automatic integrations are not included.
Can multiple users work with the dashboard?
Yes. Since it is built in Google Sheets, you can share the file through Google Drive with viewer, commenter, or editor permissions.
Who is this dashboard best for?
It is best for architecture firms, interior design studios, project managers, consultants, and design operations teams that need practical portfolio and project reporting in Google Sheets.
About the Author
Built by PK – Microsoft Certified Professional with 15+ years of Excel, Google Sheets, and Power BI experience. Founder of NextGenTemplates, reaching 300K+ subscribers across YouTube channels. Every template is hand-built and tested before release.
Conclusion
The Architecture and Design Dashboard in Google Sheets gives design teams a practical way to review portfolio value, project performance, client mix, team hours, budget movement, billing, and margin without starting from a blank spreadsheet. It is simple enough for spreadsheet users and structured enough for recurring business reviews.
Download the Architecture and Design Dashboard in Google Sheets from NextGenTemplates and start turning architecture project records into clearer decisions.
Visit our YouTube channel for dashboard walkthroughs and tutorials: YouTube.com/@NextGenTemplates
Projects by Client Type: This view counts projects by client type. It helps studios see whether their workload is balanced across client groups.
Client Value by Client Segment: This view compares value by client segment. It helps users identify high-value segments that deserve deeper relationship management.
Portfolio Value by Corporate Share: This view shows how portfolio value changes by corporate share. It helps owners understand how much of the portfolio is tied to corporate clients.
Projects by Government Work: This view separates projects based on government work. It helps firms monitor public-sector exposure and compare it with private client work.
Recent Projects by Date: This view shows newer project activity from the client perspective. It helps users connect recent records with the client mix.
Client Insights
Page 4: Team and Hours
The Team and Hours tab is built for resource review. It helps studio leads see where design hours are going, how work is distributed by discipline, and whether team capacity is aligned with current project demand.
Design Hours by Month: This view shows monthly design hours. It helps managers identify busy periods and plan future workload more carefully.
Hours by Discipline: This view compares hours across disciplines. It helps reveal whether architecture, interiors, planning, or other design work is consuming most of the team’s time.
Design Hours by Discipline: This view focuses on design-hour distribution by discipline. It helps teams understand which skills are most in demand.
Capacity by Team: This view compares capacity across teams. It supports staffing decisions when some groups are overloaded and others have room.
Architecture Load by Discipline: This view shows architecture workload by discipline. It helps leaders understand where architectural effort is concentrated.
Projects by Site Status: This view compares projects by site status from a workload angle. It helps teams see how much active site work may affect capacity.
Recent Projects by Date: This view keeps new or recently updated projects visible. It helps managers connect recent project movement to resource planning.
Team and Hours
Page 5: Budget and Billing
The Budget and Billing tab brings financial performance into the same reporting file. It helps owners and finance leads compare revenue, costs, value, margin, delivered work, and recent project activity.
Net Margin by Finance Summary: This view shows net margin by finance summary. It helps users understand whether the portfolio is producing healthy financial outcomes.
Revenue by Money Flow: This view compares revenue across money-flow categories. It helps identify how money is moving through the portfolio.
Cost by Month: This view tracks cost by month. It helps users see whether costs are rising during specific periods.
Value by Discipline: This view compares value across disciplines. It helps identify which design disciplines contribute the most value to the portfolio.
Margin by Portfolio: This view compares margin at the portfolio level. It helps owners see which parts of the portfolio are supporting profitability.
Delivered Value by Completion Status: This view connects delivered value with completion status. It helps teams see how much value is tied to completed or nearly completed work.
Recent Projects by Date: This view brings recent project records into the finance page. It helps teams connect new activity with billing and margin conversations.
Budget and Billing
Data Sheet
The Data Sheet is where users add architecture and design project records in the same format used by the dashboard. Keeping columns consistent is important because the dashboard pages, slicers, cards, and views rely on the structured data format.
Data Sheet tab
Architecture and Design Dashboard in Google Sheets vs. Microsoft Excel vs. Paid Project Management SaaS – Feature Comparison
| Feature | Architecture and Design Dashboard in Google Sheets | Microsoft Excel Dashboard | Paid Project Management SaaS |
|---|---|---|---|
| Cost | $9.99 one-time sale price | Template cost plus Excel access where needed | Monthly or annual subscription |
| Platform | Google Sheets in browser | Excel desktop or web | Vendor-hosted web platform |
| Setup time | Copy the sheet and replace sample rows | Open workbook and replace data | Configure workspace, users, permissions, and fields |
| Real-time team collaboration | Native Google Drive sharing | Available through Microsoft cloud sharing | Usually included by plan |
| Mobile access | Google Sheets app or browser | Excel app or browser | Vendor app or browser |
| Customizable fields | Editable sheet structure | Editable workbook structure | Limited by vendor configuration |
| Share with link | Yes, with permission controls | Yes, with compatible cloud storage | Usually account based |
| Year-1 cost at 5 users | $9.99 template price | Depends on existing licenses | Often a recurring team subscription |
| Architecture-specific reporting | Project, client, team, budget, billing, and data tabs included | Possible with custom setup | Varies by software plan |
Who Should Use This Template
This template is best for architecture firms, interior design studios, design consultants, project managers, project coordinators, and studio owners who already track work in spreadsheets and want a cleaner reporting layer. It is especially useful when a team needs to review project status, portfolio value, client mix, team capacity, and billing performance in one place.
It is not the right fit for teams that need automatic BIM integration, accounting software sync, resource approvals, client portals, proposal generation, or enterprise permissions. This is a dashboard template for structured project reporting, not a complete practice-management platform.
Real-World Use Cases
Studio owner review: A small architecture firm owner checks Portfolio Value, Active projects, On Hold work, Avg Fee, and Budget and Billing before a Monday management meeting.
Project manager delivery check: A project manager reviews Project Performance to compare delivery status, handover stage, project status, and completion rate before contacting clients.
Design operations planning: A design operations lead uses Team and Hours to compare discipline workload and capacity before assigning new work to architecture, interiors, or planning teams.
Advantages of Architecture and Design Dashboard in Google Sheets
- One file for multiple views: project, client, team, budget, billing, and data tracking live in the same template.
- Lower cost than SaaS: the $9.99 sale price is a one-time template purchase rather than a recurring per-user subscription.
- Easy collaboration: Google Sheets sharing makes it simple to give teammates view or edit access.
- Clear dashboard pages: each tab focuses on a specific management question instead of crowding every metric onto one page.
- Editable structure: teams can adapt labels and records if they understand the sheet formulas and dashboard references.
Opportunities for Improvement
- No automatic integrations: accounting systems, time-tracking tools, BIM systems, and CRM platforms do not sync automatically.
- Manual data quality matters: inconsistent status names, missing dates, and mixed currencies can reduce reporting quality.
- Not a workflow approval system: approvals, permissions, client portals, and automated notifications require separate tools or custom development.
Best Practices
- Keep the Data Sheet column headers and structure intact unless you are comfortable updating formulas and dashboard references.
- Use consistent naming for project status, delivery status, site status, client type, discipline, and style.
- Check dates and currency fields before using the dashboard for billing or margin review.
- Give most users viewer access and limit editor access to the people responsible for maintaining the data.
- Create a backup copy before making major structural changes to the workbook.
Explore Relevant Templates
Looking for more Google Sheets dashboards and project tracking templates? These related products may also help:
- Interior Design KPI Dashboard in Google Sheets
- Construction Project Cost Dashboard in Google Sheets
- Project Task Management Dashboard in Google Sheets
- Browse all Google Sheets dashboard templates
Frequently Asked Questions
What is the Architecture and Design Dashboard in Google Sheets?
It is a ready-to-use Google Sheets dashboard template for tracking architecture and design projects, portfolio value, client insights, team hours, budgets, billing, delivery status, and margins.
How many pages are included?
The template includes 6 working tabs: Overview, Project Performance, Client Insights, Team and Hours, Budget and Billing, and Data Sheet.
What KPIs are shown on the Overview page?
The Overview page includes Total, Active, Done, Hold, Portfolio Value, Projects, On Hold, Avg Fee, Status, Top Style, Currency, All-time delivery, and On-Site Projects.
Can I add my own project records?
Yes. Add your records into the Data Sheet using the same structure as the sample data so the dashboard pages continue to update correctly.
Does this template automatically connect to accounting or project management tools?
No. The template is designed for manual entry or pasted/exported data. Automatic integrations are not included.
Can multiple users work with the dashboard?
Yes. Since it is built in Google Sheets, you can share the file through Google Drive with viewer, commenter, or editor permissions.
Who is this dashboard best for?
It is best for architecture firms, interior design studios, project managers, consultants, and design operations teams that need practical portfolio and project reporting in Google Sheets.
About the Author
Built by PK – Microsoft Certified Professional with 15+ years of Excel, Google Sheets, and Power BI experience. Founder of NextGenTemplates, reaching 300K+ subscribers across YouTube channels. Every template is hand-built and tested before release.
Conclusion
The Architecture and Design Dashboard in Google Sheets gives design teams a practical way to review portfolio value, project performance, client mix, team hours, budget movement, billing, and margin without starting from a blank spreadsheet. It is simple enough for spreadsheet users and structured enough for recurring business reviews.
Download the Architecture and Design Dashboard in Google Sheets from NextGenTemplates and start turning architecture project records into clearer decisions.
Visit our YouTube channel for dashboard walkthroughs and tutorials: YouTube.com/@NextGenTemplates
Client Value by Client Segment: This view compares value by client segment. It helps users identify high-value segments that deserve deeper relationship management.
Portfolio Value by Corporate Share: This view shows how portfolio value changes by corporate share. It helps owners understand how much of the portfolio is tied to corporate clients.
Projects by Government Work: This view separates projects based on government work. It helps firms monitor public-sector exposure and compare it with private client work.
Recent Projects by Date: This view shows newer project activity from the client perspective. It helps users connect recent records with the client mix.
Client Insights
Page 4: Team and Hours
The Team and Hours tab is built for resource review. It helps studio leads see where design hours are going, how work is distributed by discipline, and whether team capacity is aligned with current project demand.
Design Hours by Month: This view shows monthly design hours. It helps managers identify busy periods and plan future workload more carefully.
Hours by Discipline: This view compares hours across disciplines. It helps reveal whether architecture, interiors, planning, or other design work is consuming most of the team’s time.
Design Hours by Discipline: This view focuses on design-hour distribution by discipline. It helps teams understand which skills are most in demand.
Capacity by Team: This view compares capacity across teams. It supports staffing decisions when some groups are overloaded and others have room.
Architecture Load by Discipline: This view shows architecture workload by discipline. It helps leaders understand where architectural effort is concentrated.
Projects by Site Status: This view compares projects by site status from a workload angle. It helps teams see how much active site work may affect capacity.
Recent Projects by Date: This view keeps new or recently updated projects visible. It helps managers connect recent project movement to resource planning.
Team and Hours
Page 5: Budget and Billing
The Budget and Billing tab brings financial performance into the same reporting file. It helps owners and finance leads compare revenue, costs, value, margin, delivered work, and recent project activity.
Net Margin by Finance Summary: This view shows net margin by finance summary. It helps users understand whether the portfolio is producing healthy financial outcomes.
Revenue by Money Flow: This view compares revenue across money-flow categories. It helps identify how money is moving through the portfolio.
Cost by Month: This view tracks cost by month. It helps users see whether costs are rising during specific periods.
Value by Discipline: This view compares value across disciplines. It helps identify which design disciplines contribute the most value to the portfolio.
Margin by Portfolio: This view compares margin at the portfolio level. It helps owners see which parts of the portfolio are supporting profitability.
Delivered Value by Completion Status: This view connects delivered value with completion status. It helps teams see how much value is tied to completed or nearly completed work.
Recent Projects by Date: This view brings recent project records into the finance page. It helps teams connect new activity with billing and margin conversations.
Budget and Billing
Data Sheet
The Data Sheet is where users add architecture and design project records in the same format used by the dashboard. Keeping columns consistent is important because the dashboard pages, slicers, cards, and views rely on the structured data format.
Data Sheet tab
Architecture and Design Dashboard in Google Sheets vs. Microsoft Excel vs. Paid Project Management SaaS – Feature Comparison
| Feature | Architecture and Design Dashboard in Google Sheets | Microsoft Excel Dashboard | Paid Project Management SaaS |
|---|---|---|---|
| Cost | $9.99 one-time sale price | Template cost plus Excel access where needed | Monthly or annual subscription |
| Platform | Google Sheets in browser | Excel desktop or web | Vendor-hosted web platform |
| Setup time | Copy the sheet and replace sample rows | Open workbook and replace data | Configure workspace, users, permissions, and fields |
| Real-time team collaboration | Native Google Drive sharing | Available through Microsoft cloud sharing | Usually included by plan |
| Mobile access | Google Sheets app or browser | Excel app or browser | Vendor app or browser |
| Customizable fields | Editable sheet structure | Editable workbook structure | Limited by vendor configuration |
| Share with link | Yes, with permission controls | Yes, with compatible cloud storage | Usually account based |
| Year-1 cost at 5 users | $9.99 template price | Depends on existing licenses | Often a recurring team subscription |
| Architecture-specific reporting | Project, client, team, budget, billing, and data tabs included | Possible with custom setup | Varies by software plan |
Who Should Use This Template
This template is best for architecture firms, interior design studios, design consultants, project managers, project coordinators, and studio owners who already track work in spreadsheets and want a cleaner reporting layer. It is especially useful when a team needs to review project status, portfolio value, client mix, team capacity, and billing performance in one place.
It is not the right fit for teams that need automatic BIM integration, accounting software sync, resource approvals, client portals, proposal generation, or enterprise permissions. This is a dashboard template for structured project reporting, not a complete practice-management platform.
Real-World Use Cases
Studio owner review: A small architecture firm owner checks Portfolio Value, Active projects, On Hold work, Avg Fee, and Budget and Billing before a Monday management meeting.
Project manager delivery check: A project manager reviews Project Performance to compare delivery status, handover stage, project status, and completion rate before contacting clients.
Design operations planning: A design operations lead uses Team and Hours to compare discipline workload and capacity before assigning new work to architecture, interiors, or planning teams.
Advantages of Architecture and Design Dashboard in Google Sheets
- One file for multiple views: project, client, team, budget, billing, and data tracking live in the same template.
- Lower cost than SaaS: the $9.99 sale price is a one-time template purchase rather than a recurring per-user subscription.
- Easy collaboration: Google Sheets sharing makes it simple to give teammates view or edit access.
- Clear dashboard pages: each tab focuses on a specific management question instead of crowding every metric onto one page.
- Editable structure: teams can adapt labels and records if they understand the sheet formulas and dashboard references.
Opportunities for Improvement
- No automatic integrations: accounting systems, time-tracking tools, BIM systems, and CRM platforms do not sync automatically.
- Manual data quality matters: inconsistent status names, missing dates, and mixed currencies can reduce reporting quality.
- Not a workflow approval system: approvals, permissions, client portals, and automated notifications require separate tools or custom development.
Best Practices
- Keep the Data Sheet column headers and structure intact unless you are comfortable updating formulas and dashboard references.
- Use consistent naming for project status, delivery status, site status, client type, discipline, and style.
- Check dates and currency fields before using the dashboard for billing or margin review.
- Give most users viewer access and limit editor access to the people responsible for maintaining the data.
- Create a backup copy before making major structural changes to the workbook.
Explore Relevant Templates
Looking for more Google Sheets dashboards and project tracking templates? These related products may also help:
- Interior Design KPI Dashboard in Google Sheets
- Construction Project Cost Dashboard in Google Sheets
- Project Task Management Dashboard in Google Sheets
- Browse all Google Sheets dashboard templates
Frequently Asked Questions
What is the Architecture and Design Dashboard in Google Sheets?
It is a ready-to-use Google Sheets dashboard template for tracking architecture and design projects, portfolio value, client insights, team hours, budgets, billing, delivery status, and margins.
How many pages are included?
The template includes 6 working tabs: Overview, Project Performance, Client Insights, Team and Hours, Budget and Billing, and Data Sheet.
What KPIs are shown on the Overview page?
The Overview page includes Total, Active, Done, Hold, Portfolio Value, Projects, On Hold, Avg Fee, Status, Top Style, Currency, All-time delivery, and On-Site Projects.
Can I add my own project records?
Yes. Add your records into the Data Sheet using the same structure as the sample data so the dashboard pages continue to update correctly.
Does this template automatically connect to accounting or project management tools?
No. The template is designed for manual entry or pasted/exported data. Automatic integrations are not included.
Can multiple users work with the dashboard?
Yes. Since it is built in Google Sheets, you can share the file through Google Drive with viewer, commenter, or editor permissions.
Who is this dashboard best for?
It is best for architecture firms, interior design studios, project managers, consultants, and design operations teams that need practical portfolio and project reporting in Google Sheets.
About the Author
Built by PK – Microsoft Certified Professional with 15+ years of Excel, Google Sheets, and Power BI experience. Founder of NextGenTemplates, reaching 300K+ subscribers across YouTube channels. Every template is hand-built and tested before release.
Conclusion
The Architecture and Design Dashboard in Google Sheets gives design teams a practical way to review portfolio value, project performance, client mix, team hours, budget movement, billing, and margin without starting from a blank spreadsheet. It is simple enough for spreadsheet users and structured enough for recurring business reviews.
Download the Architecture and Design Dashboard in Google Sheets from NextGenTemplates and start turning architecture project records into clearer decisions.
Visit our YouTube channel for dashboard walkthroughs and tutorials: YouTube.com/@NextGenTemplates
Download the Architecture and Design Dashboard in Google Sheets from NextGenTemplates and start turning architecture project records into clearer decisions.
Visit our YouTube channel for dashboard walkthroughs and tutorials:
The Architecture and Design Dashboard in Google Sheets is a ready-to-use reporting template for studios that need project, client, team, budget, billing, and portfolio visibility in one editable spreadsheet. The file includes 6 working tabs, 5 dashboard pages, 13 overview KPI cards, and 34 analysis views, giving architecture firms and design teams a cleaner way to review work without building a dashboard from scratch.
This dashboard is built for teams that already keep project data in spreadsheets, exported reports, or manual trackers. Instead of jumping between separate project status lists, billing files, client summaries, and timesheet views, you can add records into the Data Sheet and review the full picture from the dashboard tabs. Because it is built in Google Sheets, it also supports familiar sharing and collaboration workflows through Google Drive. Google provides more details on Sheets collaboration in its official Google Docs Editors Help guide.
Click here to purchase the Architecture and Design Dashboard in Google Sheets
Key Features of Architecture and Design Dashboard in Google Sheets
- 6 connected sheet tabs covering Overview, Project Performance, Client Insights, Team and Hours, Budget and Billing, and Data Sheet.
- 13 overview cards for Total, Active, Done, Hold, Portfolio Value, Projects, On Hold, Avg Fee, Status, Top Style, Currency, All-time delivery, and On-Site Projects.
- 34 analysis views for project status, pipeline stage, delivery status, handover stage, client type, client segment, design hours, team capacity, revenue, cost, and margin.
- Slicers and filters help users focus the dashboard by project, client, date, status, design style, site status, discipline, and finance-related fields where available.Architecture and Design Dashboard in Google Sheets
- Editable data structure lets teams replace sample records with real architecture and design project data.Architecture and Design Dashboard in Google Sheets
- Google Sheets format makes it suitable for teams that want a shareable file instead of a locked reporting system.Architecture and Design Dashboard in Google Sheets
Dashboard Pages Explanation
The dashboard is organized into focused pages so users can start with a high-level view and then move into project, client, team, and finance analysis. Each page has its own purpose, but the structure stays consistent so users can move through the file quickly during review meetings.
Page 1: Overview
The Overview page is the executive summary for the architecture and design portfolio. At the top, KPI cards show Total, Active, Done, Hold, Portfolio Value, Projects, On Hold, Avg Fee, Status, Top Style, Currency, All-time delivery, and On-Site Projects.
Portfolio Value by Month: This view shows how total project value changes month by month. It helps owners see whether the portfolio is growing, slowing, or becoming concentrated in certain periods.
Projects by Style: This view compares projects by design style. It helps studios understand whether demand is leaning toward a particular architectural or interior design direction.
Portfolio Value by Segment: This view breaks value across business or client segments. It helps teams identify which segments contribute the most to the current pipeline.
Projects by Delivery Status: This view groups projects by delivery status. It helps project managers spot how much work is active, completed, pending, or delayed.
Projects by Site Status: This view separates projects by site activity. It helps teams understand which projects are on-site and which are still in design, planning, or non-site phases.
Recent Projects by Date: This view highlights the latest project records by date. It makes recent updates visible without asking users to search the Data Sheet manually.
Architecture and Design Dashboard in Google Sheets
Page 2: Project Performance
The Project Performance tab focuses on status, pipeline movement, handover progress, and completion behavior. It is useful for weekly operations meetings, client delivery reviews, and project manager check-ins.
Active Portfolio by Project Status: This view shows active portfolio value or workload by current project status. It helps identify whether the active portfolio is concentrated in one stage.
Project Count by Month: This view tracks the number of projects over time. It helps studios understand project volume trends and seasonality.
Projects by Status: This view groups the full project list by status. It provides a quick view of active, done, hold, and other project categories.
Project Value by Pipeline Stage: This view compares project value across pipeline stages. It helps leaders see where revenue potential is sitting before delivery is complete.
Completion Rate by Delivery Status: This view connects completion rate with delivery status. It helps teams compare delivery progress across different status groups.
Projects by Handover Stage: This view groups projects by handover stage. It helps identify which projects are close to client delivery and which still need completion work.
Recent Projects by Date: This view keeps recent project movement visible. It is helpful when reviewing what changed since the last internal meeting.
Project Performance
Page 3: Client Insights
The Client Insights tab helps users understand the client side of the portfolio. It is especially useful for owners, business development leads, and account managers who want to see whether value is coming from corporate, government, or other client segments.
Corporate Value by Client Type: This view compares corporate value across client types. It helps teams understand which client groups are contributing the most corporate work.
Client Value by Month: This view shows client value over time. It helps identify months with stronger client contribution and periods that may need follow-up activity.
Projects by Client Type: This view counts projects by client type. It helps studios see whether their workload is balanced across client groups.
Client Value by Client Segment: This view compares value by client segment. It helps users identify high-value segments that deserve deeper relationship management.
Portfolio Value by Corporate Share: This view shows how portfolio value changes by corporate share. It helps owners understand how much of the portfolio is tied to corporate clients.
Projects by Government Work: This view separates projects based on government work. It helps firms monitor public-sector exposure and compare it with private client work.
Recent Projects by Date: This view shows newer project activity from the client perspective. It helps users connect recent records with the client mix.
Client Insights
Page 4: Team and Hours
The Team and Hours tab is built for resource review. It helps studio leads see where design hours are going, how work is distributed by discipline, and whether team capacity is aligned with current project demand.
Design Hours by Month: This view shows monthly design hours. It helps managers identify busy periods and plan future workload more carefully.
Hours by Discipline: This view compares hours across disciplines. It helps reveal whether architecture, interiors, planning, or other design work is consuming most of the team’s time.
Design Hours by Discipline: This view focuses on design-hour distribution by discipline. It helps teams understand which skills are most in demand.
Capacity by Team: This view compares capacity across teams. It supports staffing decisions when some groups are overloaded and others have room.
Architecture Load by Discipline: This view shows architecture workload by discipline. It helps leaders understand where architectural effort is concentrated.
Projects by Site Status: This view compares projects by site status from a workload angle. It helps teams see how much active site work may affect capacity.
Recent Projects by Date: This view keeps new or recently updated projects visible. It helps managers connect recent project movement to resource planning.
Team and Hours
Page 5: Budget and Billing
The Budget and Billing tab brings financial performance into the same reporting file. It helps owners and finance leads compare revenue, costs, value, margin, delivered work, and recent project activity.
Net Margin by Finance Summary: This view shows net margin by finance summary. It helps users understand whether the portfolio is producing healthy financial outcomes.
Revenue by Money Flow: This view compares revenue across money-flow categories. It helps identify how money is moving through the portfolio.
Cost by Month: This view tracks cost by month. It helps users see whether costs are rising during specific periods.
Value by Discipline: This view compares value across disciplines. It helps identify which design disciplines contribute the most value to the portfolio.
Margin by Portfolio: This view compares margin at the portfolio level. It helps owners see which parts of the portfolio are supporting profitability.
Delivered Value by Completion Status: This view connects delivered value with completion status. It helps teams see how much value is tied to completed or nearly completed work.
Recent Projects by Date: This view brings recent project records into the finance page. It helps teams connect new activity with billing and margin conversations.
Budget and Billing
Data Sheet
The Data Sheet is where users add architecture and design project records in the same format used by the dashboard. Keeping columns consistent is important because the dashboard pages, slicers, cards, and views rely on the structured data format.
Data Sheet tab
Architecture and Design Dashboard in Google Sheets vs. Microsoft Excel vs. Paid Project Management SaaS – Feature Comparison
| Feature | Architecture and Design Dashboard in Google Sheets | Microsoft Excel Dashboard | Paid Project Management SaaS |
|---|---|---|---|
| Cost | $9.99 one-time sale price | Template cost plus Excel access where needed | Monthly or annual subscription |
| Platform | Google Sheets in browser | Excel desktop or web | Vendor-hosted web platform |
| Setup time | Copy the sheet and replace sample rows | Open workbook and replace data | Configure workspace, users, permissions, and fields |
| Real-time team collaboration | Native Google Drive sharing | Available through Microsoft cloud sharing | Usually included by plan |
| Mobile access | Google Sheets app or browser | Excel app or browser | Vendor app or browser |
| Customizable fields | Editable sheet structure | Editable workbook structure | Limited by vendor configuration |
| Share with link | Yes, with permission controls | Yes, with compatible cloud storage | Usually account based |
| Year-1 cost at 5 users | $9.99 template price | Depends on existing licenses | Often a recurring team subscription |
| Architecture-specific reporting | Project, client, team, budget, billing, and data tabs included | Possible with custom setup | Varies by software plan |
Who Should Use This Template
This template is best for architecture firms, interior design studios, design consultants, project managers, project coordinators, and studio owners who already track work in spreadsheets and want a cleaner reporting layer. It is especially useful when a team needs to review project status, portfolio value, client mix, team capacity, and billing performance in one place.
It is not the right fit for teams that need automatic BIM integration, accounting software sync, resource approvals, client portals, proposal generation, or enterprise permissions. This is a dashboard template for structured project reporting, not a complete practice-management platform.
Real-World Use Cases
Studio owner review: A small architecture firm owner checks Portfolio Value, Active projects, On Hold work, Avg Fee, and Budget and Billing before a Monday management meeting.
Project manager delivery check: A project manager reviews Project Performance to compare delivery status, handover stage, project status, and completion rate before contacting clients.
Design operations planning: A design operations lead uses Team and Hours to compare discipline workload and capacity before assigning new work to architecture, interiors, or planning teams.
Advantages of Architecture and Design Dashboard in Google Sheets
- One file for multiple views: project, client, team, budget, billing, and data tracking live in the same template.
- Lower cost than SaaS: the $9.99 sale price is a one-time template purchase rather than a recurring per-user subscription.
- Easy collaboration: Google Sheets sharing makes it simple to give teammates view or edit access.
- Clear dashboard pages: each tab focuses on a specific management question instead of crowding every metric onto one page.
- Editable structure: teams can adapt labels and records if they understand the sheet formulas and dashboard references.
Opportunities for Improvement
- No automatic integrations: accounting systems, time-tracking tools, BIM systems, and CRM platforms do not sync automatically.
- Manual data quality matters: inconsistent status names, missing dates, and mixed currencies can reduce reporting quality.
- Not a workflow approval system: approvals, permissions, client portals, and automated notifications require separate tools or custom development.
Best Practices
- Keep the Data Sheet column headers and structure intact unless you are comfortable updating formulas and dashboard references.
- Use consistent naming for project status, delivery status, site status, client type, discipline, and style.
- Check dates and currency fields before using the dashboard for billing or margin review.
- Give most users viewer access and limit editor access to the people responsible for maintaining the data.
- Create a backup copy before making major structural changes to the workbook.
Explore Relevant Templates
Looking for more Google Sheets dashboards and project tracking templates? These related products may also help:
- Interior Design KPI Dashboard in Google Sheets
- Construction Project Cost Dashboard in Google Sheets
- Project Task Management Dashboard in Google Sheets
- Browse all Google Sheets dashboard templates
Frequently Asked Questions
What is the Architecture and Design Dashboard in Google Sheets?
It is a ready-to-use Google Sheets dashboard template for tracking architecture and design projects, portfolio value, client insights, team hours, budgets, billing, delivery status, and margins.
How many pages are included?
The template includes 6 working tabs: Overview, Project Performance, Client Insights, Team and Hours, Budget and Billing, and Data Sheet.
What KPIs are shown on the Overview page?
The Overview page includes Total, Active, Done, Hold, Portfolio Value, Projects, On Hold, Avg Fee, Status, Top Style, Currency, All-time delivery, and On-Site Projects.
Can I add my own project records?
Yes. Add your records into the Data Sheet using the same structure as the sample data so the dashboard pages continue to update correctly.
Does this template automatically connect to accounting or project management tools?
No. The template is designed for manual entry or pasted/exported data. Automatic integrations are not included.
Can multiple users work with the dashboard?
Yes. Since it is built in Google Sheets, you can share the file through Google Drive with viewer, commenter, or editor permissions.
Who is this dashboard best for?
It is best for architecture firms, interior design studios, project managers, consultants, and design operations teams that need practical portfolio and project reporting in Google Sheets.
About the Author
Built by PK – Microsoft Certified Professional with 15+ years of Excel, Google Sheets, and Power BI experience. Founder of NextGenTemplates, reaching 300K+ subscribers across YouTube channels. Every template is hand-built and tested before release.
Conclusion
The Architecture and Design Dashboard in Google Sheets gives design teams a practical way to review portfolio value, project performance, client mix, team hours, budget movement, billing, and margin without starting from a blank spreadsheet. It is simple enough for spreadsheet users and structured enough for recurring business reviews.
Download the Architecture and Design Dashboard in Google Sheets from NextGenTemplates and start turning architecture project records into clearer decisions.
Visit our YouTube channel for dashboard walkthroughs and tutorials:Architecture and Design Dashboard in Google Sheets YouTube.com/@NextGenTemplates