The Advertising Dashboard in Google Sheets turns one campaign table into five dashboard pages plus a Data Sheet, covering spend, impressions, clicks, leads, conversions, revenue, ROAS and ROI by campaign, channel group, device and objective. Instead of copying numbers between ad platform exports and slide decks, your team keeps one editable reporting file and uses slicers to answer specific questions.
Each page (Overview, Campaign Performance, Channel Analysis, Audience Insights and Budget & ROI) opens with four KPI cards and a donut chart, followed by a monthly trend chart and panels for recent campaigns, the team’s upcoming schedule and news and events. This guide explains every page, the KPIs and how they are calculated, and where the template fits against Excel or paid marketing software.
🎥 Watch the Video Tutorial
Key Features of the Advertising Dashboard in Google Sheets
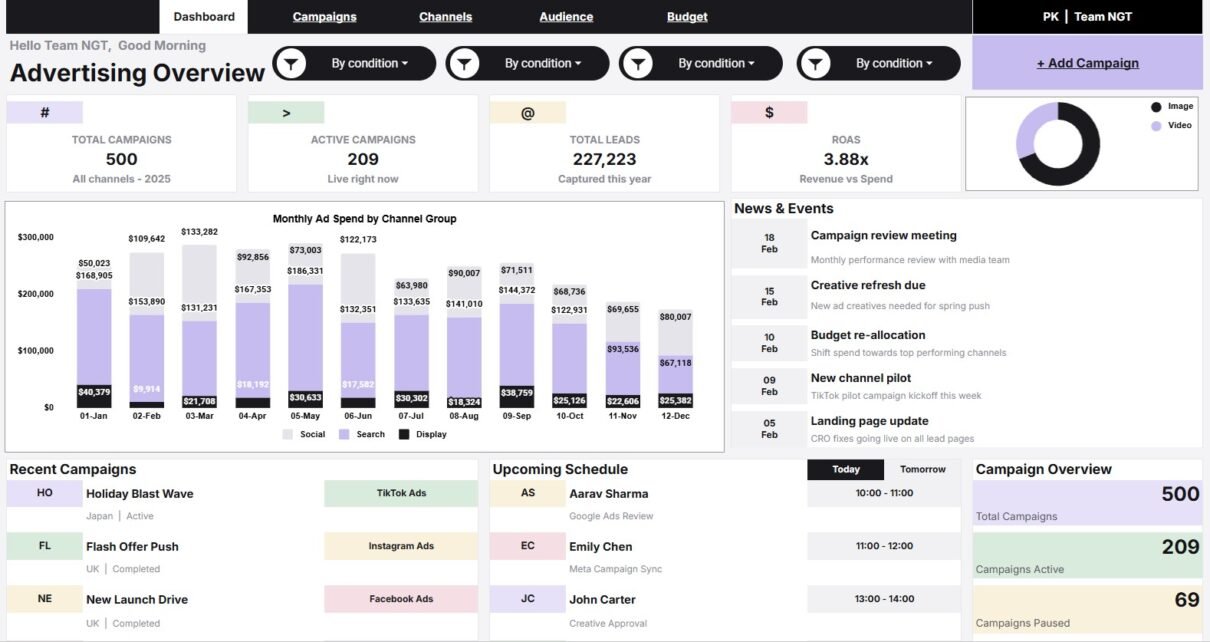
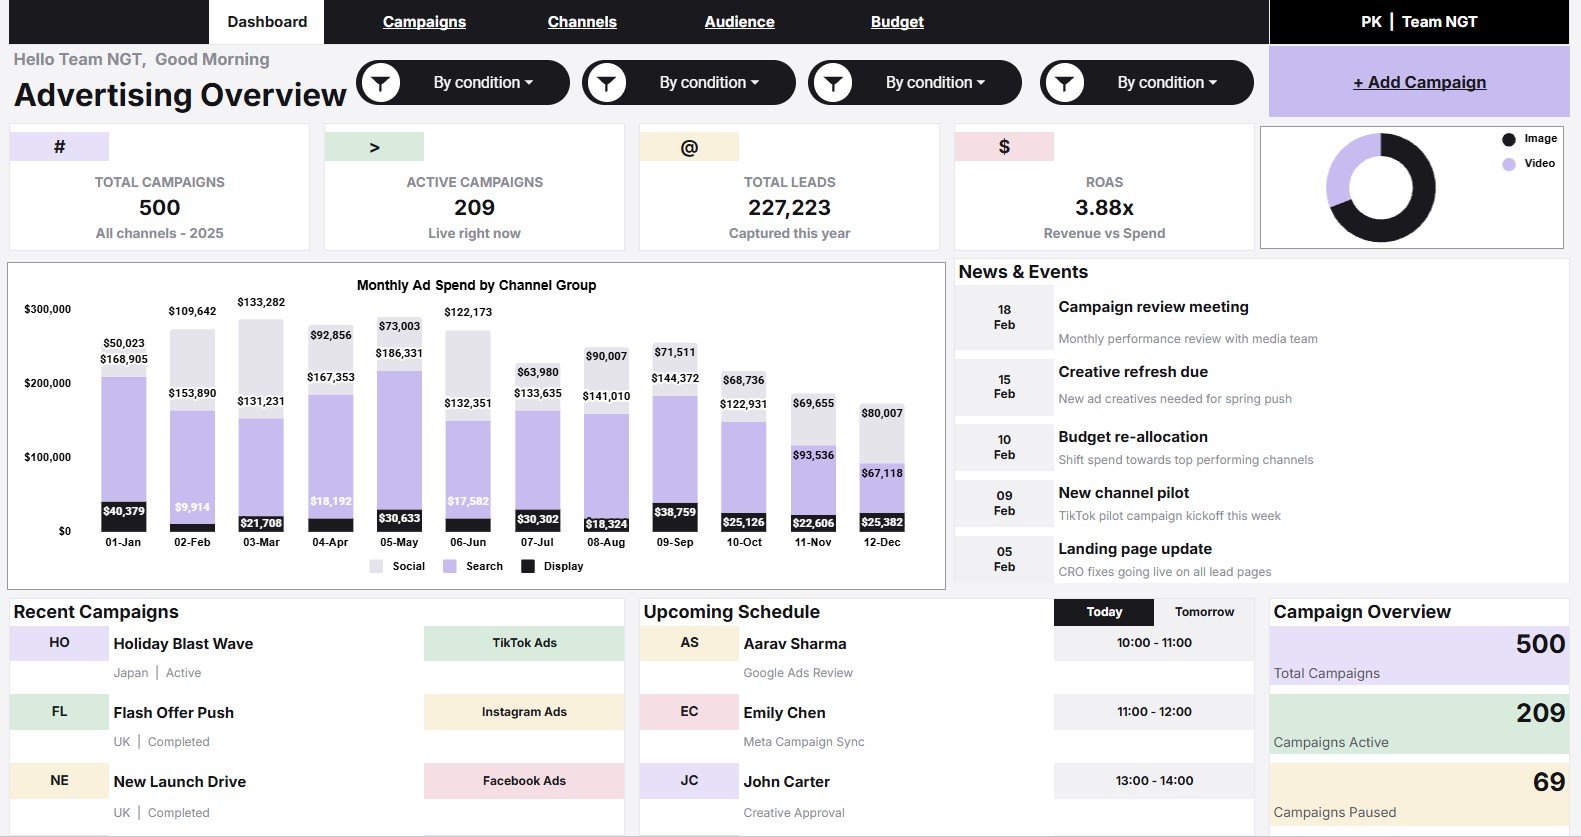
- Overview page: Total Campaigns, Active Campaigns, Total Leads and ROAS cards, monthly ad spend by channel group, and campaign, schedule and news panels.
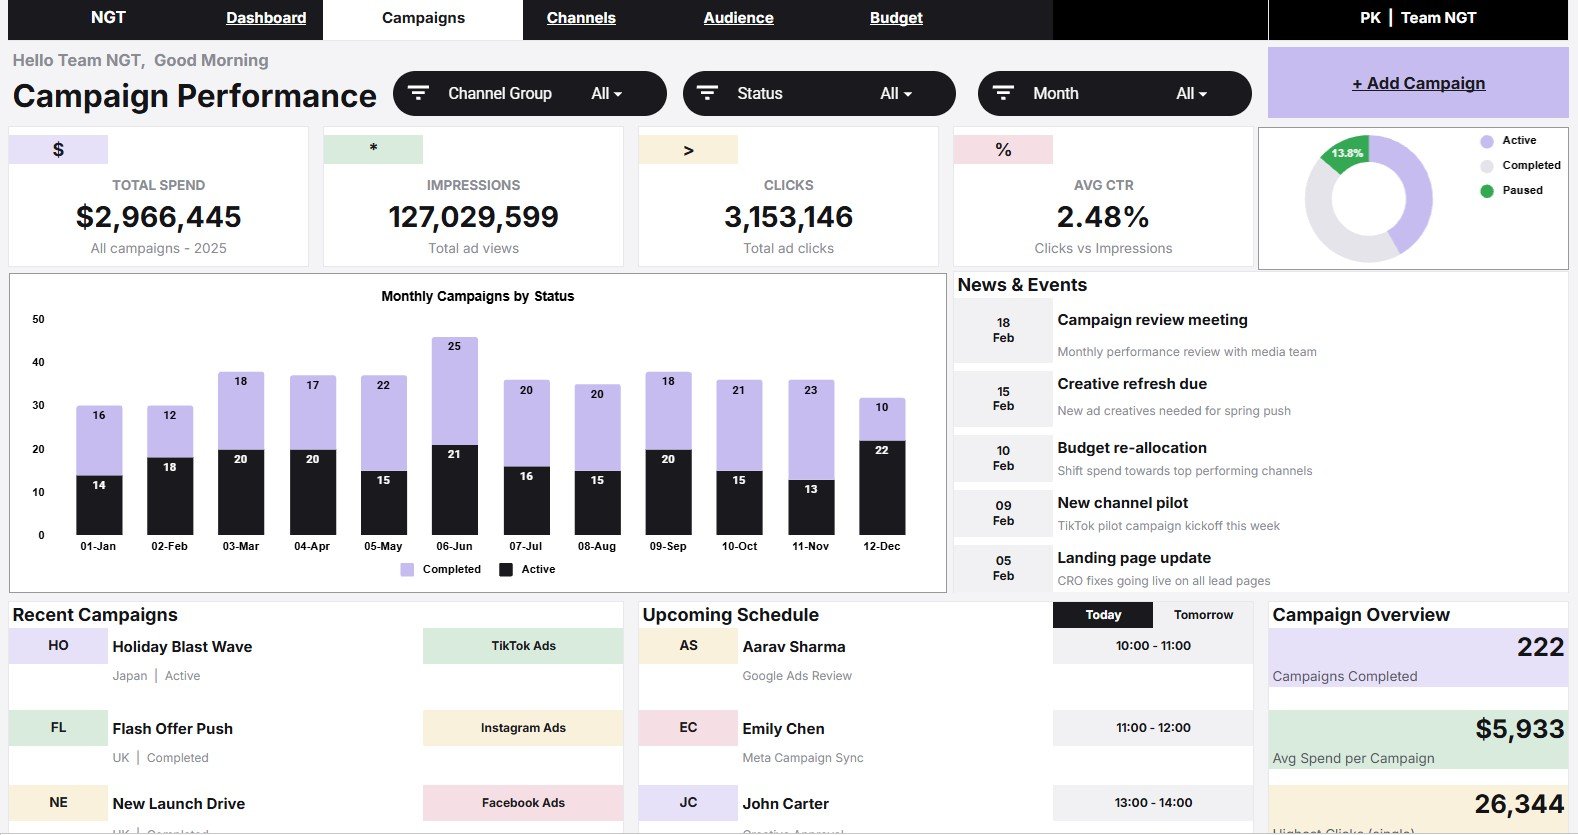
- Campaign Performance page: spend, impressions, clicks and CTR, with campaign status analysis.
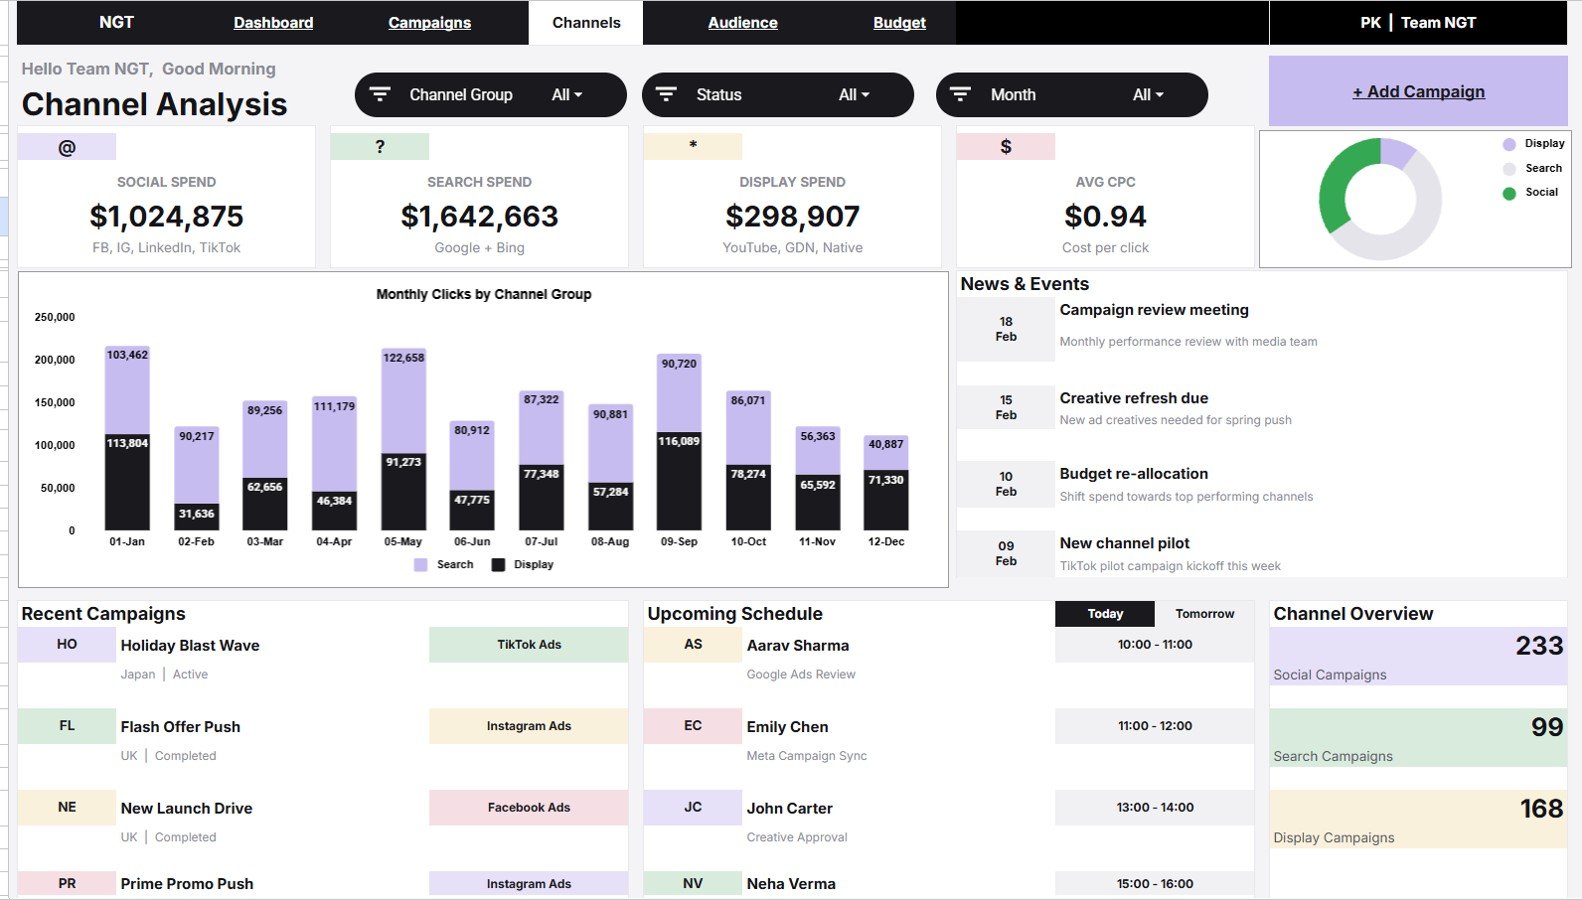
- Channel Analysis page: Social, Search and Display spend, average CPC and monthly clicks by channel group.
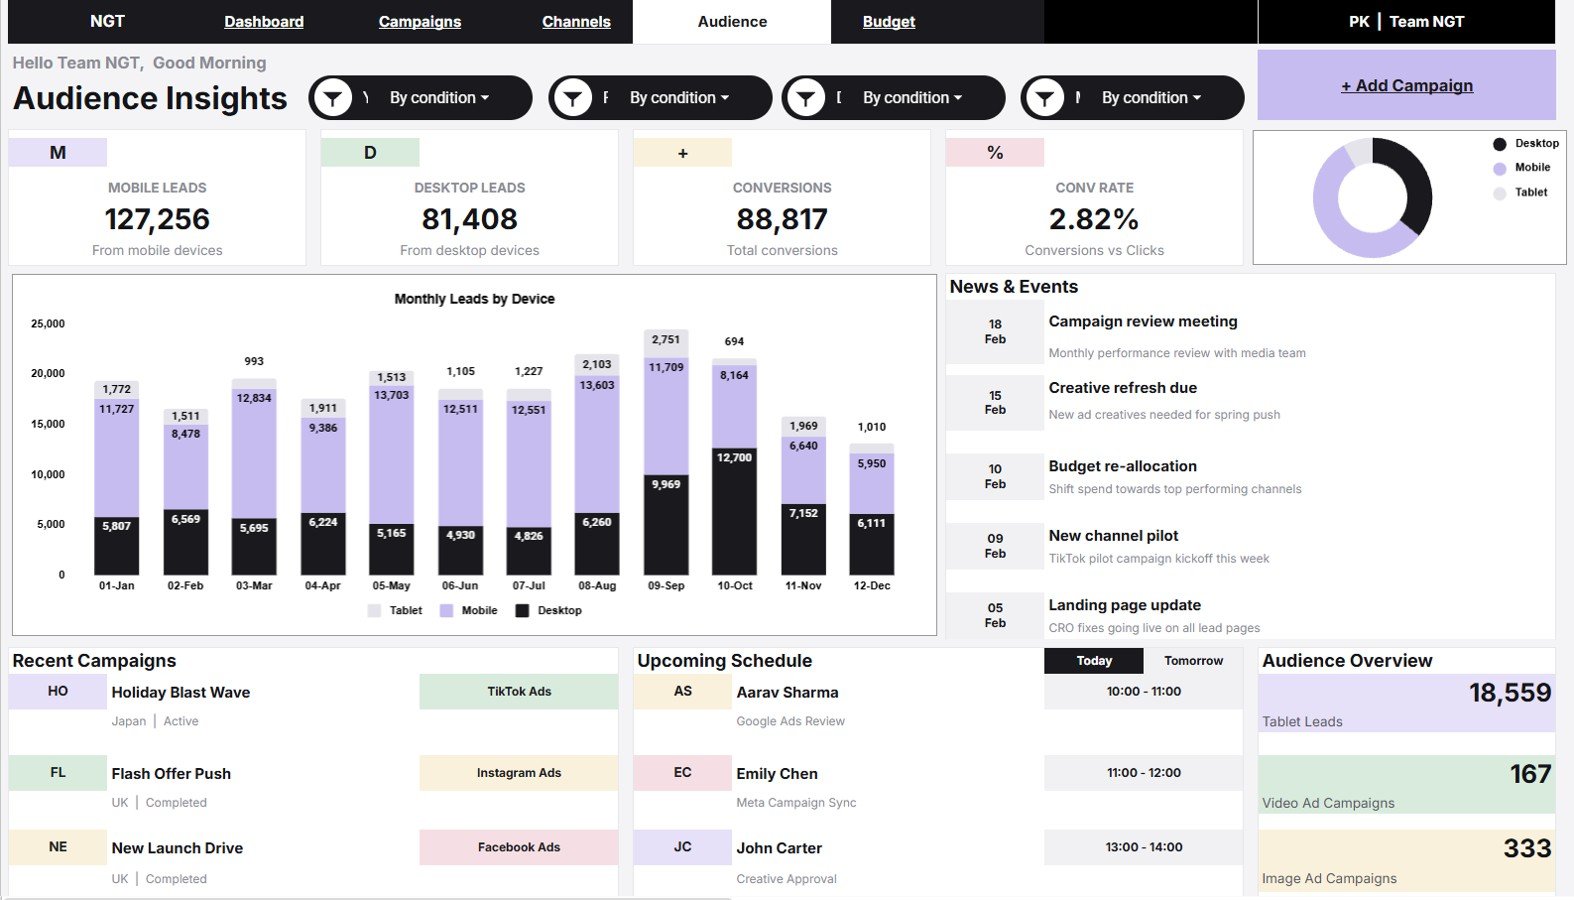
- Audience Insights page: mobile and desktop leads, conversions, conversion rate and monthly leads by device.
- Budget & ROI page: total spend, revenue, net profit, ROI and spend by objective.
- Data Sheet: one row per campaign, so charts and slicers keep working when you replace the sample data.
- Google Sheets collaboration: share the file with your team while controlling access.
KPIs and How They Are Calculated
All of the formulas below reproduce the sample values shown in the template’s screenshots.
| KPI (page) | What it measures | Formula | Sample result | Better when |
|---|---|---|---|---|
| ROAS (Overview) | Revenue earned per $1 of ad spend | Revenue ÷ Spend | $11,513,939 ÷ $2,966,445 = 3.88x | Higher |
| Avg CTR (Campaign Performance) | Share of impressions that became clicks | Clicks ÷ Impressions | 3,153,146 ÷ 127,029,599 = 2.48% | Higher |
| Avg CPC (Channel Analysis) | Cost of one click | Spend ÷ Clicks | $2,966,445 ÷ 3,153,146 = $0.94 | Lower |
| Conv Rate (Audience Insights) | Share of clicks that converted | Conversions ÷ Clicks | 88,817 ÷ 3,153,146 = 2.82% | Higher |
| Net Profit (Budget & ROI) | Revenue left after ad spend | Revenue − Spend | $11,513,939 − $2,966,445 = $8,547,494 | Higher |
| ROI (Budget & ROI) | Profit per $1 of spend | Net Profit ÷ Spend | $8,547,494 ÷ $2,966,445 = 288.1% | Higher |
ROAS     = Revenue / Spend
CTR      = Clicks / Impressions
CPC      = Spend / Clicks
Conv %   = Conversions / Clicks
ROI      = (Revenue - Spend) / Spend
The other cards are simple totals and counts: Total Campaigns (500), Active Campaigns (209), Total Leads (227,223), Total Spend, Impressions, Clicks, Mobile Leads, Desktop Leads, Conversions and spend per channel group.
Dashboard Pages Explained
In the workbook’s top menu the pages appear as Dashboard, Campaigns, Channels, Audience and Budget; the headings below use each page’s on-screen title. In the sample data, campaign statuses are Active, Completed and Paused; channel groups are Social, Search and Display; objectives are Awareness, Conversion and Traffic; devices are Mobile, Desktop and Tablet; and ad formats are Image and Video.
1. Overview
The Overview page shows Total Campaigns, Active Campaigns, Total Leads and ROAS, plus a donut of campaigns by ad format.
- Monthly Ad Spend by Channel Group: monthly spend split into Social, Search and Display, so budget spikes and seasonal shifts stand out.
- Recent Campaigns: the latest campaigns with their channel (for example TikTok Ads, Instagram Ads, Facebook Ads), region and status.
- Upcoming Schedule: who on the team is doing what and when, such as a Google Ads review or a creative approval.
- Campaign Overview: total, active and paused campaign counts.
- News & Events: dated notes such as review meetings, creative refreshes and budget re-allocations.
2. Campaign Performance
This page shows Total Spend, Impressions, Clicks and Avg CTR, with slicers for Channel Group, Status and Month.
- Monthly Campaigns by Status: how many campaigns were active or completed each month.
- Campaigns by Status: a donut of Active, Completed and Paused campaigns.
- Campaign Overview panel: campaigns completed (222), average spend per campaign ($5,933, which is $2,966,445 ÷ 500) and the highest clicks for a single campaign.
3. Channel Analysis
The Channel Analysis cards show Social Spend (FB, IG, LinkedIn, TikTok), Search Spend (Google + Bing), Display Spend (YouTube, GDN, Native) and Avg CPC. In the sample they add up to the $2,966,445 total spend.
- Monthly Clicks by Channel Group: whether search or display traffic is growing or shrinking.
- Channel group donut: the split between Social, Search and Display.
- Channel Overview panel: campaign counts per group (233 Social, 99 Search and 168 Display in the sample), which you can read against each group’s spend.
4. Audience Insights
The Audience Insights cards are Mobile Leads, Desktop Leads, Conversions and Conv Rate. Mobile (127,256), desktop (81,408) and tablet (18,559) leads together make up the 227,223 total on the Overview.
- Monthly Leads by Device: device behaviour across reporting periods.
- Leads by Device: a donut showing which device category produces the most leads.
- Audience Overview panel: tablet leads and the number of video and image ad campaigns.
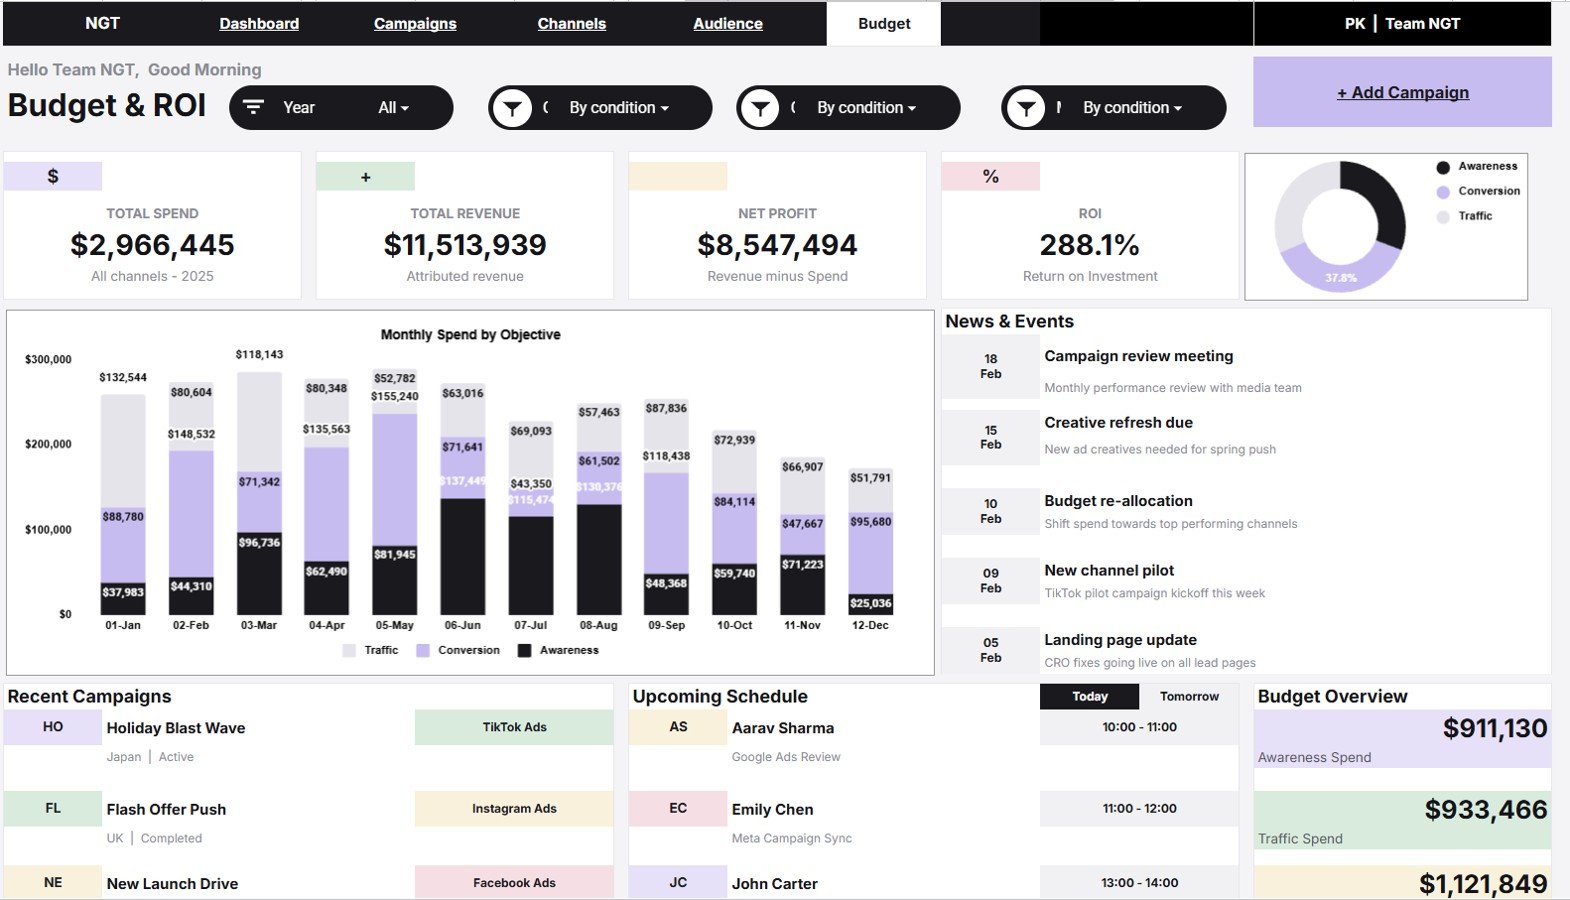
5. Budget & ROI
The Budget & ROI cards are Total Spend, Total Revenue (attributed revenue), Net Profit and ROI.
- Monthly Spend by Objective: how spend on Traffic, Conversion and Awareness changes month by month.
- Spend by Objective: each objective’s share of the budget.
- Budget Overview panel: Awareness Spend ($911,130), Traffic Spend ($933,466) and a third card for the remaining objective ($1,121,849); the three add up to the $2,966,445 total spend.
6. Data Sheet
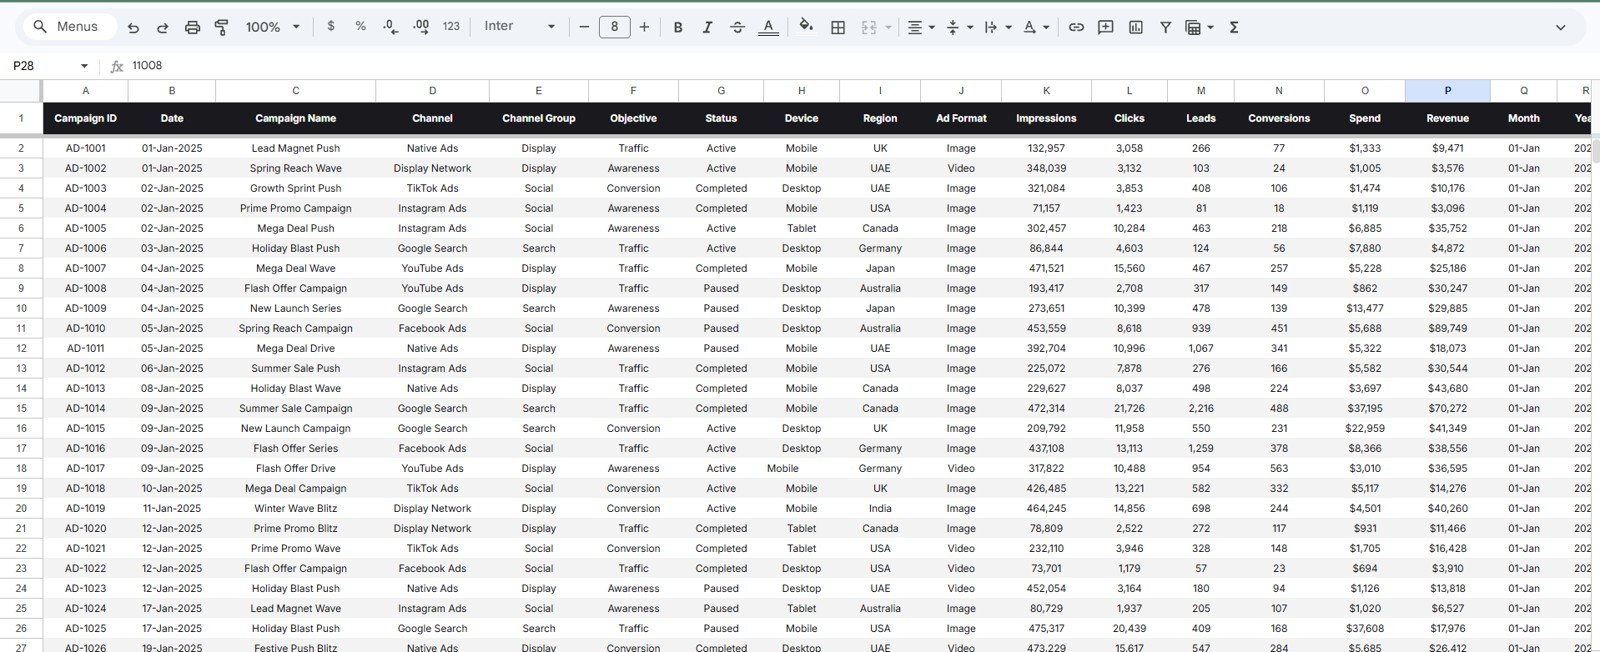
The Data Sheet is the input layer. Its columns are Campaign ID, Date, Campaign Name, Channel, Channel Group, Objective, Status, Device, Region, Ad Format, Impressions, Clicks, Leads, Conversions, Spend, Revenue, Month and Year. Add records in the same format so every card, chart and slicer stays correct.
How to Use It With Your Own Data
- Make your own copy of the file in Google Drive.
- Export campaign results from your ad platforms with impressions, clicks, leads, conversions, spend and revenue.
- Map each platform’s channel to a channel group (Social, Search or Display) and each campaign to an objective.
- Paste the rows into the Data Sheet in the same column order, then check that Total Spend matches your platform totals.
- Use the slicers to answer one question at a time, and clear them before sharing a general view.
Google Sheets vs Excel vs Paid Marketing Software
| Feature | This Google Sheets template | Excel dashboard | Paid marketing SaaS |
|---|---|---|---|
| Cost | One-time template purchase | Template cost plus Excel access | Recurring subscription and plan limits |
| Platform | Google Sheets in the browser | Excel desktop or web | Vendor-hosted platform |
| Setup | Copy file and replace sample data | Open workbook and replace data | Depends on users, permissions and integrations |
| Data import | Manual paste of platform exports | Manual or Power Query | Usually automatic connectors |
| Team collaboration | Native Google Drive sharing | With Microsoft cloud sharing | Usually included by plan |
| Customisation | Fully editable | Fully editable | Limited by product configuration |
| Best fit | Editable campaign reporting | Offline or Excel-based reporting | Automated platform workflows |
Who Should Use This Template
The template is useful for PPC specialists, marketing managers, agency account leads, freelancers, startup founders and small teams that already collect advertising data through platform exports. It works well when the team needs a clear shared reporting view but not a full ad management platform.
It is not the best fit for teams that need automatic imports from Google Ads, Meta Ads, LinkedIn Ads or programmatic platforms. It also does not replace attribution tools, budget approval workflows or enterprise access controls.
Real-World Use Cases
- PPC manager: reviews ROAS, Avg CTR and Avg CPC before the weekly marketing meeting, and uses Channel Analysis to explain whether cost changes come from budget shifts or click prices.
- Agency account lead: filters the Overview before a client recap, then uses Recent Campaigns and the Upcoming Schedule so the conversation covers both performance and execution.
- Startup founder: uses Budget & ROI to compare spend on Awareness, Traffic and Conversion before deciding what to adjust next month.
Advantages and Limitations
Campaign, channel, audience and budget views live on separate pages, so nobody has to read one crowded report. The file is transparent: you can inspect the data, formulas, chart ranges and slicers. Before sharing a campaign file, review Google’s guide to sharing files from Drive so viewers, commenters and editors get the right access.
Data entry is manual, so high-volume teams may later add Apps Script imports. ROAS, ROI and conversions depend on how revenue is attributed in your source data; add an attribution or source column if those assumptions matter.
Best Practices
- Define every input field before the first reporting cycle.
- Use consistent campaign names, channel groups, objectives, devices and ad formats.
- Check for duplicate campaign rows before reviewing totals.
- Protect formula and dashboard ranges from accidental edits.
- Limit editor access when the file contains client or budget data.
If you want to build reports like this yourself, the Excel Pivot Tables & Dashboards course on NextGenTemplates Academy covers pivots, slicers and dashboard layout step by step.
For KPI-focused alternatives, see the Advertising KPI Dashboard in Google Sheets, the Digital Advertising KPI Dashboard and the PPC Campaign KPI Dashboard. To plan campaigns before they run, the Digital Advertising Calendar in Google Sheets pairs well with this dashboard.
Related templates: Digital Advertising KPI Dashboard in Google Sheets.
Frequently Asked Questions
What is the Advertising Dashboard in Google Sheets?
It is an editable Google Sheets dashboard with Overview, Campaign Performance, Channel Analysis, Audience Insights and Budget & ROI pages, plus a Data Sheet for campaign records.
How is ROAS calculated in the template?
ROAS is revenue divided by spend. In the sample data, $11,513,939 ÷ $2,966,445 gives 3.88x.
Does the template import data automatically?
No. You add or paste data into the Data Sheet in the supplied format.
Can I track performance by channel group?
Yes. Channel Analysis shows spend for Social, Search and Display, average CPC and monthly clicks by channel group.
Can I analyse device performance?
Yes. Audience Insights shows mobile, desktop and tablet leads, conversions and monthly leads by device.
Is this suitable for agencies?
Yes. Agencies can use it for recurring client reports when they keep campaign data clean and want an editable Google Sheets view.
About the Author
Built by PK, a Microsoft Certified Professional with 15+ years of Excel, Google Sheets and Power BI experience and founder of NextGenTemplates. Every template is hand-built and tested before release.
Wrapping Up
The Advertising Dashboard in Google Sheets gives marketing teams a structured way to review spend, clicks, leads, conversions, ROAS and ROI across campaigns, channels, devices and objectives without starting from a blank spreadsheet. Paste last month’s platform exports into the Data Sheet, check the totals, and use it as the basis for your next performance review.
📅 Last updated: October 2026