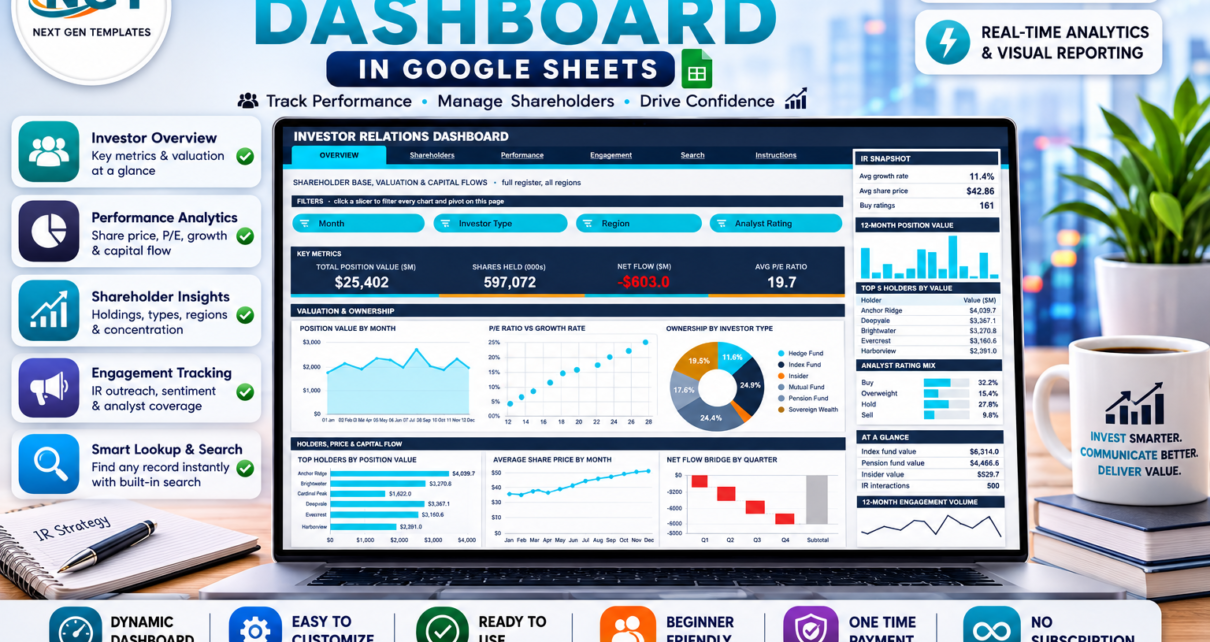
Most investor relations teams already have the numbers. What they do not have is one place to read them. The shareholder register lives in a registrar export, the meeting log lives in someone’s calendar, and the share price sits in a third file that nobody updates between board meetings. The Investor Relations Dashboard in Google Sheets pulls all three into a single sheet with six linked pages, 15 slicers, 18 charts and 16 KPI cards, all driven by native pivot tables. The demo build ships with 500 sample IR records spanning 10 institutional holders, 5 regions, 8 IR officers, 7 engagement types and 12 months of activity.Investor Relations Dashboard in Google Sheets
Get the Investor Relations Dashboard in Google Sheets
Two things to be clear about before we go further. First, every number in the screenshots below is demo data generated to show the layout working – it is not a real company’s register. Second, this is a tracking and reporting template. It records and charts the figures you type in. It does not value anything for you, it does not recommend buying or selling anything, and it makes no claim to satisfy any securities or disclosure obligation. Treat it as a reporting layer over data you already own.track investor engagement in Google Sheets
Key Features of the Investor Relations Dashboard in Google Sheets
- Native pivot tables behind every chart. There are no helper formula blocks feeding the visuals. Each chart reads a pivot parked to the right of its own page, past a wide spacer column, so you can always scroll across and see the exact numbers behind a bar.Investor Relations Dashboard in Google Sheets
- Per-page slicer strips. Overview, Shareholders and Engagement carry four slicers each; Performance carries three. A slicer filters everything on its page – charts, pivots and the ranked sidebar – and leaves the other pages alone.track investor engagement in Google Sheets
- KPI cards that stay unfiltered on purpose. The four metric cards and the At a Glance list on each page run on SUMIFS and COUNTIFS against the Data sheet. They hold the absolute total while the charts move, so you never lose the denominator.
- Four ranked Top 5 panels. Holders, regions, investor types and IR officers, each ranked by position value and paired with a percentage-share bar list.
- A record lookup page. Pick an Event ID and read all sixteen fields of that single IR record.track investor engagement in Google Sheets
- Pre-ranged to 1,000 rows. Pivots, slicers and formulas already reach row 1001, so a bigger register needs no re-ranging.track investor engagement in Google Sheets
- A one-block theme. Slate ink, cyan accent and amber second series live in one palette definition.track investor engagement in Google Sheets
Dashboard Pages Explanation
Overview – shareholder base, valuation and capital flows
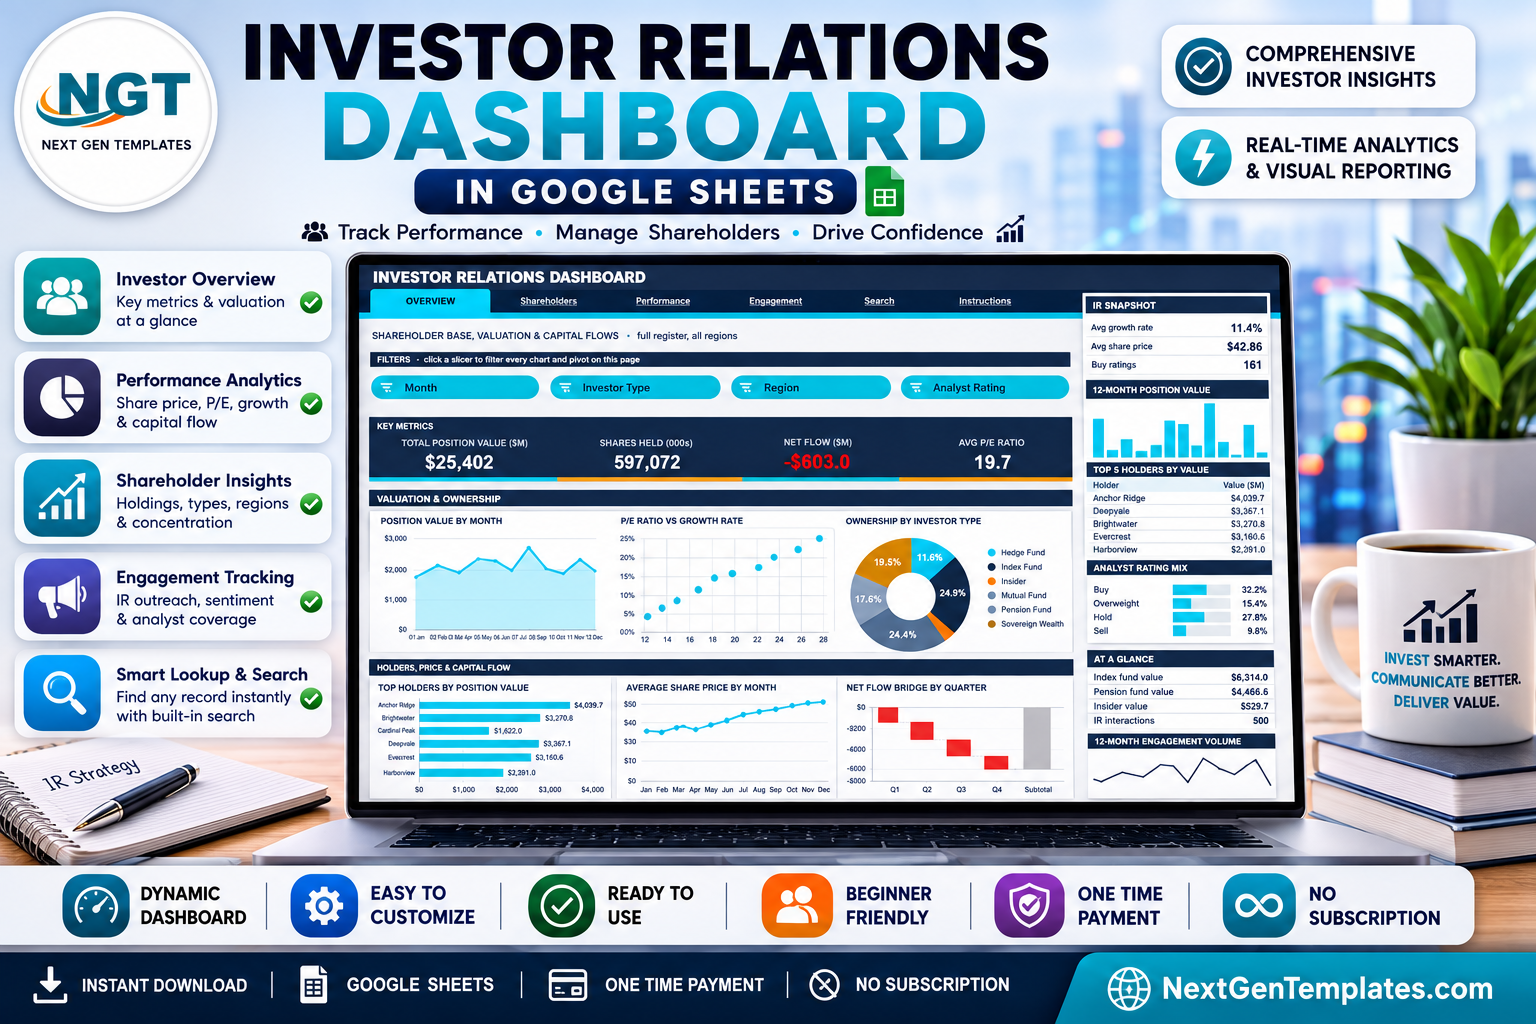
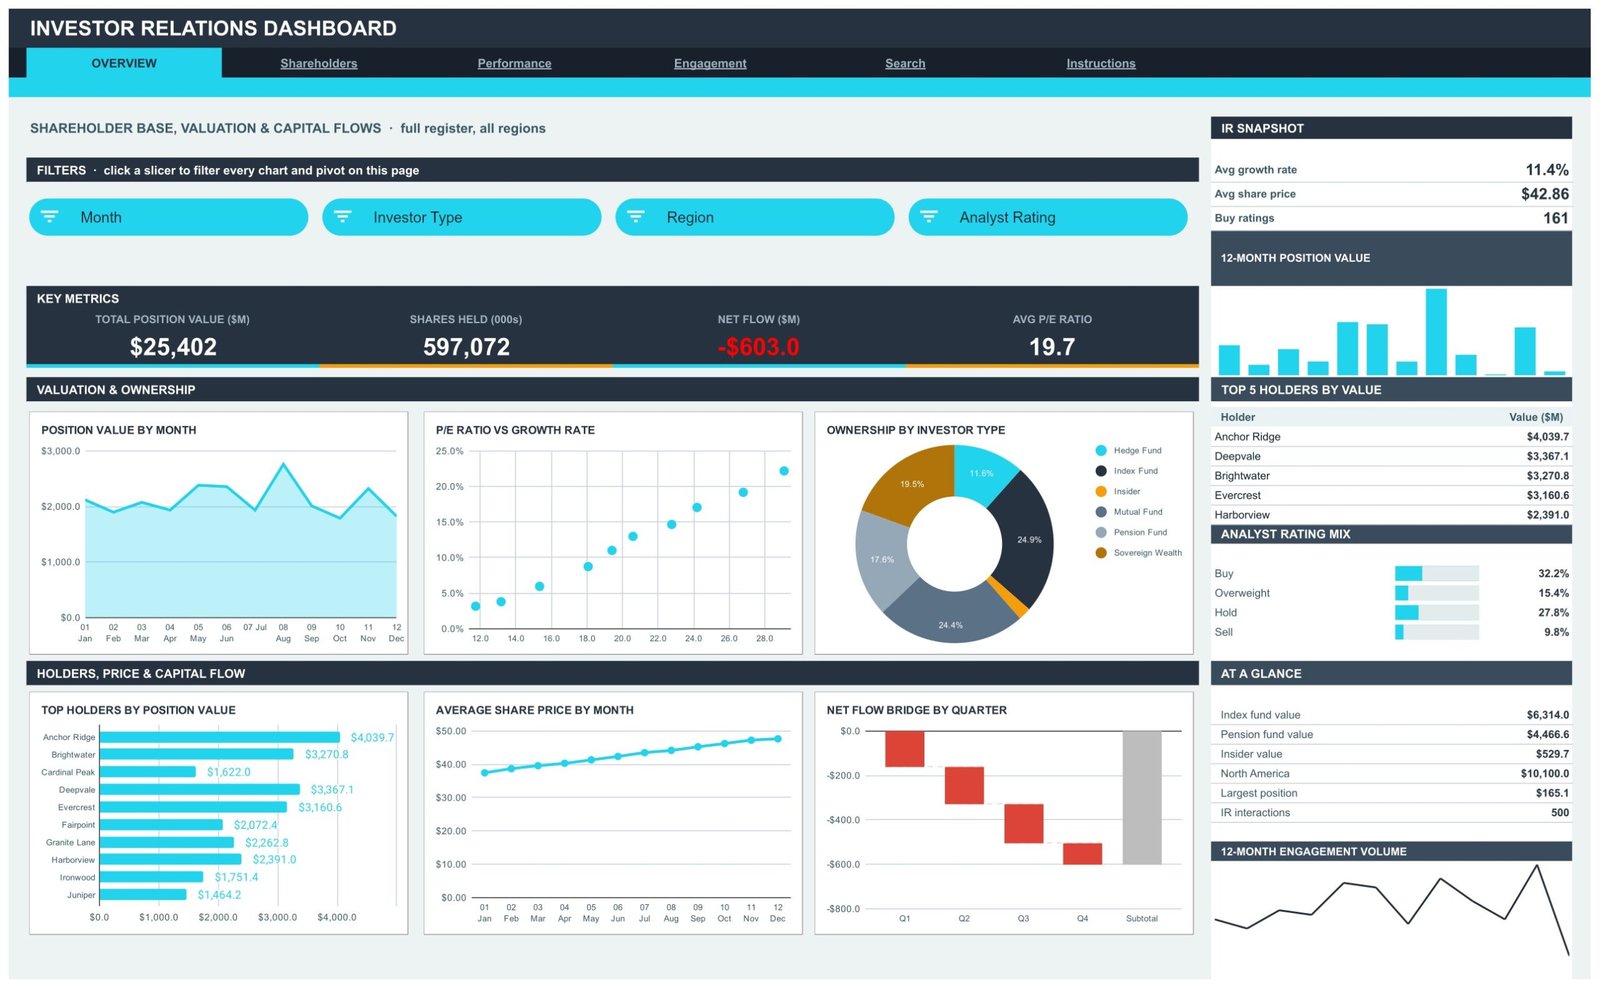
The landing page is the whole story at a glance. Four slicers sit at the top – Month, Investor Type, Region and Analyst Rating – above a Key Metrics strip carrying Total Position Value, Shares Held, Net Flow and Average P/E Ratio. In the demo data those read $25,402M, 597,072 thousand shares, a net outflow of $603.0M and an average multiple of 19.7.track investor engagement in Google Sheets
Under the cards, the Valuation & Ownership block runs Position Value by Month as an area chart, P/E Ratio vs Growth Rate as a scatter, and Ownership by Investor Type as a donut. The Holders, Price & Capital Flow block adds Top Holders by Position Value, Average Share Price by Month, and a Net Flow Bridge by Quarter drawn as a waterfall – which is the chart most IR managers reach for first, because it shows where the money left rather than just that it did.Investor Relations Dashboard in Google Sheets
The right-hand rail carries an IR Snapshot, a twelve-month position value column strip, the Top 5 Holders by Value table, an Analyst Rating Mix bar list and an At a Glance panel.track investor engagement in Google Sheets
Shareholders – register composition
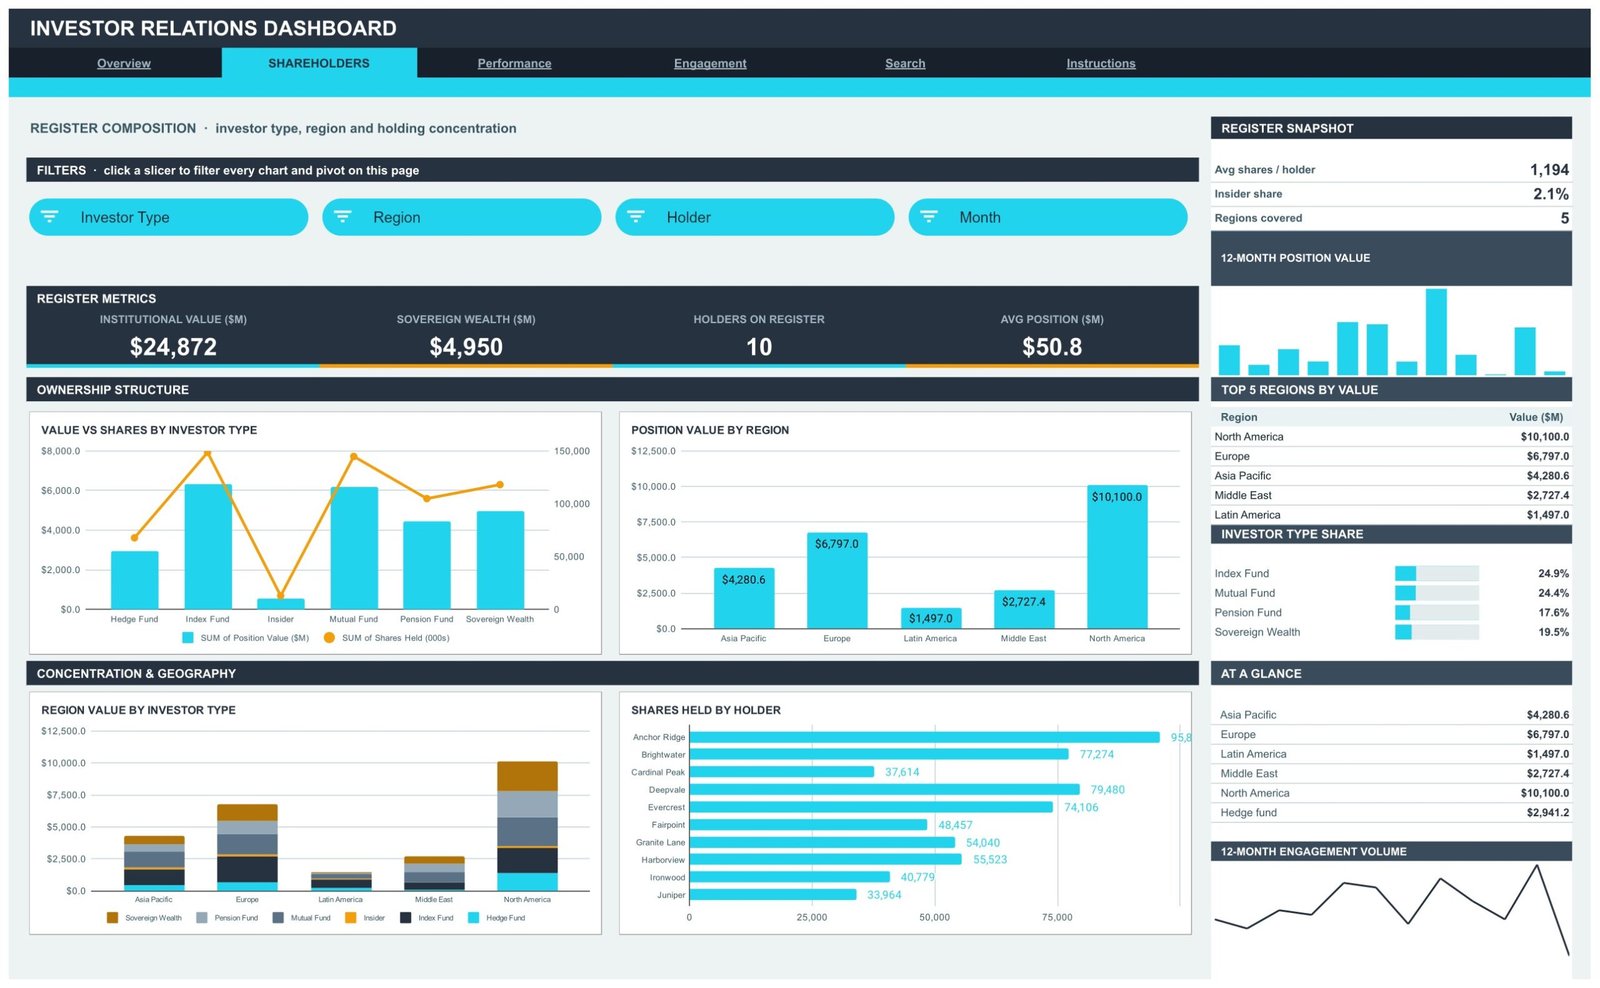
This page answers who owns what, and how concentrated that ownership is. Register Metrics report institutional value, sovereign wealth value, holders on register and average position size. Value vs Shares by Investor Type is a combo chart that puts value columns against a share-count line, which is the fastest way to spot a holder type that owns a lot of shares but not much value. Position Value by Region ranks the five regions, Region Value by Investor Type stacks the mix inside each region, and Shares Held by Holder ranks the register itself.track investor engagement in Google Sheets
Slicers here are Investor Type, Region, Holder and Month, so you can isolate one pension fund across one region in two clicks.track investor engagement in Google Sheets
Performance – share price, multiples and capital flow by period
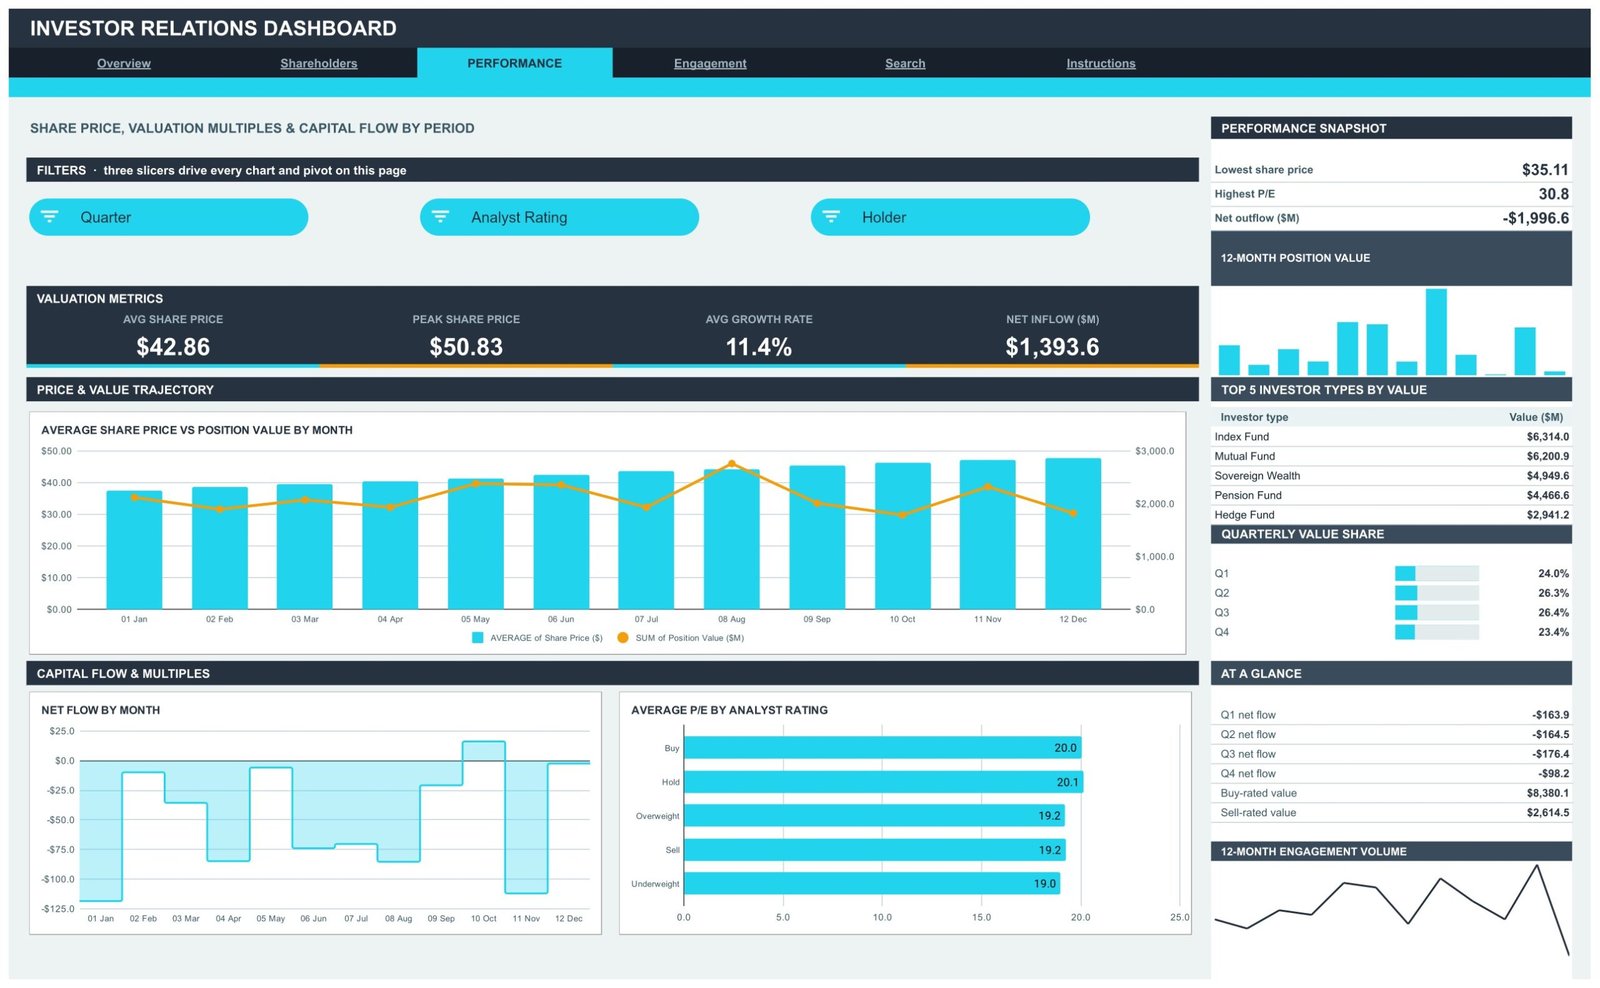
Three slicers – Quarter, Analyst Rating and Holder – drive this page. Valuation Metrics report average share price, peak share price, average growth rate and net inflow. Average Share Price vs Position Value by Month sets a price line against value columns; Net Flow by Month is drawn as a stepped area so each month reads as a discrete block rather than a smooth trend; and Average P/E by Analyst Rating compares the multiple attached to Buy, Hold, Overweight, Sell and Underweight records.track investor engagement in Google Sheets
The sidebar adds a Quarterly Value Share bar list and a per-quarter net flow readout, which is the pair most often lifted straight into a board pack.track investor engagement in Google Sheets
Engagement – IR outreach, sentiment and analyst coverage
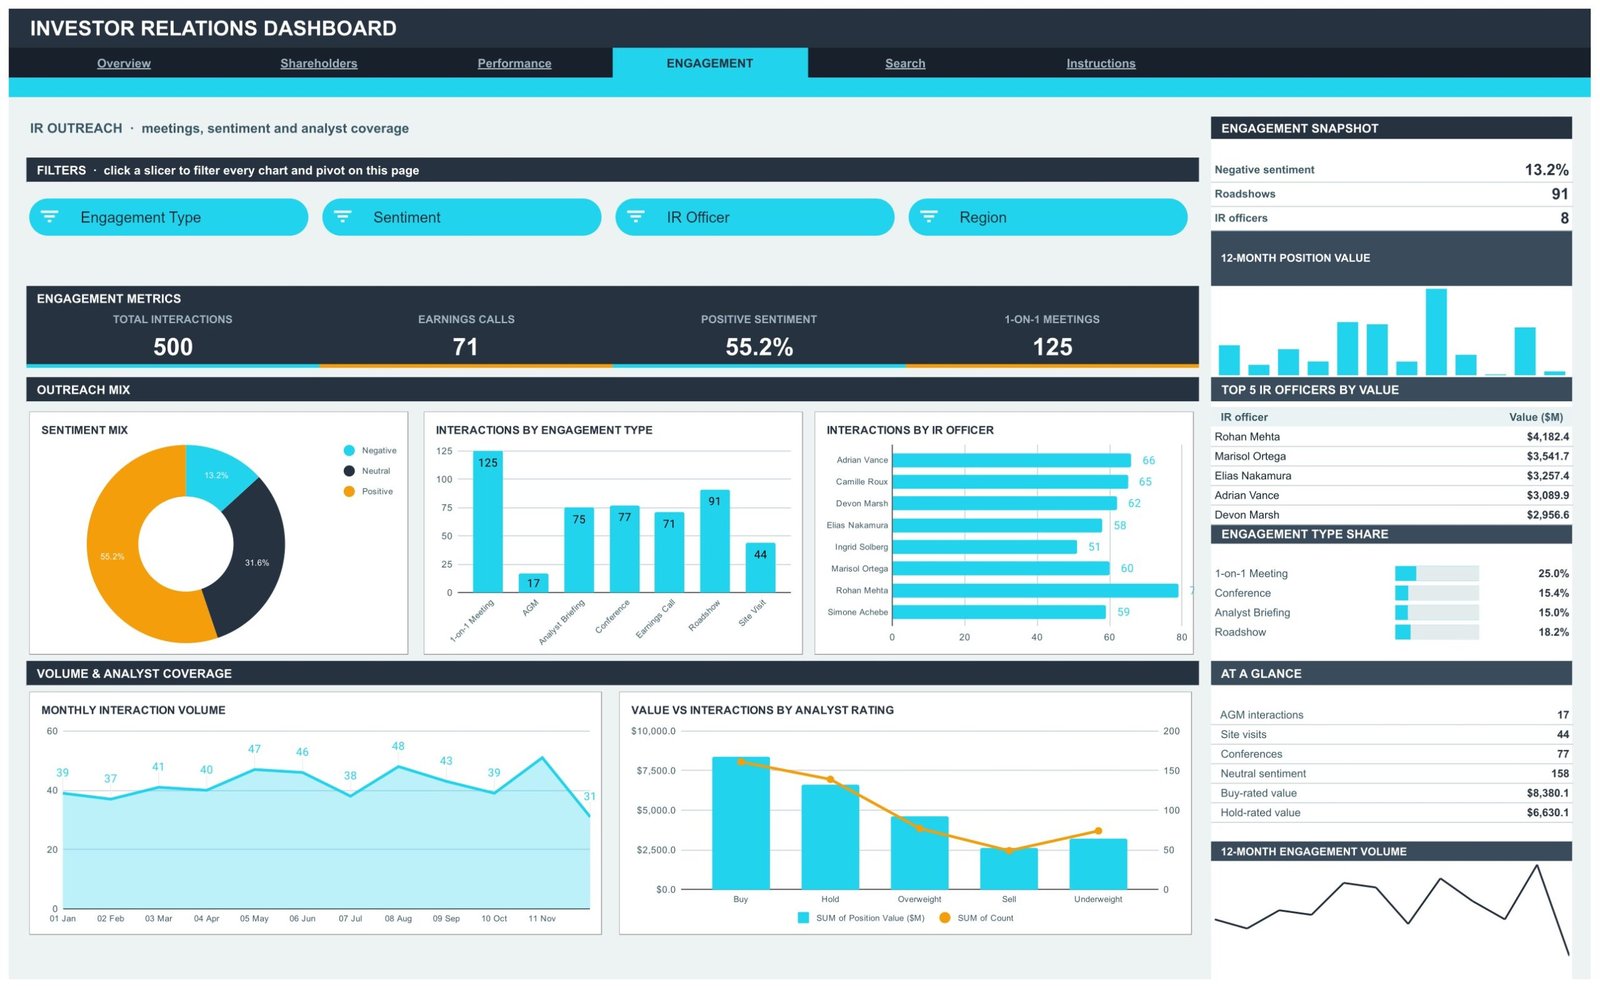
The outreach page is where the IR function’s own activity gets measured. Engagement Metrics count total interactions, earnings calls, positive sentiment share and one-on-one meetings. Sentiment Mix splits positive, neutral and negative as a donut. Interactions by Engagement Type ranks 1-on-1 meetings, AGMs, analyst briefings, conferences, earnings calls, roadshows and site visits. Interactions by IR Officer ranks the team. Monthly Interaction Volume shows the annual rhythm, and Value vs Interactions by Analyst Rating checks whether the coverage effort is landing where the value is.track investor engagement in Google Sheets
Slicers cover Engagement Type, Sentiment, IR Officer and Region.Investor Relations Dashboard in Google Sheets
Search – look up any IR record by Event ID
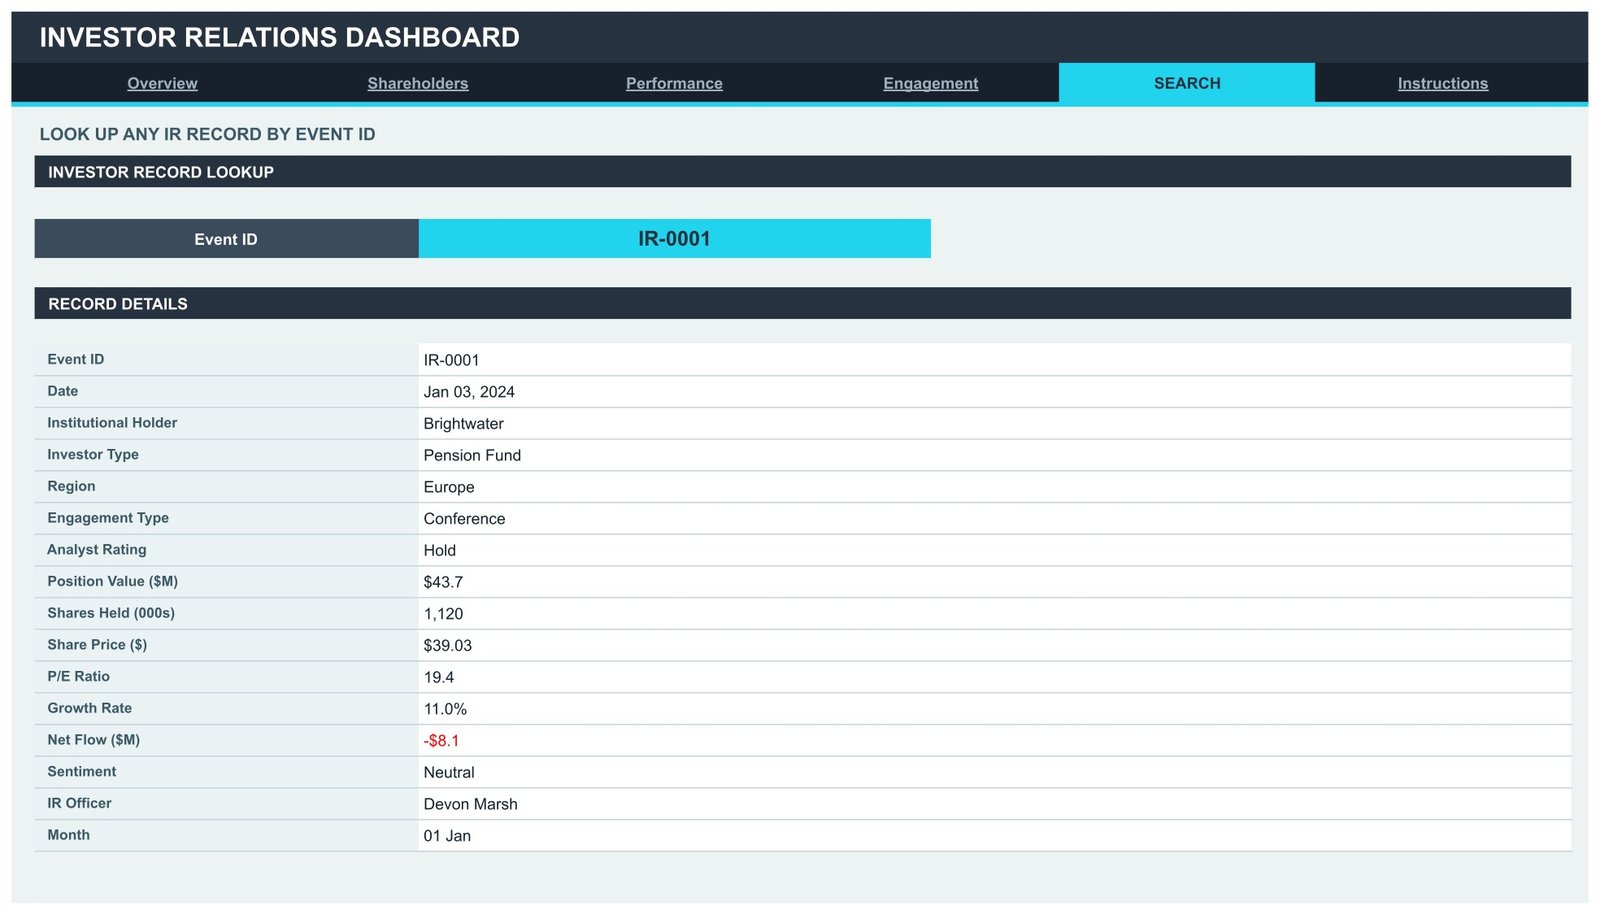
A dropdown takes an Event ID and the Record Details panel returns that row in full: date, institutional holder, investor type, region, engagement type, analyst rating, position value, shares held, share price, P/E ratio, growth rate, net flow, sentiment, IR officer and month. It exists so you can settle a question about one meeting without scrolling the raw Data sheet.track investor engagement in Google Sheets
Instructions – the ten-step user guide
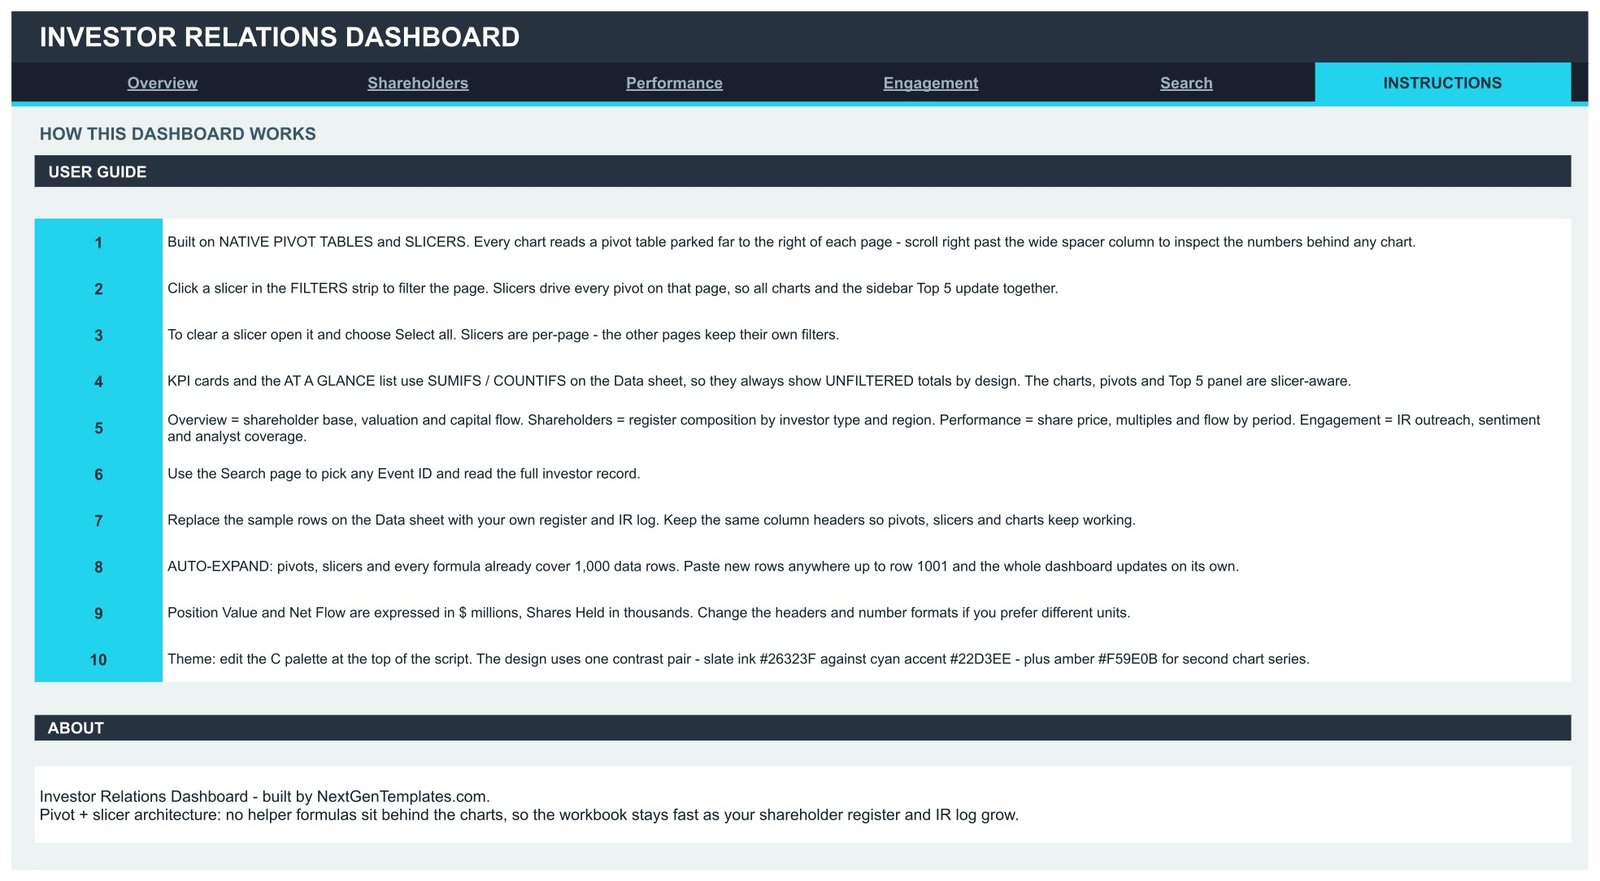
The final tab documents the build: where the pivots sit, how slicers scope to a page, why the KPI cards stay unfiltered, how far the auto-expand reaches, which units the figures use, and where the palette lives. Read it before you paste anything.track investor engagement in Google Sheets
Investor Relations Dashboard in Google Sheets vs. Excel vs. Paid IR Software – Feature Comparison
| This template (Google Sheets) | An Excel IR workbook | Paid IR platform | |
|---|---|---|---|
| Cost | 16.99 one-off (9.99 on sale) | Similar one-off, plus an Office licence | Typically four figures a year and up |
| Platform | Browser, any operating system | Windows or Mac desktop | Vendor web application |
| Setup time | Copy the sheet, paste your register – under an hour | Similar, once downloaded | Onboarding and migration, often weeks |
| Real-time team collaboration | Native, several editors at once | Needs OneDrive or SharePoint | Native |
| Mobile access | Google Sheets mobile app | Excel mobile app | Vendor app |
| Customisable fields | Add columns and pivot fields yourself | Yes | Usually vendor-controlled |
| Share with a link | Yes | File or cloud link | Seat-based invitations |
| Year-1 cost at 5 users | 16.99 total | 16.99 plus licences | Per-seat subscription |
| Shareholder register view | Built in, sliced by type, region and holder | Built in | Built in, often fed automatically |
| Live market data feed | No – you supply the figures | No | Usually included |
Who Should Use This Template
It suits IR managers at listed mid-caps who report to a board each quarter, CFOs at growth companies assembling an investor update, fund administrators and family offices watching a handful of positions, and consultants who rebuild the same IR pack for several clients. It suits anyone whose register already lives in a spreadsheet and who is tired of rebuilding the same four charts by hand.
It does not suit you if you need share prices pulled live from an exchange, registrar-grade record keeping across thousands of retail holders, automated regulatory filing, or per-field permissions and audit trails. Those are platform problems, not spreadsheet problems.investor engagement in Google Sheets
Real-World Use Cases
Quarterly board pack. An IR manager filters the Engagement page to the current quarter, screenshots the sentiment mix and the interactions-by-officer bar chart, and drops both into the pack. The unfiltered KPI cards stay on screen as the full-year context.
Concentration review. A CFO opens the Shareholders page and reads Region Value by Investor Type. If one region and one holder type carry most of the value, that is a targeting decision for next year’s roadshow calendar.investor engagement in Google Sheets
Coverage audit. An IR team compares Interactions by IR Officer against Top 5 IR Officers by Value. Where effort and value diverge, the roadshow list gets rebalanced.investor engagement in Google Sheets
Client reporting. An advisory analyst copies the template once per client, pastes each register in, and uses Top 5 Holders and Position Value by Region as the opening slides of every review.investor engagement in Google Sheets
Advantages of the Investor Relations Dashboard in Google Sheets
- It stays fast. Pivot tables do the aggregation, so there is no wall of array formulas recalculating on every keystroke as the register grows.
- It is auditable. Every chart has a visible pivot behind it. When a number looks wrong you can scroll right and check it, rather than reverse-engineering a formula.
- It shares like any other sheet. View access for the board, edit access for the IR team, no seats to buy.
- It is yours to change. Add a column, add a pivot field, recolour the palette. Nothing is locked.
- Nothing is hidden. No add-ons, no macros, no external scripts to approve – only native Google Sheets pivot tables and slicers.
Opportunities for Improvement
Being honest about limits is more useful than a feature list. There is no live price feed – the share price column is data you enter, and if you want it automated you would need to add a quote function yourself. The KPI cards deliberately ignore the slicers, which surprises people on first use; the Instructions tab explains why, but it is a design choice you either want or you do not. The auto-expand stops at row 1001, so a register beyond a thousand records needs the pivot ranges extended once. And because slicers are scoped per page, clearing a filter on Overview does not clear the equivalent filter on Shareholders – you clear each page’s strip on its own.
Best Practices
- Fix your units first. Position Value and Net Flow are in millions, Shares Held in thousands. Decide this before you paste, and change the headers if you prefer different units.
- Keep the column headers exactly as shipped. Pivots, slicers and charts are bound to them by name.
- Delete the demo rows completely before you share the file. A board pack containing a stray Anchor Ridge row is an awkward conversation.
- Log every interaction the same day. The Engagement page is only as good as the discipline behind it.
- Spot-check with the Search page. Pull three Event IDs at random and reconcile them against your source system before anyone else sees the dashboard.
- Share view-only with the board and keep edit access inside the IR team, so nobody accidentally re-sorts the Data sheet.
Explore Relevant Templates
- Environmental, Social, and Governance (ESG) Dashboard in Google Sheets – the disclosure side of the same investor conversation.
- Audit & Internal Controls Dashboard in Google Sheets – findings, remediation and control coverage.
- Sustainability and ESG Dashboard in Google Sheets – emissions, targets and initiative tracking.
- Diversity & Inclusion Dashboard in Google Sheets – the workforce metrics investors increasingly ask about.
- Real Estate Development Dashboard in Google Sheets – project capital and returns in the same slicer-driven layout.
To learn how reporting dashboards like this are built, see the Excel Pivot Tables & Dashboards course on NextGenTemplates Academy, which includes practice files.
Frequently Asked Questions
Does this dashboard give investment advice?
No. It is a tracking and reporting template. It charts the figures you enter, calculates no valuations for you and produces no recommendations. Analyst ratings are simply a field you record against each interaction.
Are the figures in the screenshots real?
No. All 500 rows are demo data created to show the layout. Replace them with your own register before sharing the file.
Do I need add-ons, macros or Apps Script permissions?
No. The dashboard is built entirely from native Google Sheets features – pivot tables, slicers, charts, and formulas such as SUMIFS and COUNTIFS.investor engagement in Google Sheets
How much data can it hold?
Pivots, slicers and formulas are pre-ranged to 1,000 rows. Paste anywhere up to row 1001 and everything follows. Beyond that, extend the pivot ranges once.investor engagement in Google Sheets
Why do the KPI cards ignore my slicer selection?
By design. The metric cards and the At a Glance list use SUMIFS and COUNTIFS on the Data sheet, so they hold the unfiltered total as a fixed reference while the charts, pivots and Top 5 panels respond to the slicers.
Can I open it in Excel?
It is built for Google Sheets and the slicer behaviour does not survive an export cleanly. If you work in Excel, use one of our Excel dashboards instead.investor engagement in Google Sheets
Can I rebrand the colours?
Yes. One palette block controls the slate ink, the cyan accent and the amber second chart series. Change those three values and the whole dashboard follows.investor engagement in Google Sheets
About the Author
Built by PK – Microsoft Certified Professional with 15+ years of Excel, Google Sheets, and Power BI experience. Founder of NextGenTemplates, reaching 300K+ subscribers across YouTube channels. Every template is hand-built and tested before release.
Conclusion
An investor relations function does not usually fail for lack of data. It fails because the register, the price history and the meeting log never meet on one screen, so nobody can answer a board question without an evening of copy-paste. The Investor Relations Dashboard in Google Sheets is a deliberately plain fix for that: six pages, native pivot tables, 15 slicers, and a Data sheet you own. Paste your register, delete the demo rows, and the reporting pack builds investor engagement in Google Sheets
Get the Investor Relations Dashboard in Google Sheets
Instant download, with a PDF that carries a Make a copy link straight into your own Google Drive.