The Business Consulting Client Management System Web App runs an entire consulting practice from 20 connected modules, a seven-phase fee schedule and 14 exportable reports, backed by 32 admin-controlled dropdown lists holding 229 values. Four numbers that most firms argue about every month — fee earned, fee invoiced, work in progress and margin — are computed here from the timesheet and the phase schedule rather than typed into a spreadsheet.Business Consulting Client Management System Web App
Most small consultancies end up running four disconnected files: one for time, one for fees, one for invoices and one for who is free next month. The moment those files disagree, nobody can answer the only question that matters on a Monday morning — can we take the next job? This consulting client management software puts all four in one browser application built on Google Sheets and Google Apps Script web apps, so every figure comes from a single source.
Get the Business Consulting Client Management System Web App
Key Features of the Business Consulting Client Management System Web App
- Seven delivery phases on every engagement. Discovery, Diagnosis, Strategy Design, Implementation Planning, Mobilisation, Implementation and Benefits Review. Engagement leads move a percent-complete figure and everything downstream follows.
- Timesheets drive every other number. Booked hours produce billable share, charge value at standard rates, utilisation per person against target, and recovery per hour on every job.
- Margin is computed, not entered. Fee earned minus studio labour and sub-consultant cost, reported per engagement and per engagement type against a target.
- Phase-based fee notes. A phase can never be billed past the work it has actually delivered, which removes the most common source of over-billing disputes.
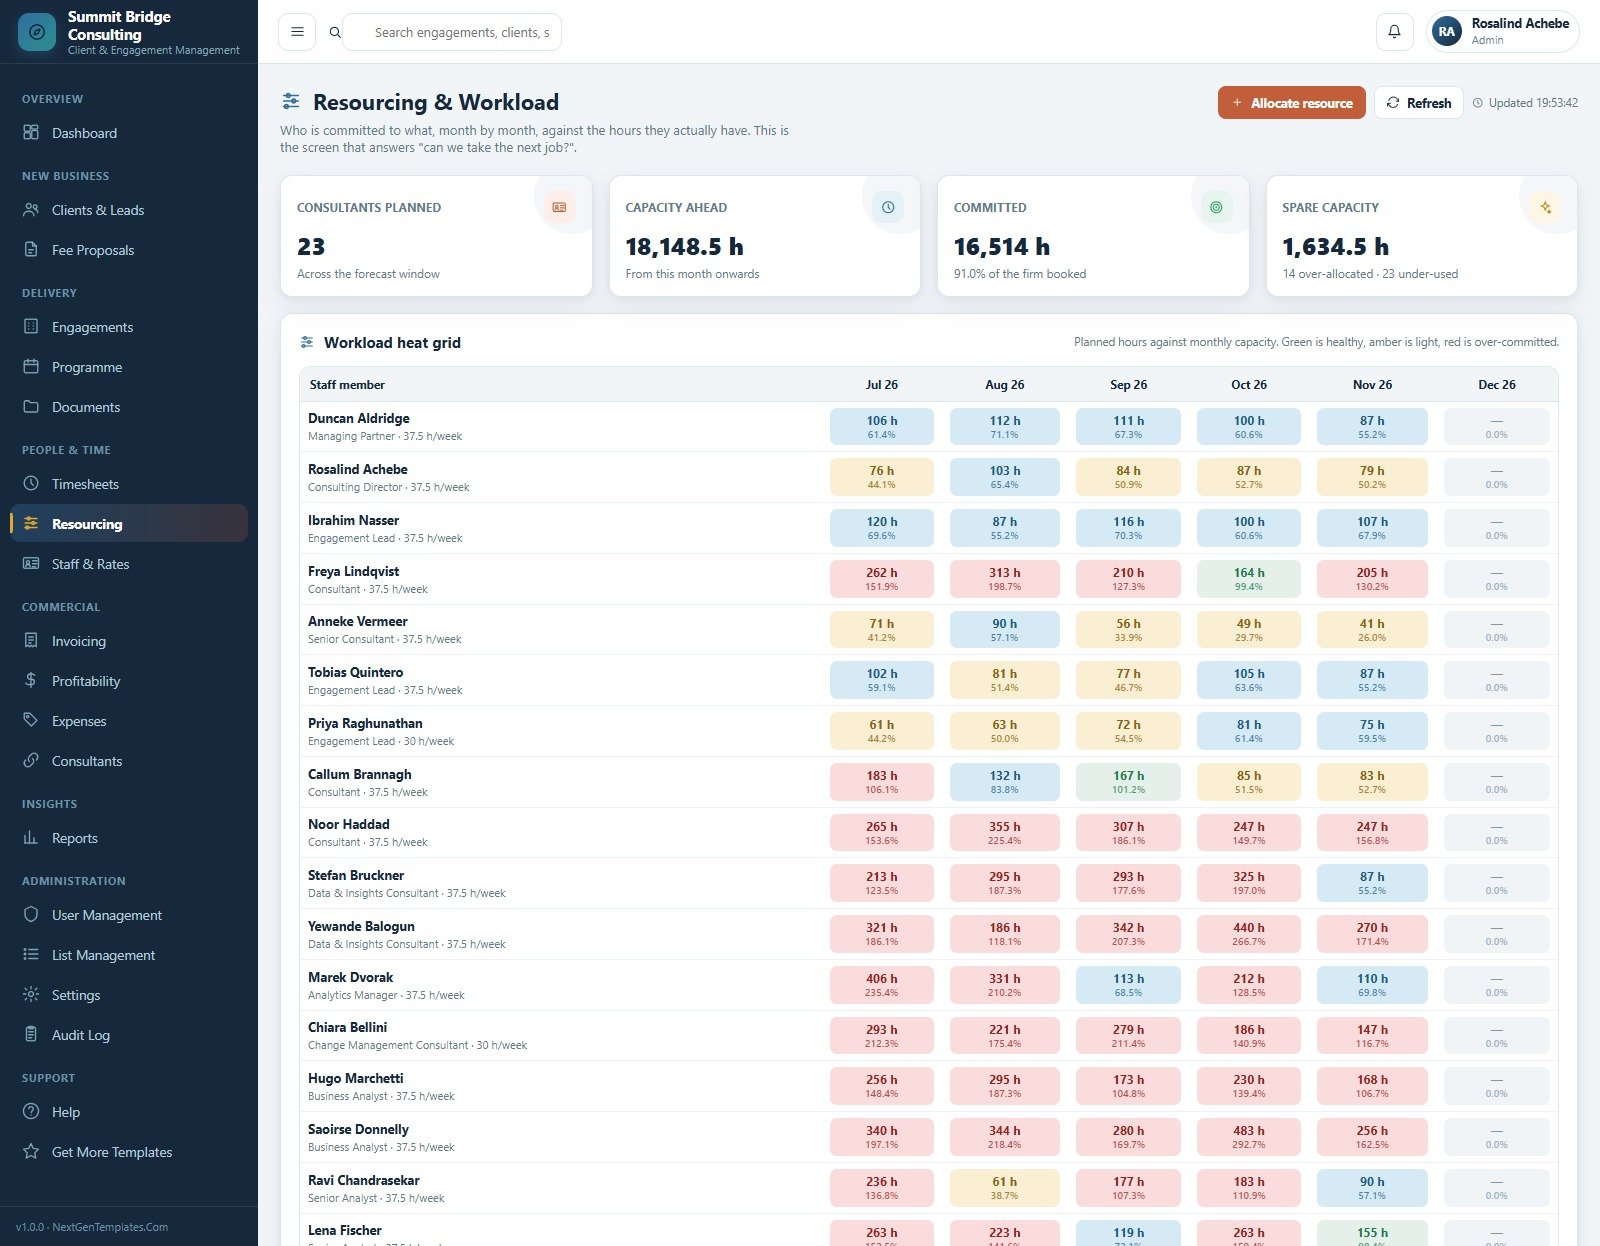
- Resourcing heat grid. Planned hours against monthly capacity for every consultant, colour-coded green, amber and red.
- Six roles and a full audit log. Every create, change, approval, fee note, sign-in and archive is recorded with the user and timestamp.
- 14 reports. Each one filters, prints and exports to CSV or Excel.
Dashboard Pages Explanation
The system ships with 20 screens grouped into Overview, New Business, Delivery, People & Time, Commercial, Insights, Administration and Support.
1. Secure Sign-In
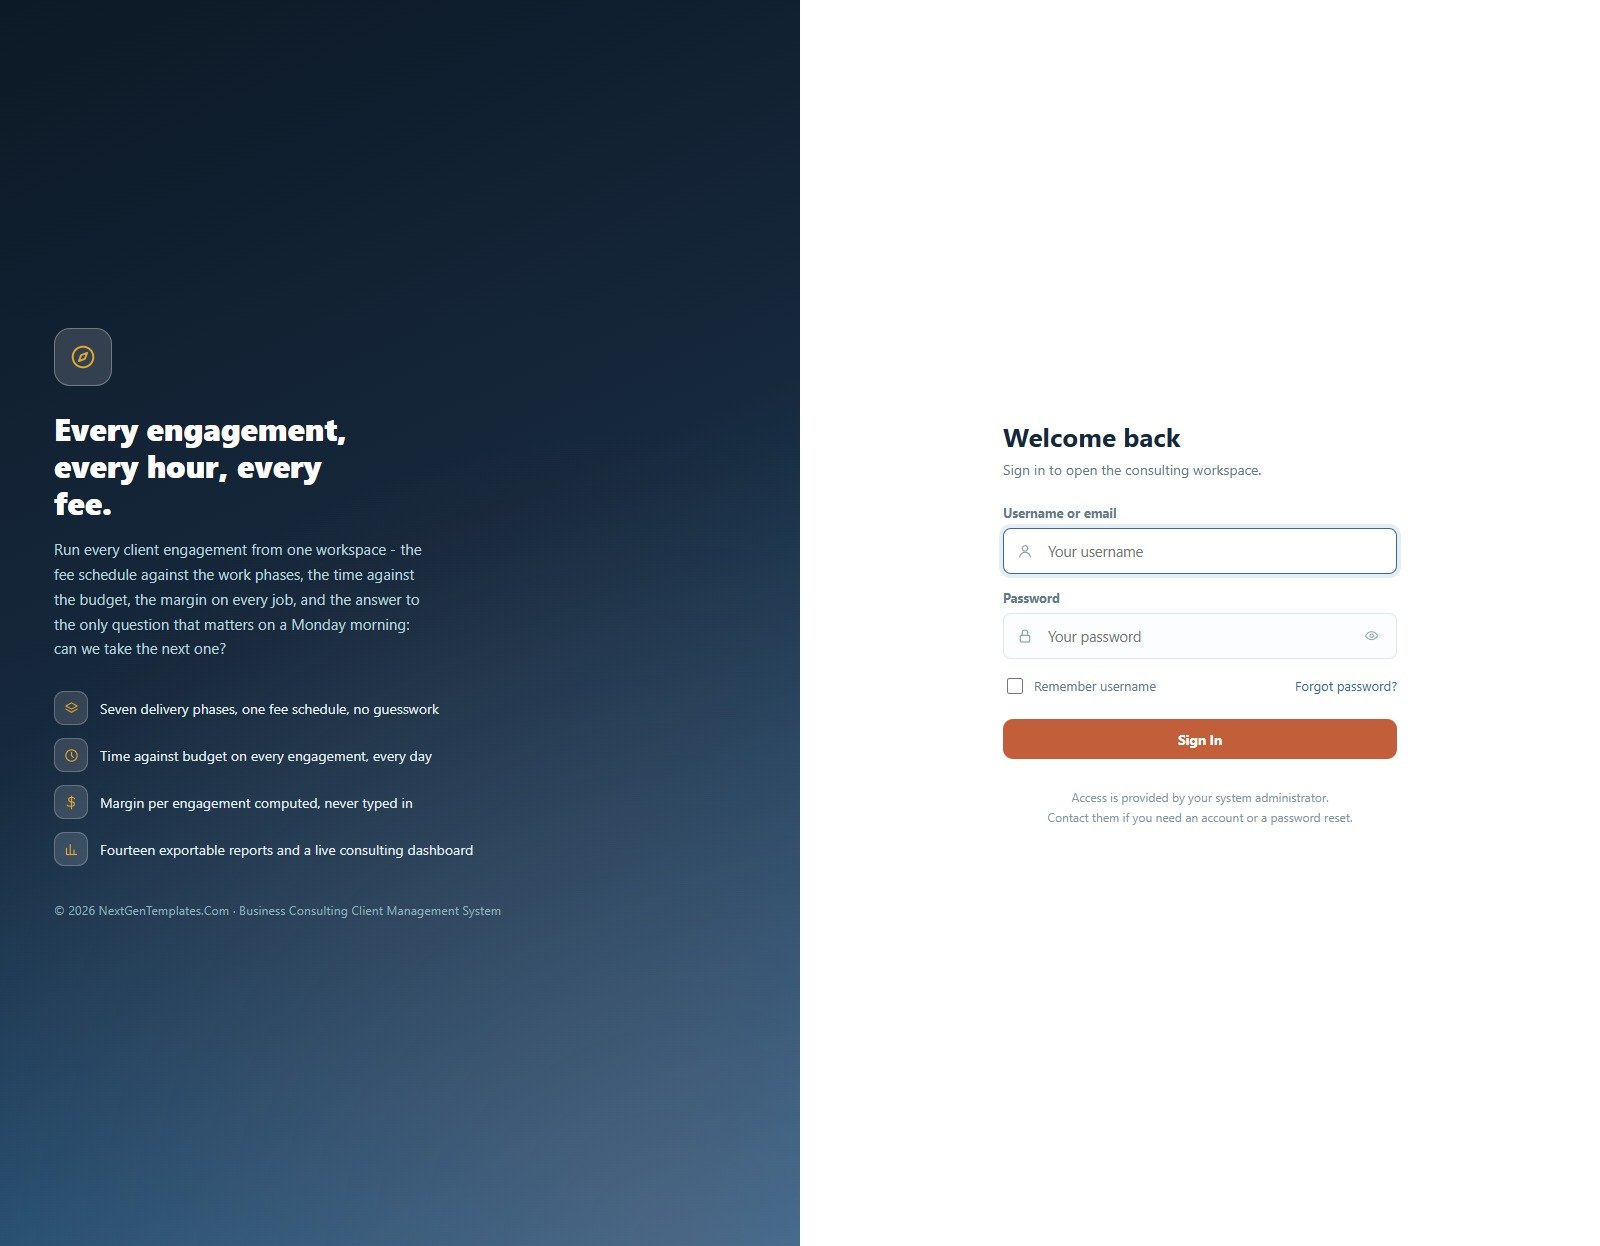
A branded two-panel login with username or email, password visibility toggle, remember-username and a forgot-password route. Accounts are issued by the administrator, not by self-signup.Business Consulting Client Management System Web App
2. Consulting Dashboard
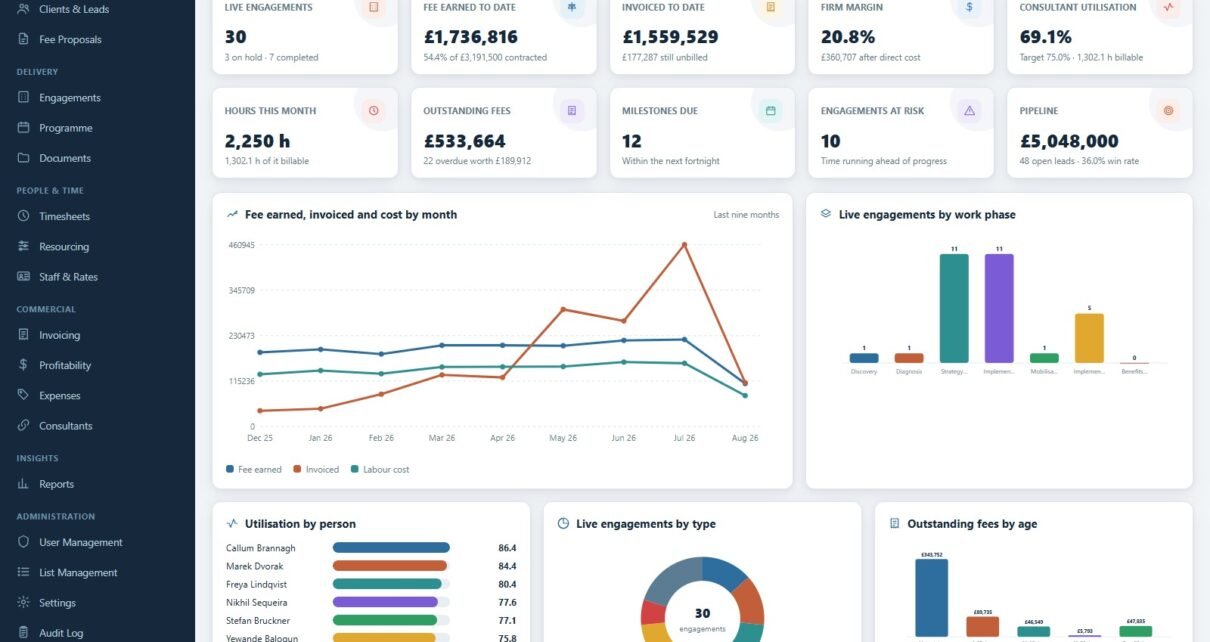
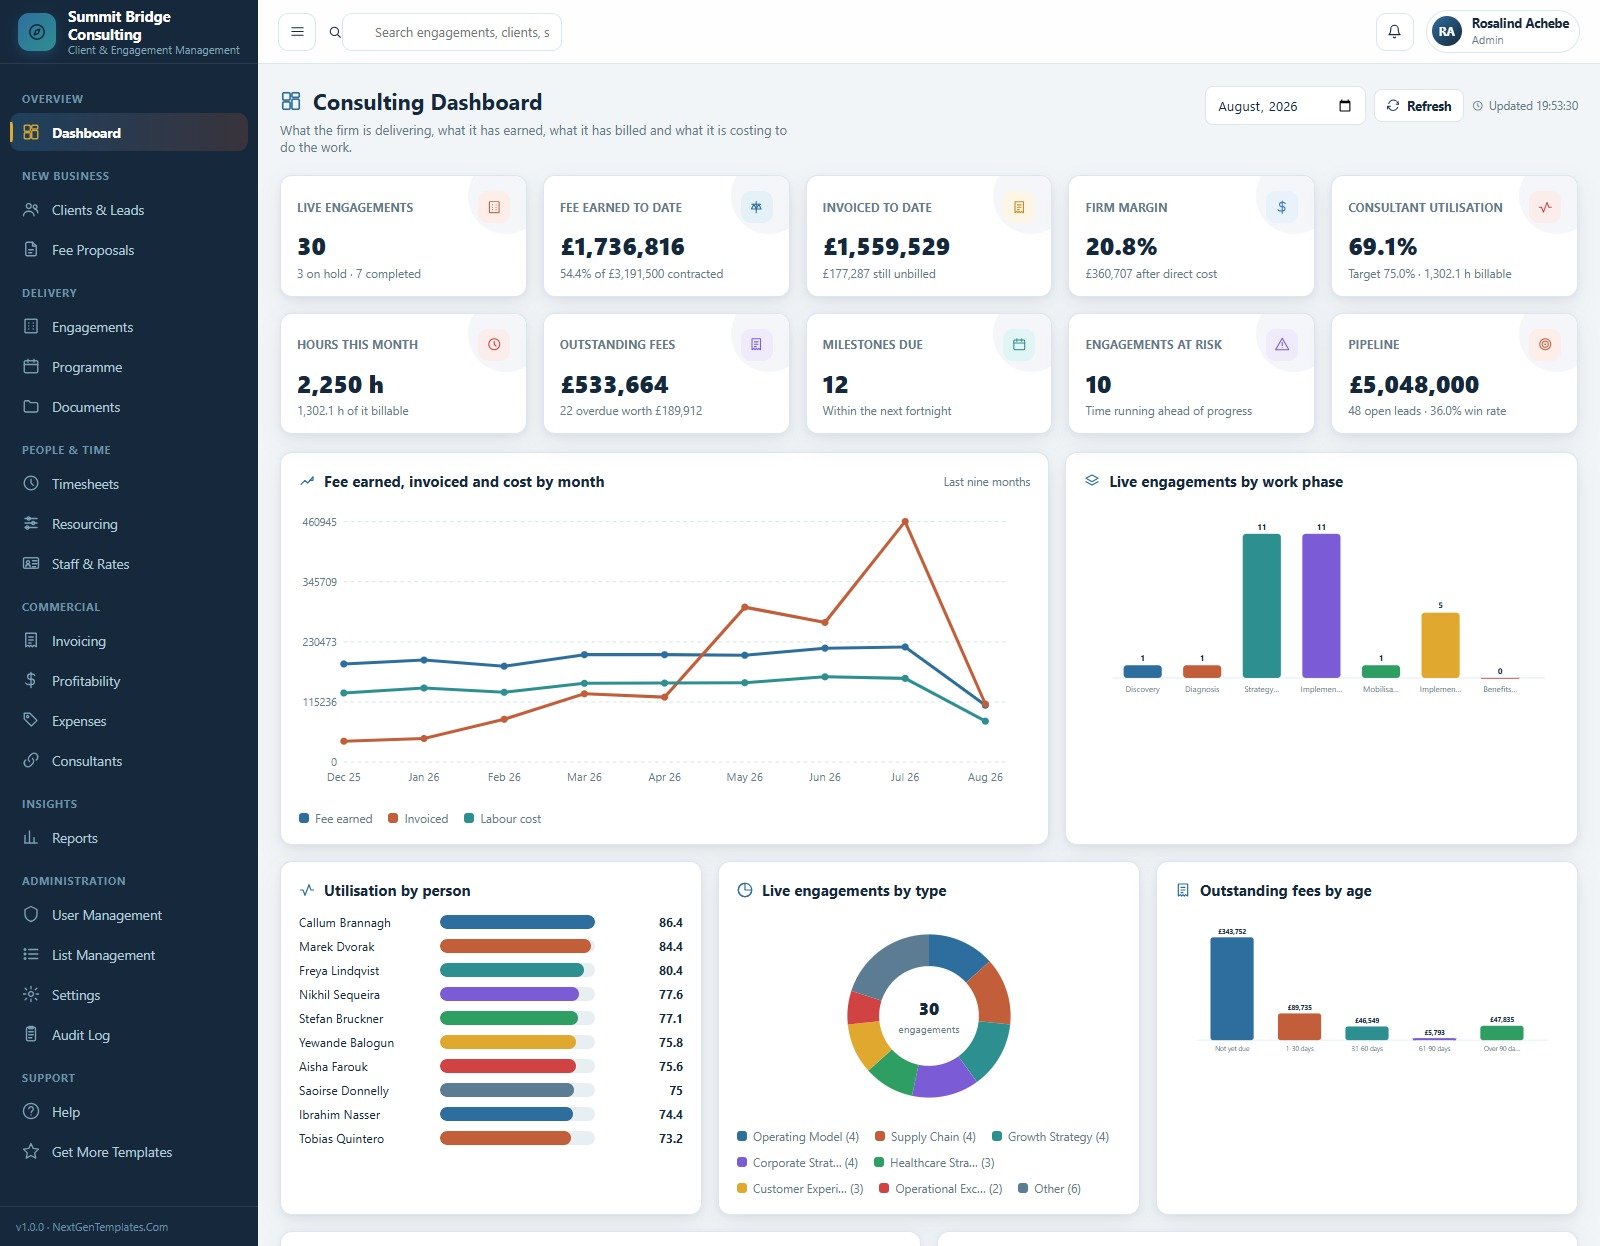
Ten KPI cards cover live engagements, fee earned to date, invoiced to date, firm margin, consultant utilisation, hours this month, outstanding fees, milestones due, engagements at risk and pipeline. Charts include Fee Earned, Invoiced and Cost by Month, Live Engagements by Work Phase, Utilisation by Person, Live Engagements by Type and Outstanding Fees by Age.Business Consulting Client Management System Web App
3. Clients & Leads
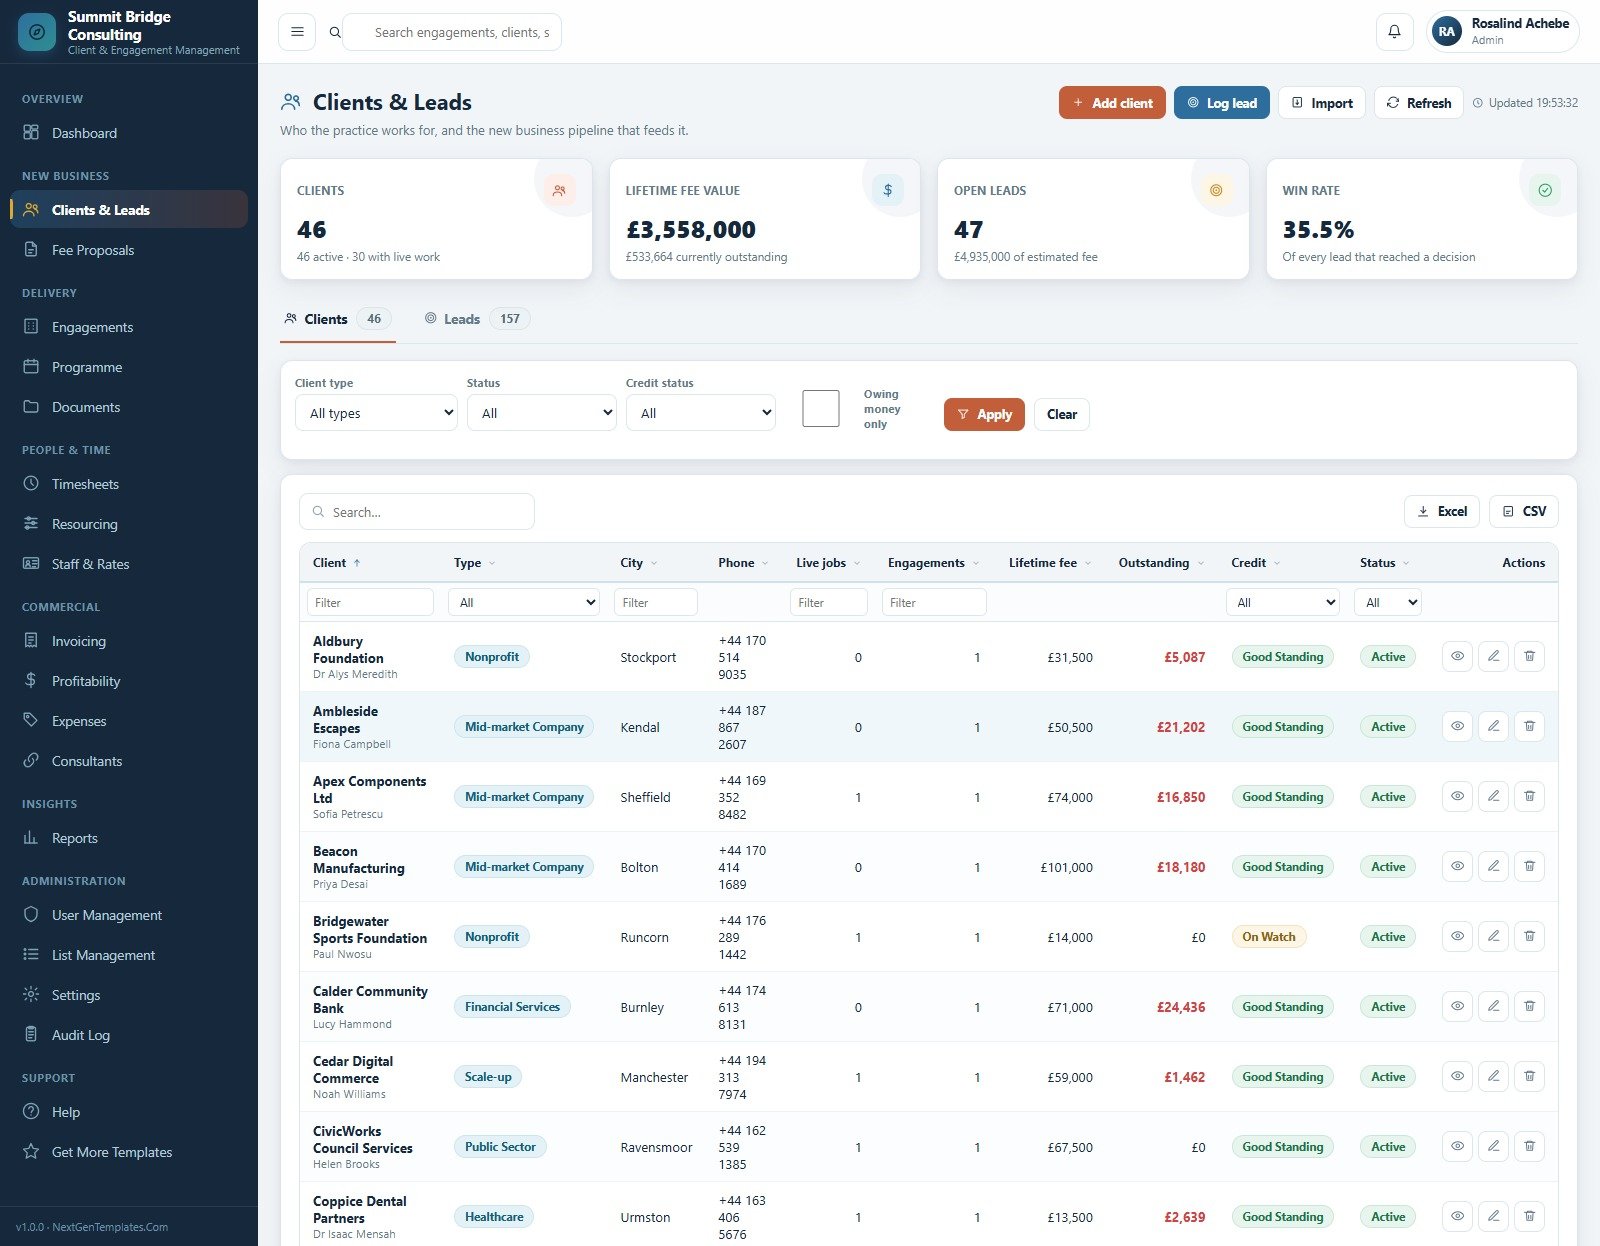
The client register and the new-business pipeline share one screen, with cards for clients, lifetime fee value, open leads and win rate. Each client row carries type, city, live jobs, engagements, lifetime fee, outstanding balance, credit standing and status.Business Consulting Client Management System Web App
4. Fee Proposals & Contracts
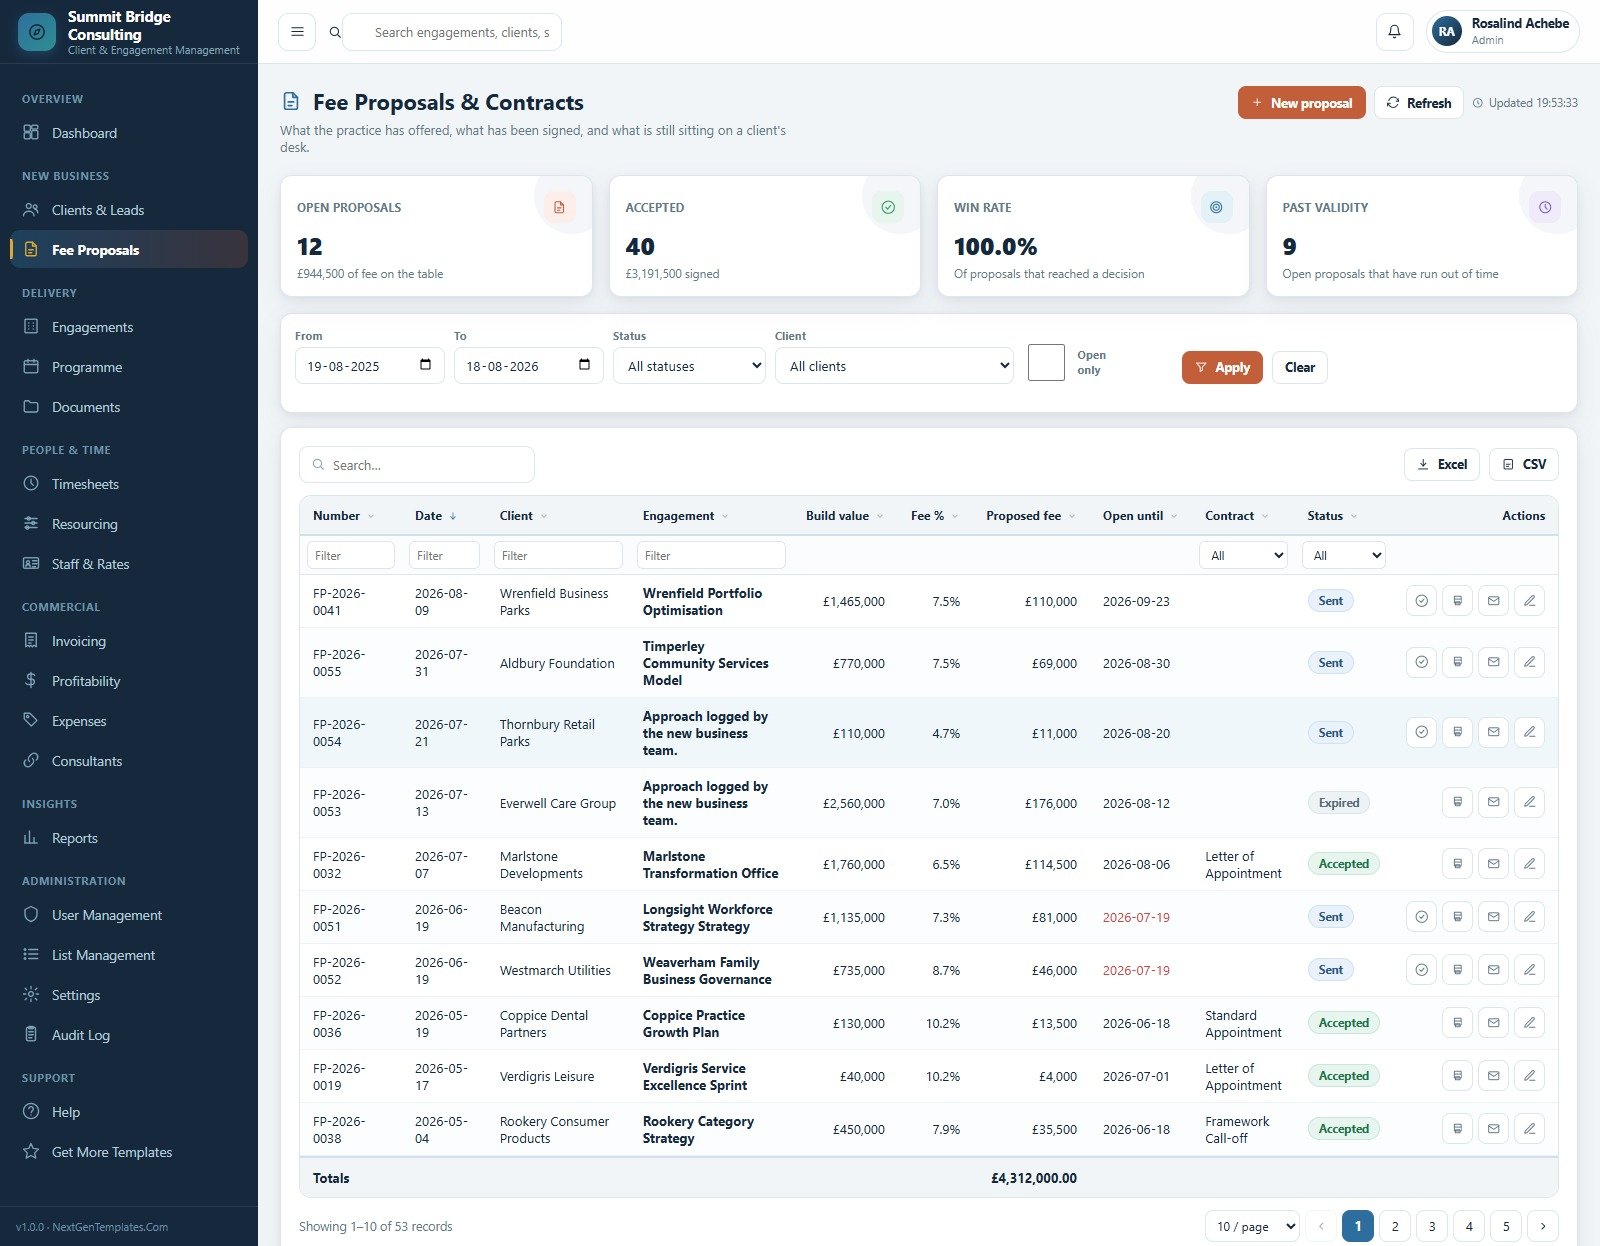
Every proposal with its number, date, client, engagement, build value, fee percent, proposed fee, validity date, contract type and status. Accepting a proposal opens the engagement and writes its seven phases.Business Consulting Client Management System Web App
5. Engagements
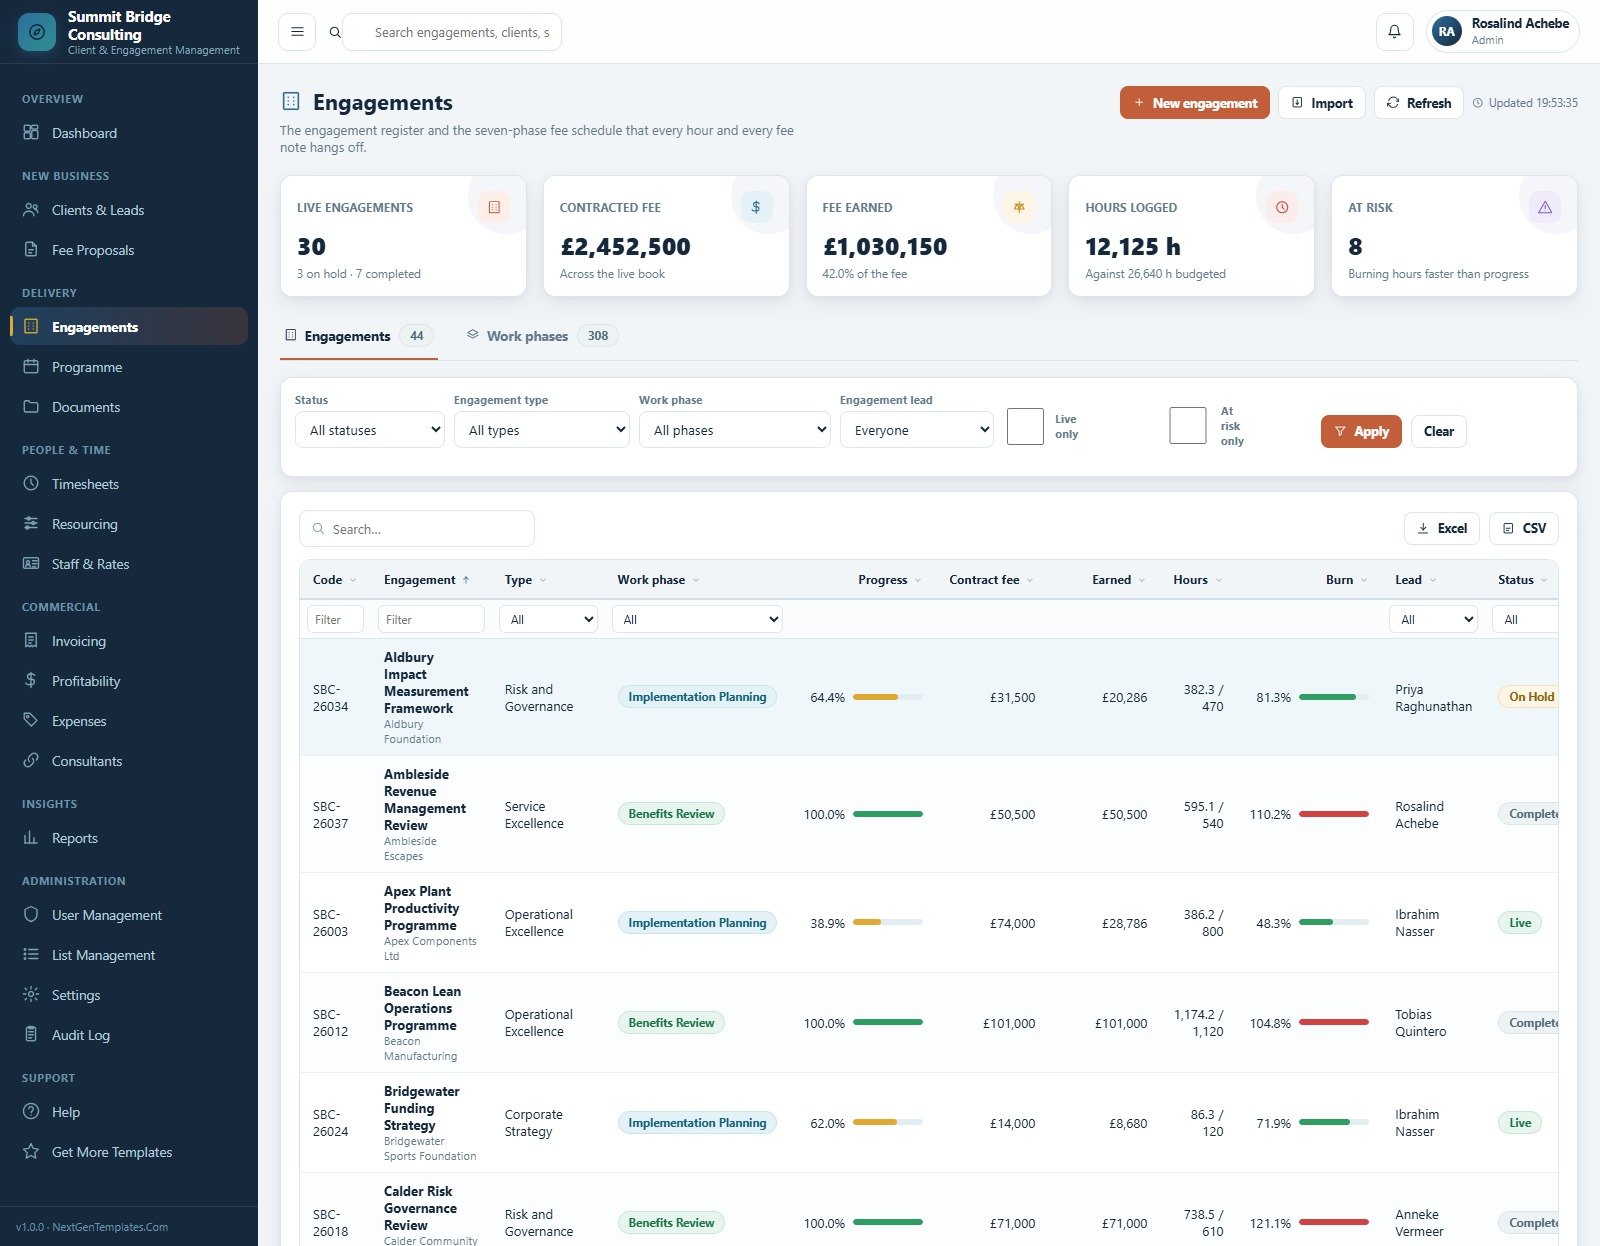
The engagement register and the work-phase schedule. Each row shows code, type, current phase, progress, contract fee, fee earned, hours against budget, burn percent, lead and status, with an at-risk filter for jobs burning hours faster than progress.
6. Programme
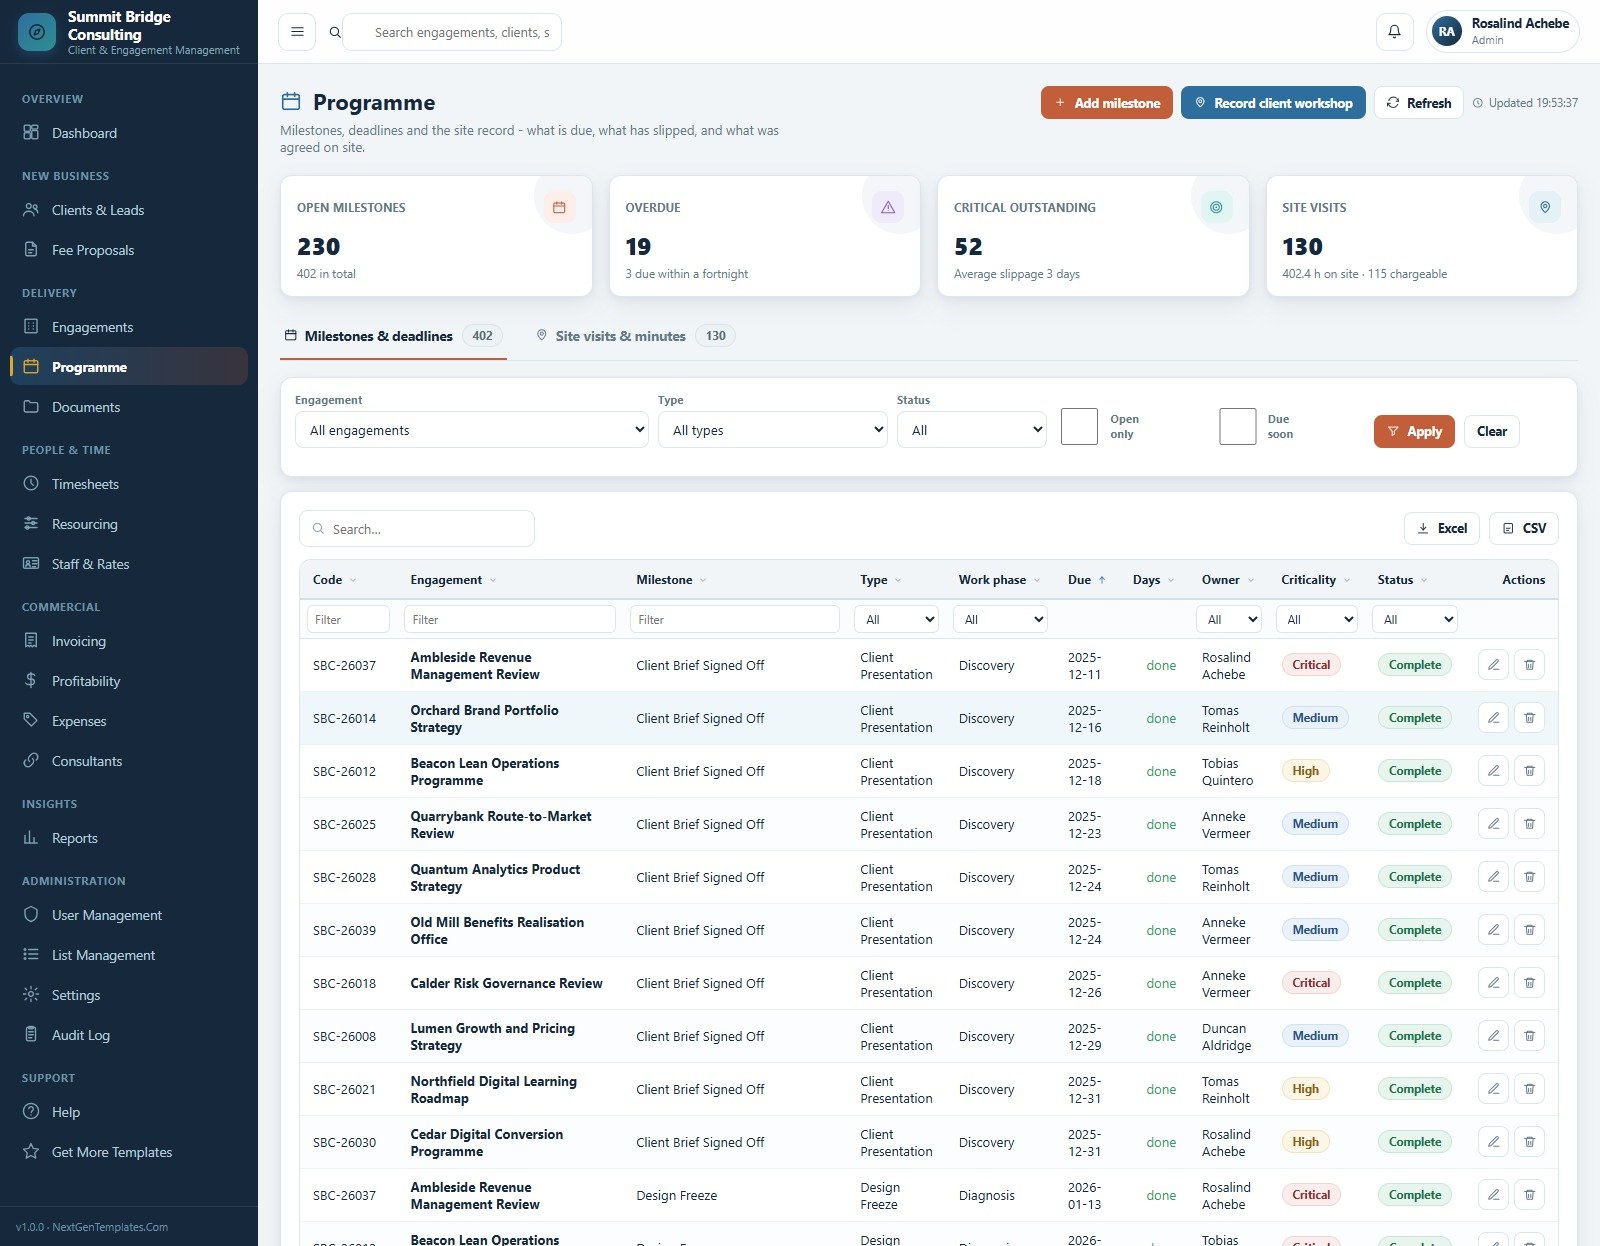
Milestones, deadlines and the site record. Cards show open milestones, overdue items, critical outstanding work and site visits with hours on site and chargeable hours.
7. Engagement Documents
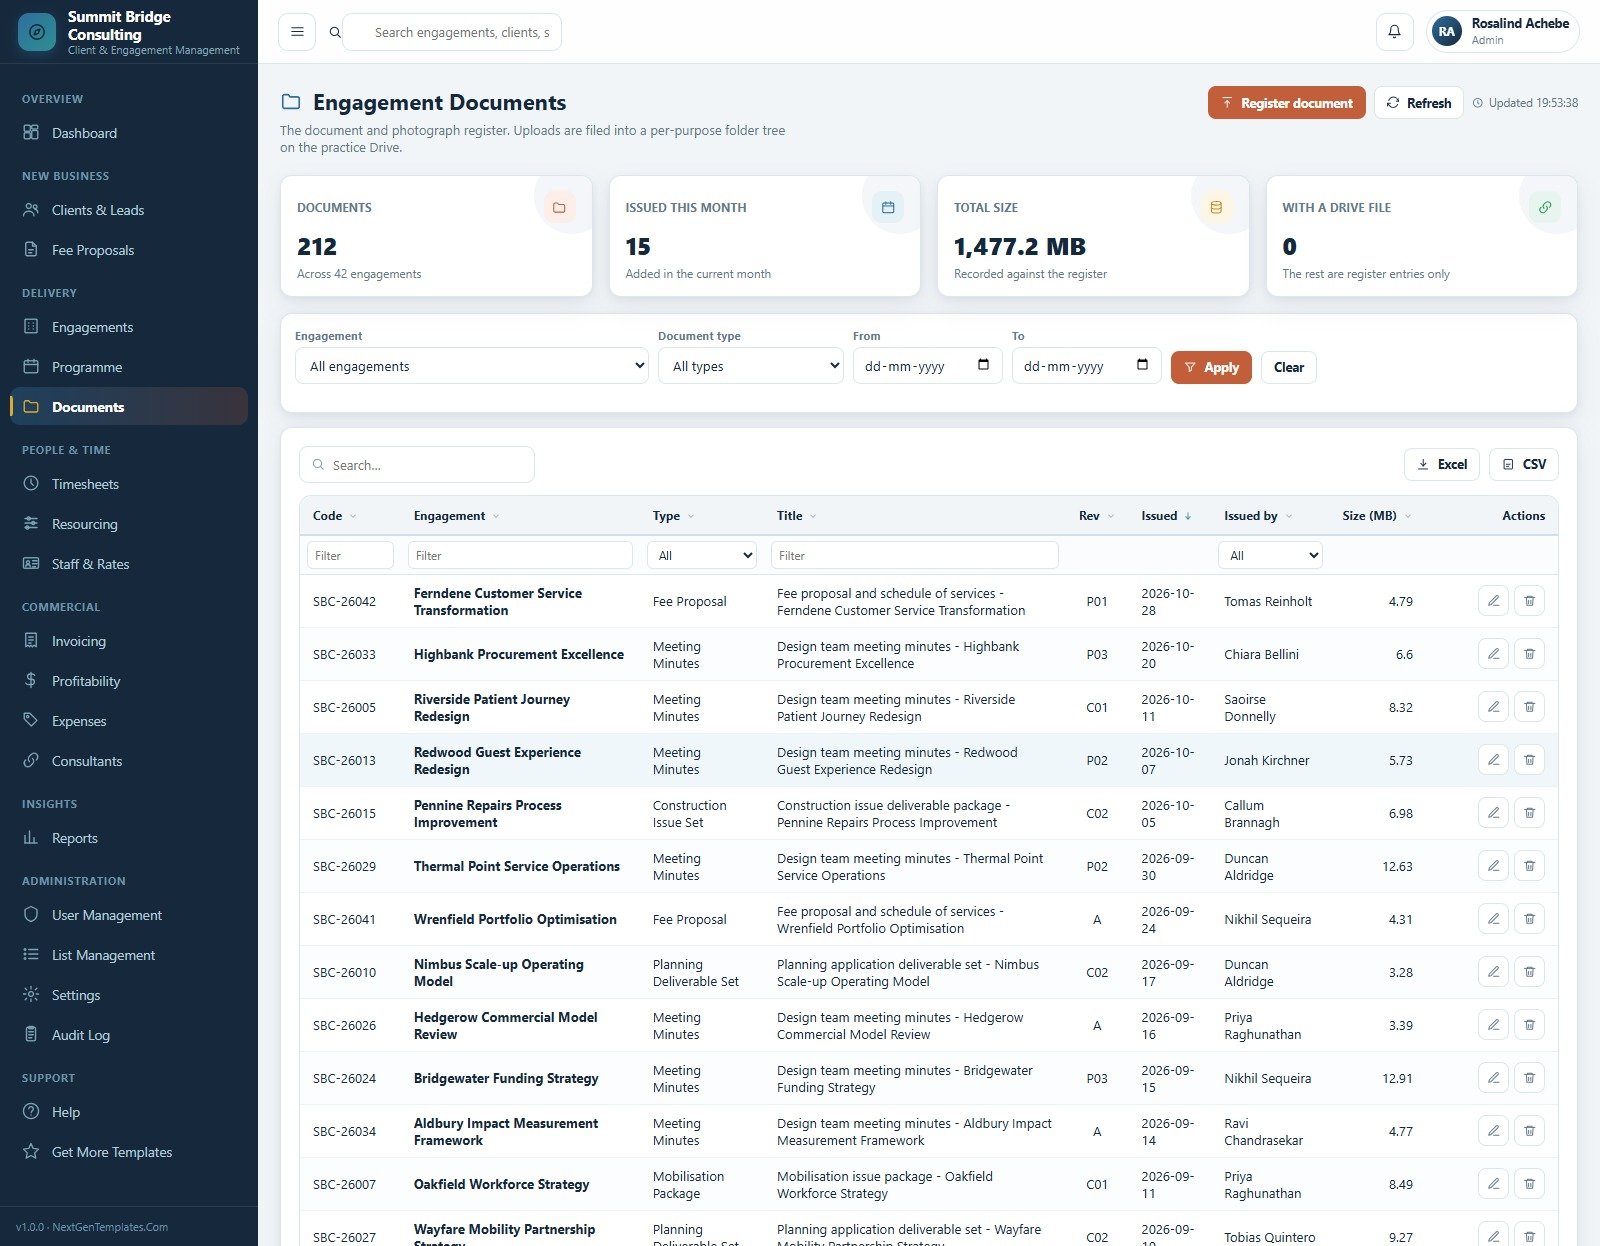
A document and photograph register filed into a per-purpose folder tree on the practice Drive, with document type, title, revision, issue date, issuer and file size.Business Consulting Client Management System Web App
8. Timesheets
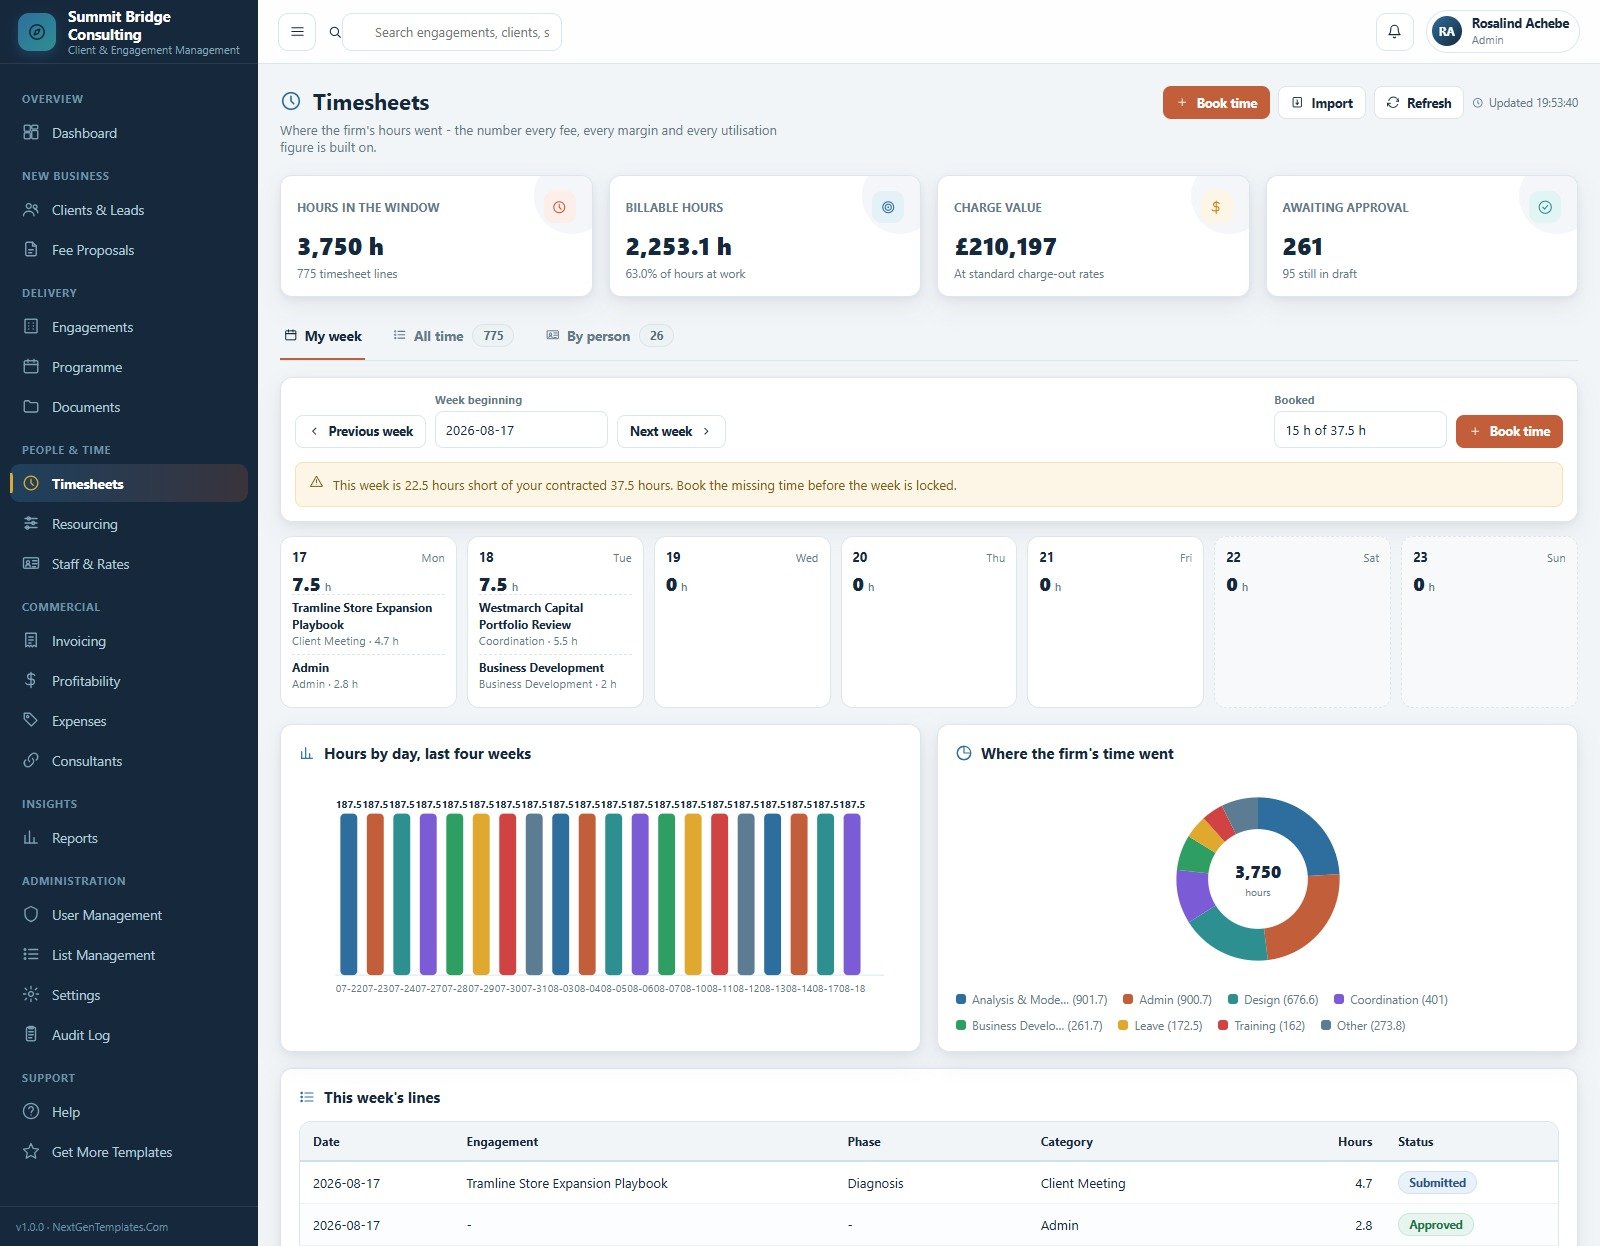
A personal week view, an all-time list and a by-person view. Cards cover hours in the window, billable hours, charge value and lines awaiting approval, plus Hours by Day and Where the Firm’s Time Went charts. A shortfall warning appears when someone is under contracted hours.Business Consulting Client Management System Web App
9. Resourcing & Workload
A month-by-month heat grid of planned hours against capacity. Cards show consultants planned, capacity ahead, committed hours and spare capacity.Business Consulting Client Management System Web App
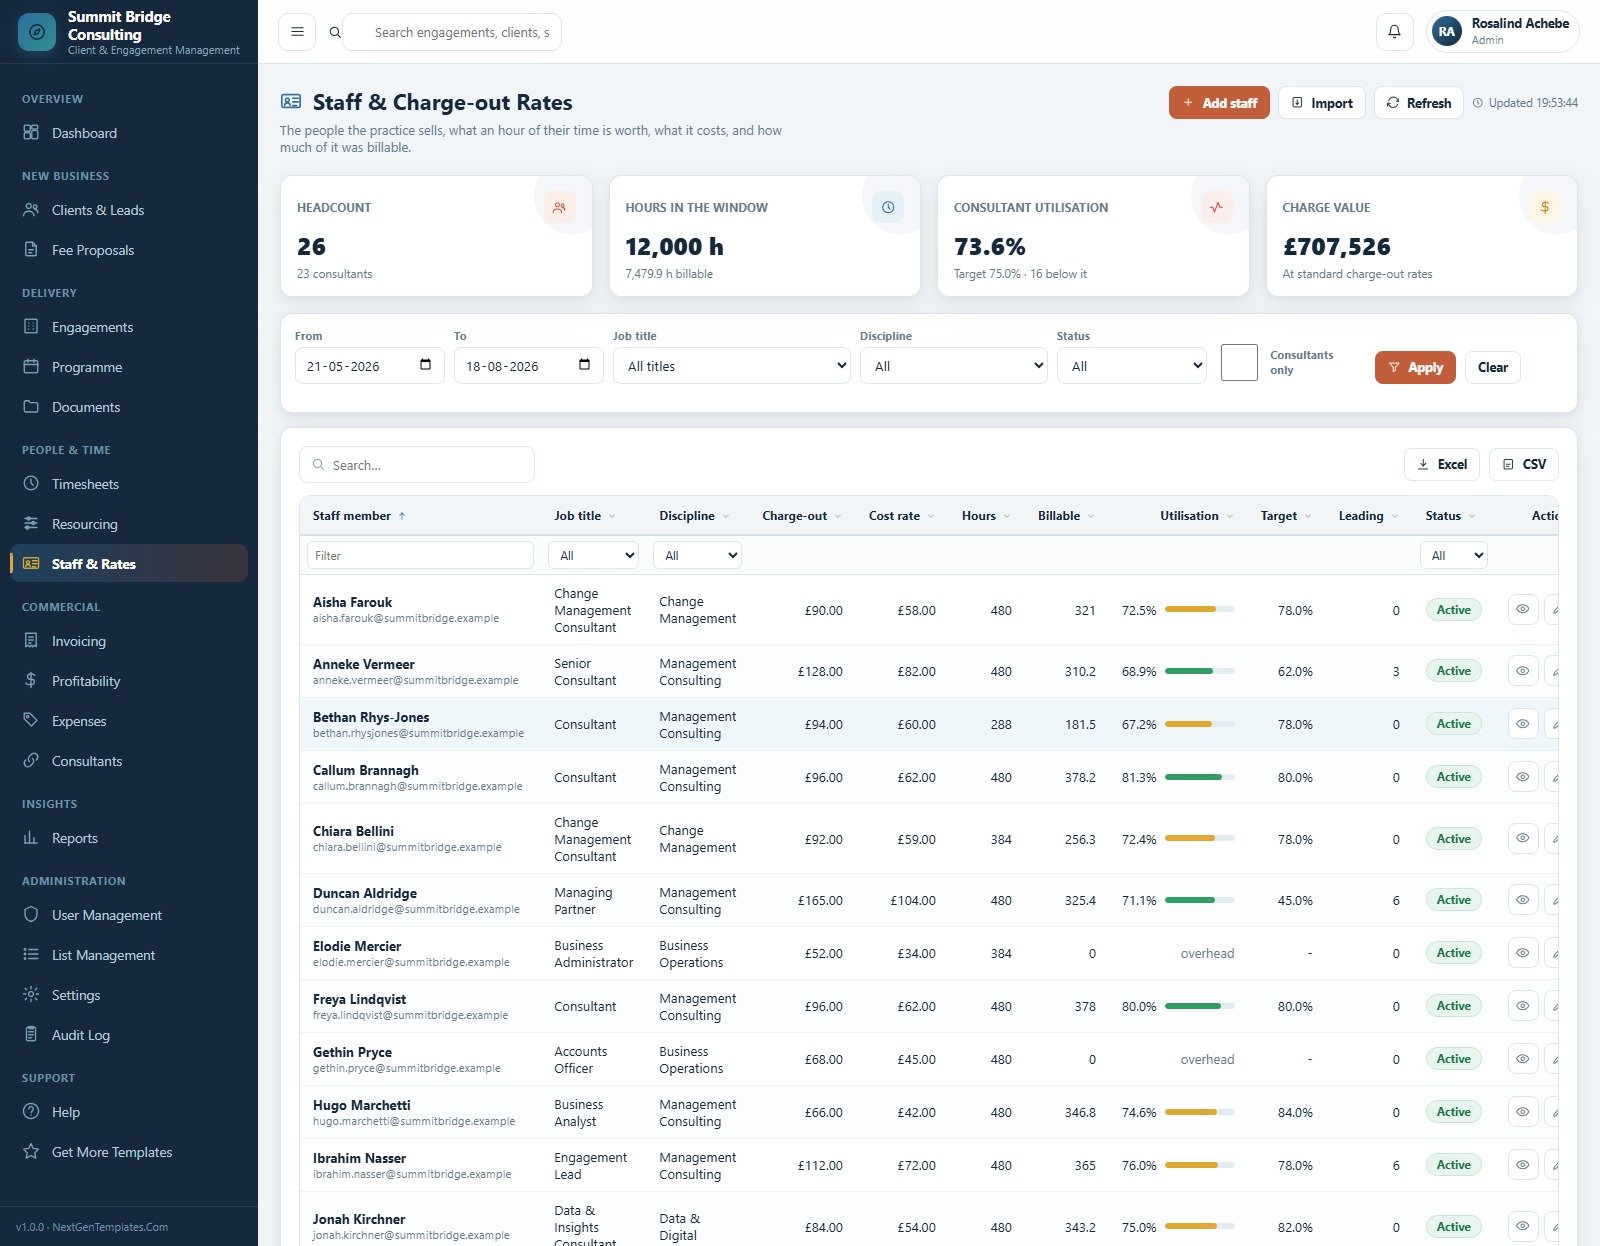
10. Staff & Charge-out Rates
What an hour of each person’s time is worth, what it costs, and how much of it was billable — job title, discipline, charge-out rate, cost rate, hours, billable hours and utilisation against targetBusiness Consulting Client Management System Web App.
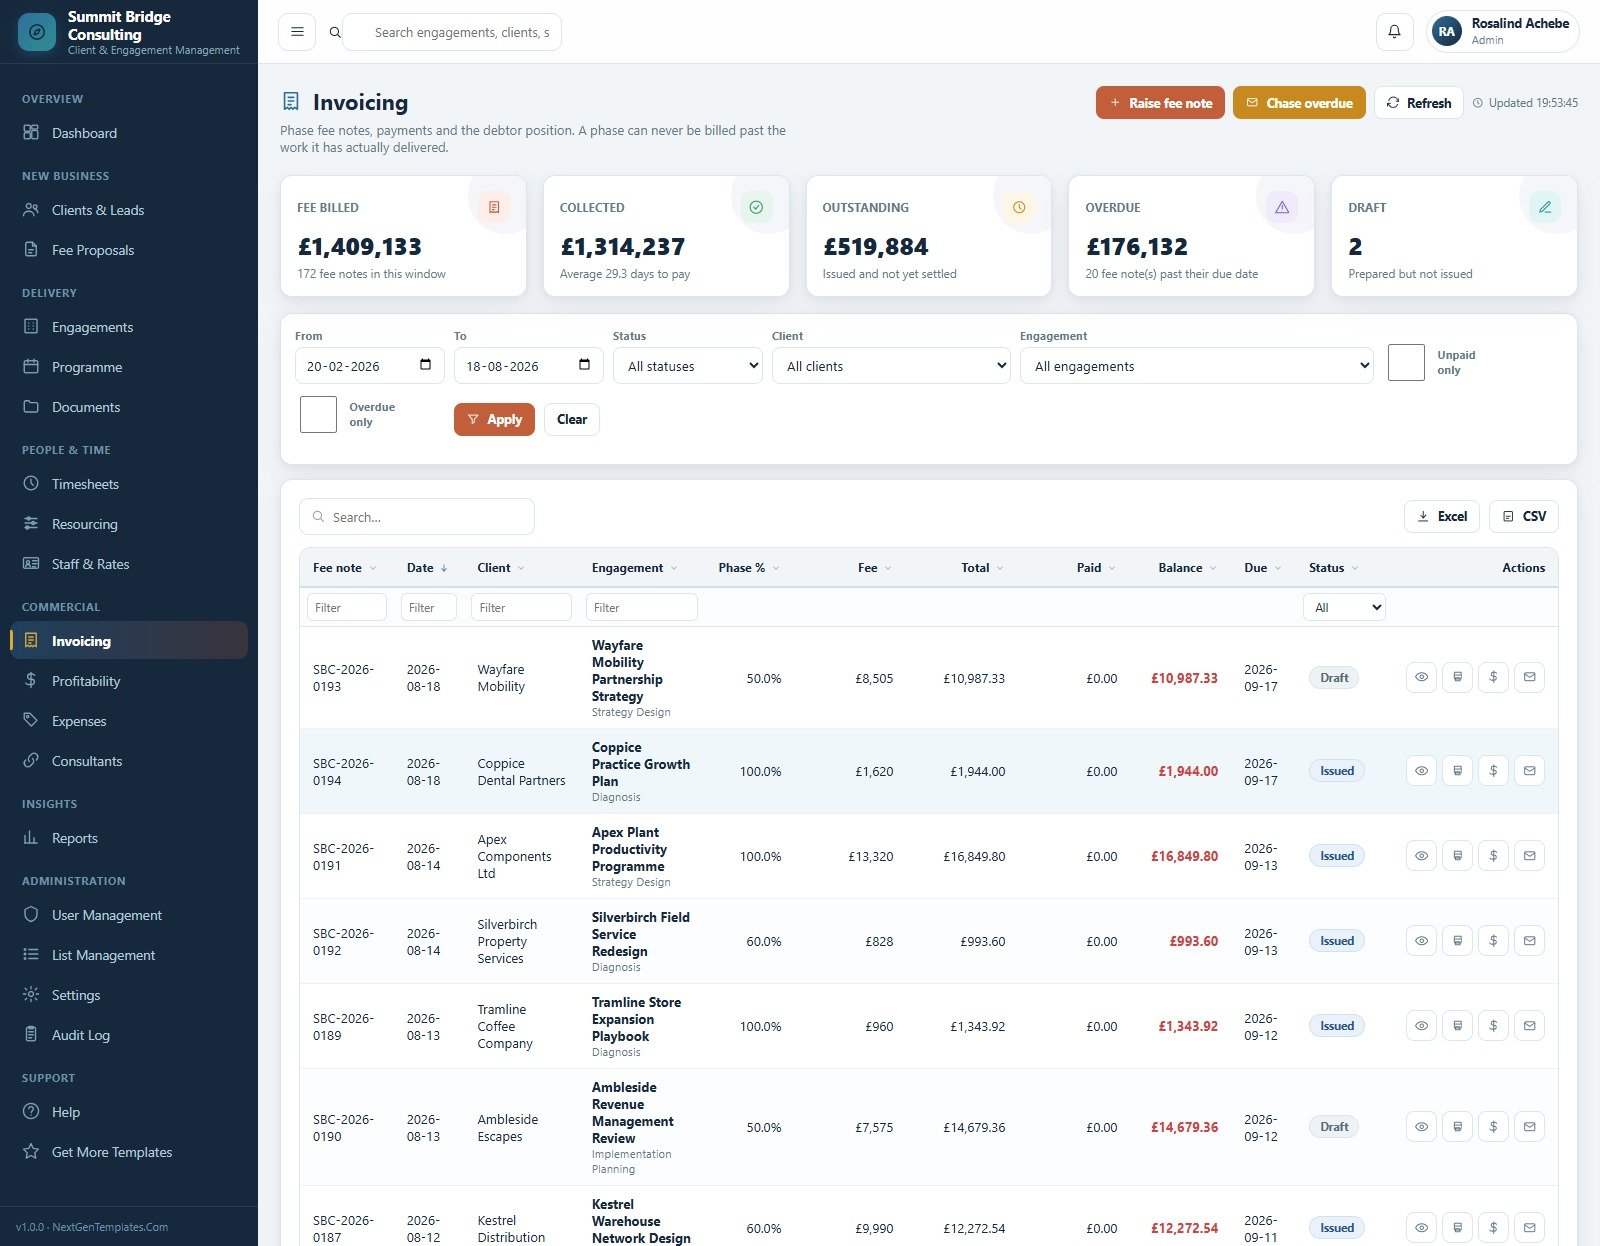
11. Invoicing
Phase fee notes, payments and the debtor position, with cards for fee billed, collected, outstanding, overdue and draft, and an average days-to-pay figure.Business Consulting Client Management System Web App
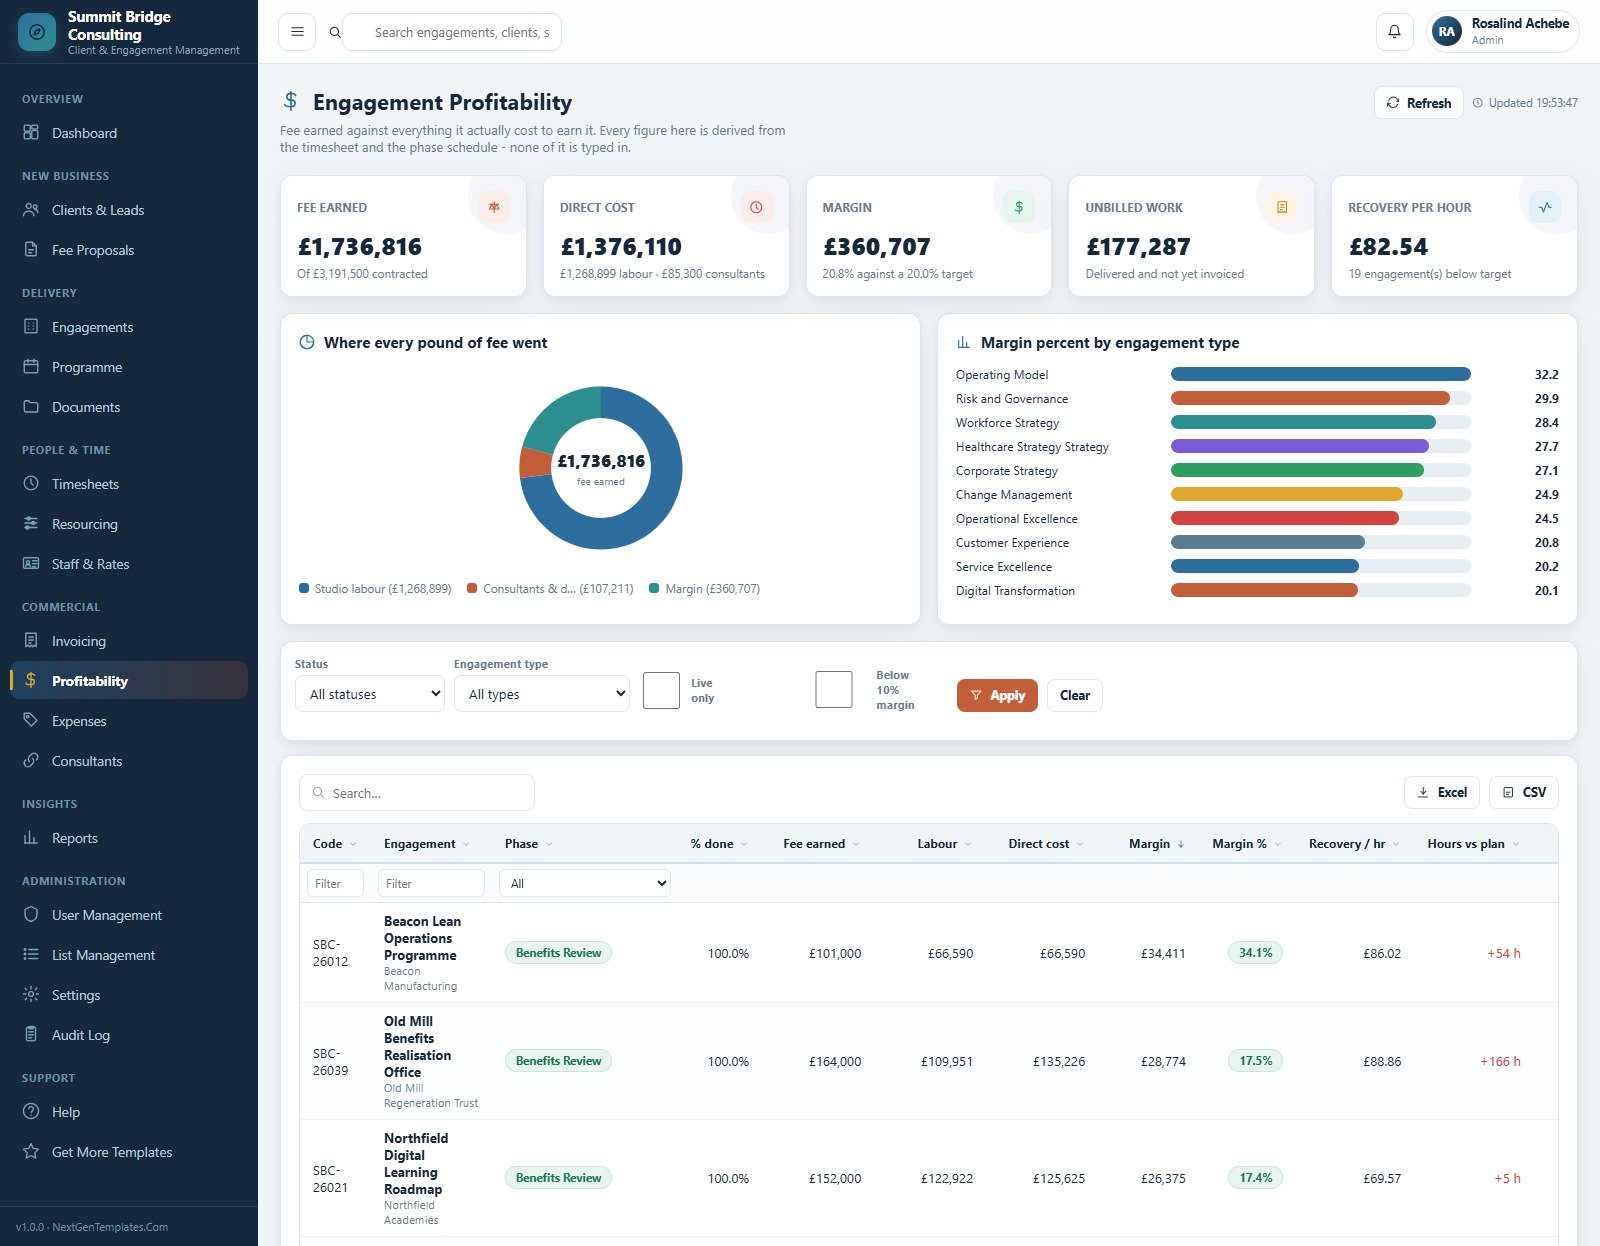
12. Engagement Profitability
Fee earned against everything it cost to earn it, with cards for fee earned, direct cost, margin, unbilled work and recovery per hour, plus Where Every Pound of Fee Went and Margin Percent by Engagement Type.
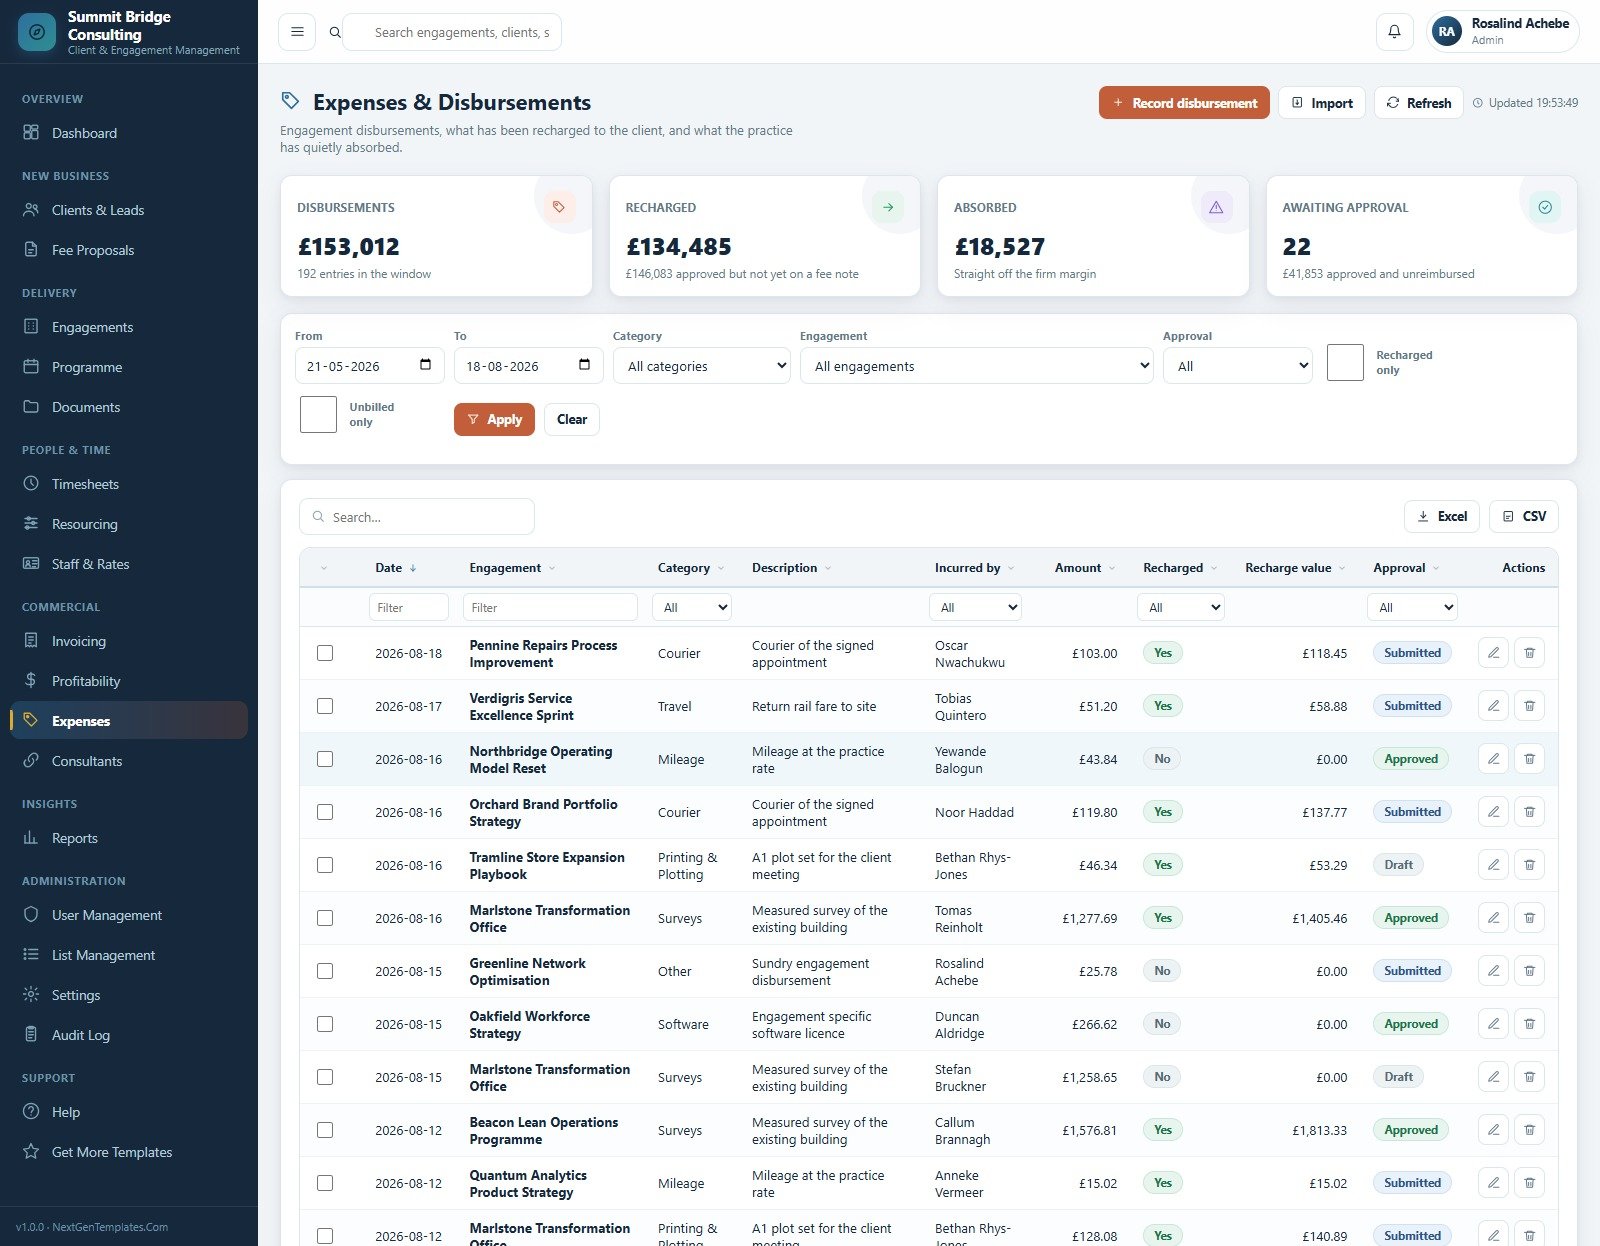
13. Expenses & Disbursements
Disbursements, what has been recharged and what the practice absorbed, across Travel, Mileage, Courier, Printing & Plotting, Surveys, Software and Other, each with an approval state.
14. Consultants
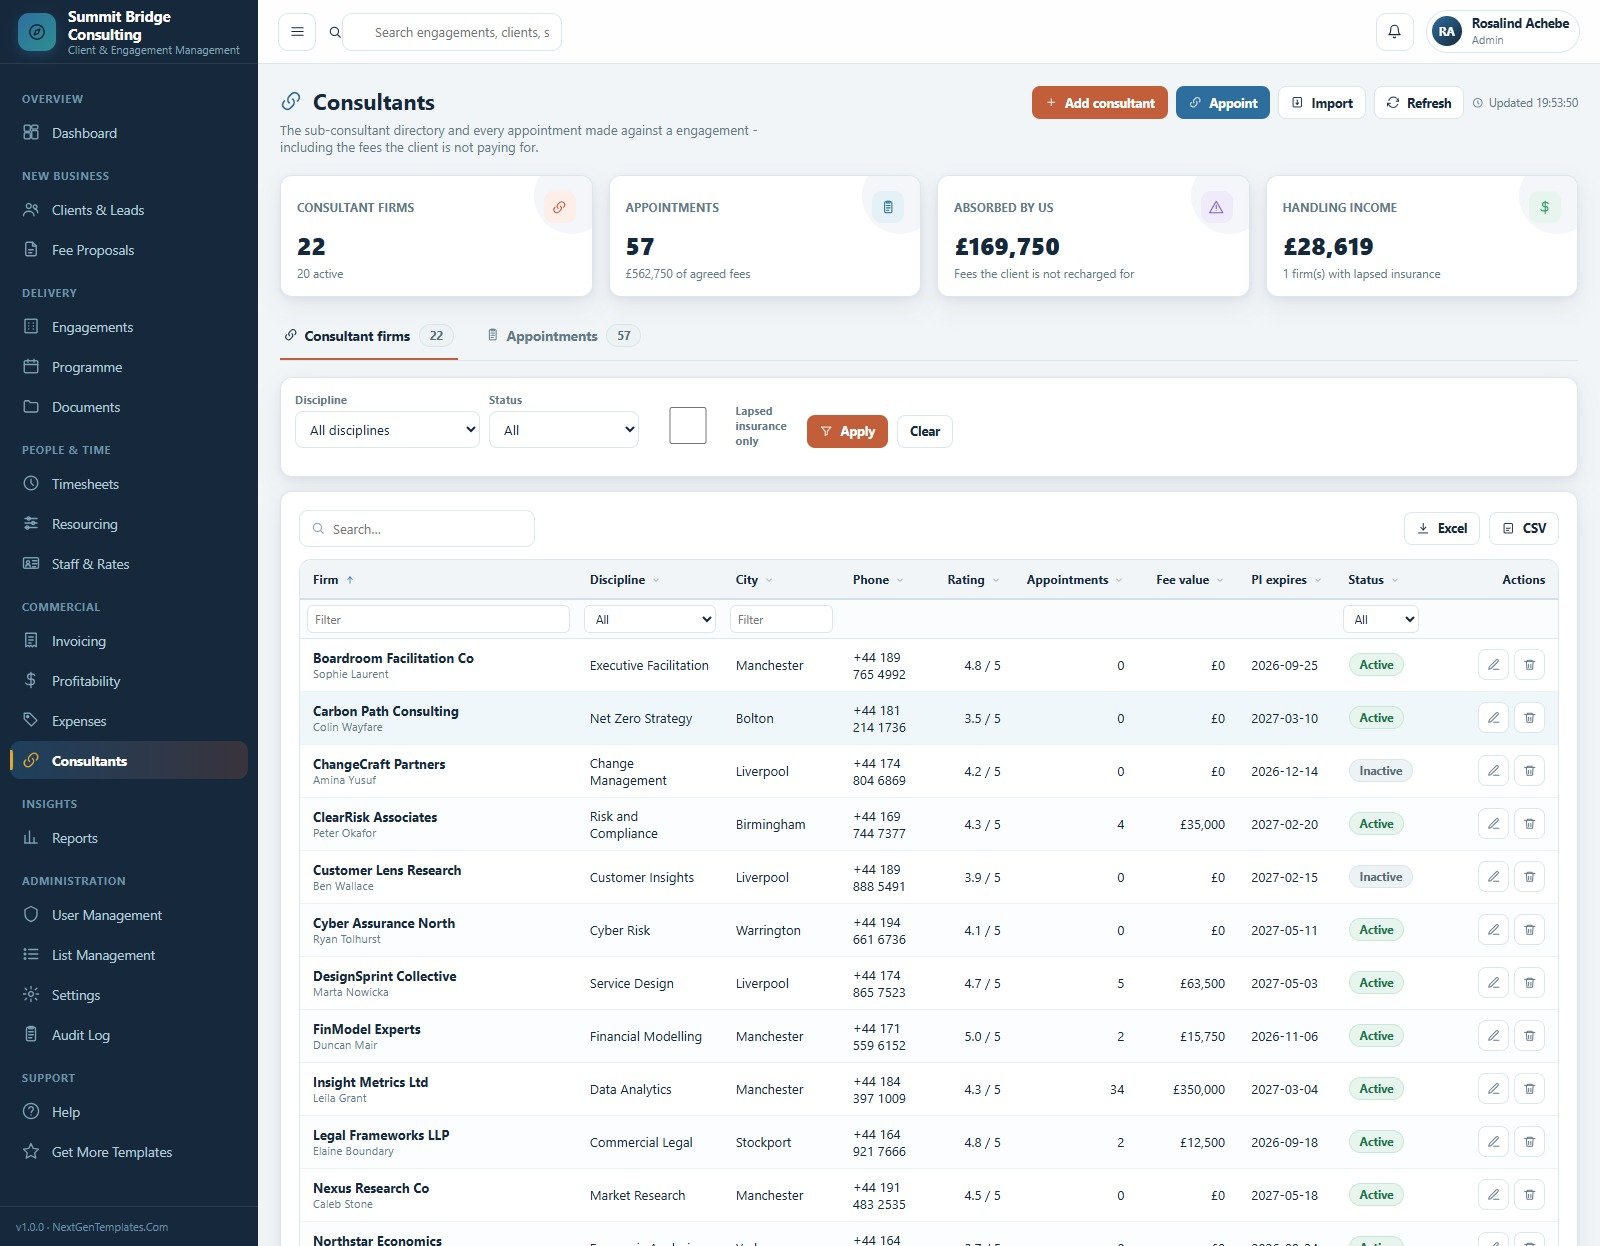
The sub-consultant directory and every appointment made against an engagement, with discipline, city, rating, appointment count, fee value and professional indemnity expiry.
15. Reports
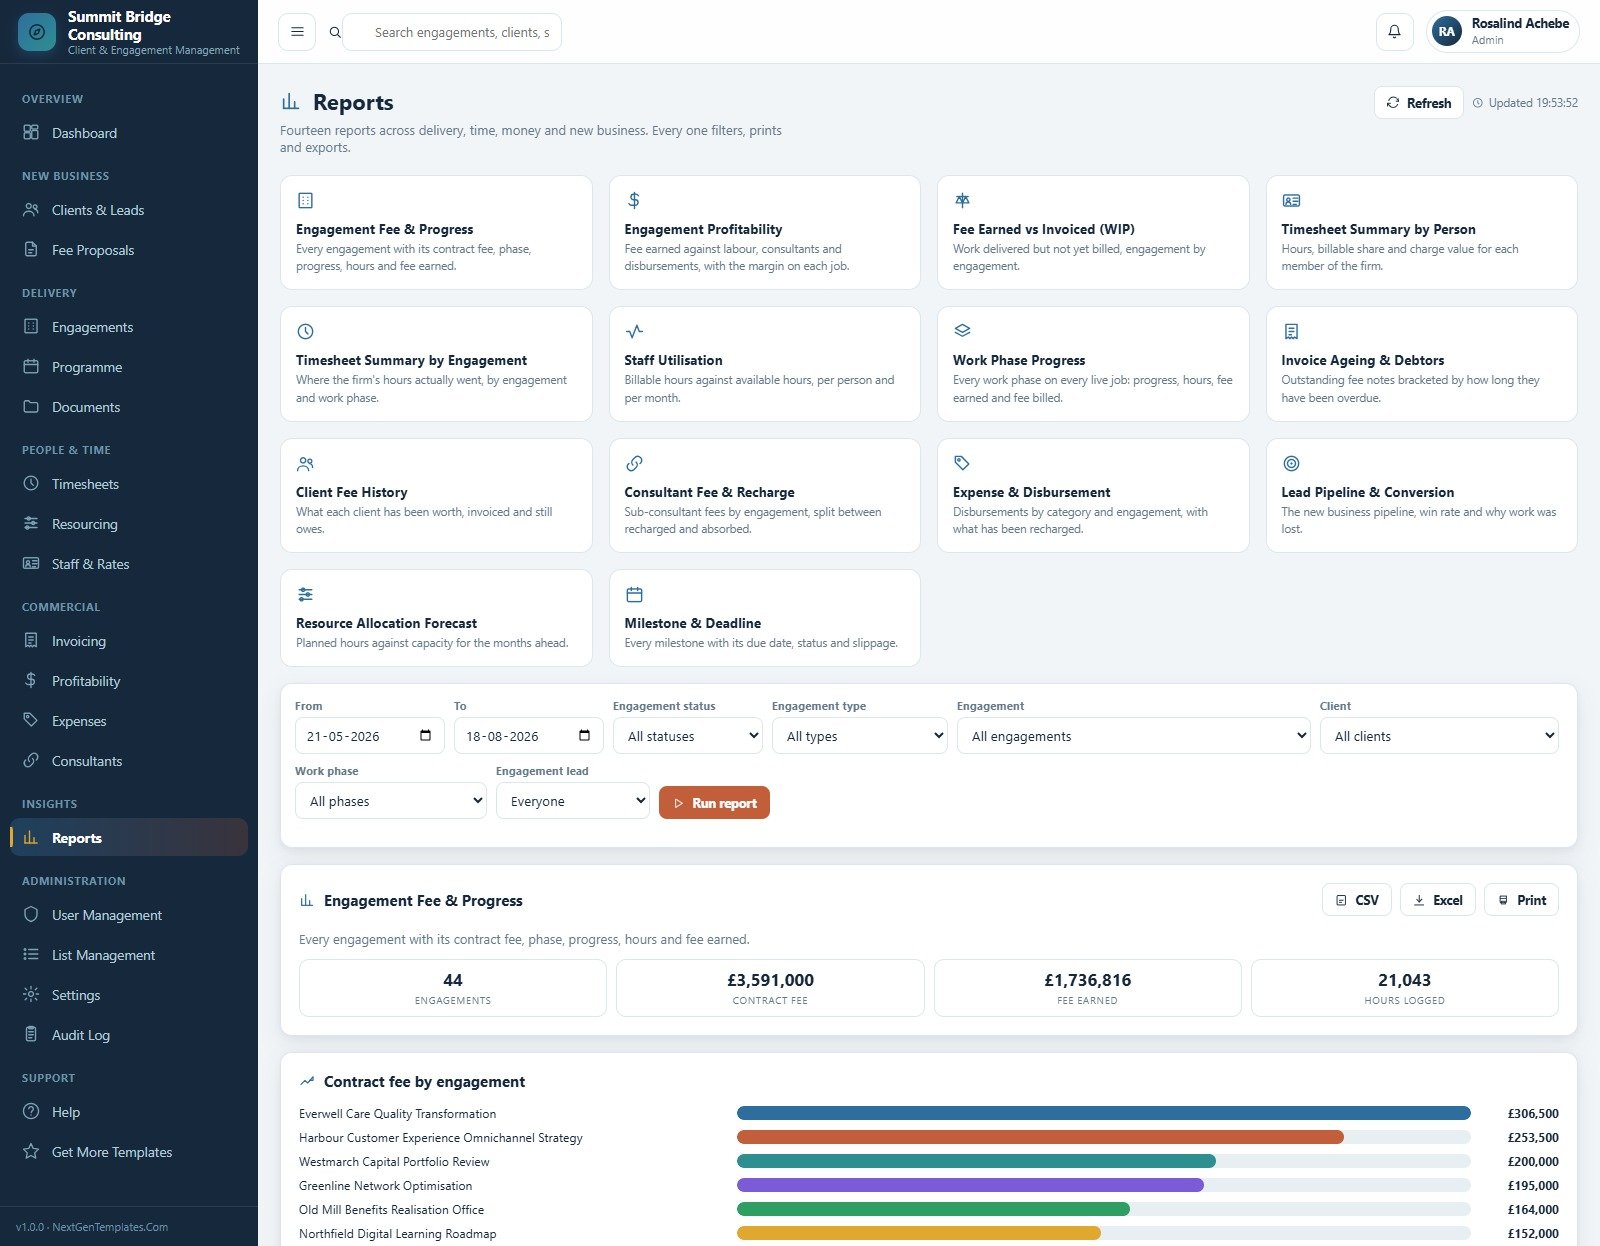
Fourteen reports covering engagement fee and progress, profitability, fee earned versus invoiced, timesheets by person and by engagement, staff utilisation, work phase progress, invoice ageing, client fee history, consultant recharge, disbursements, lead pipeline, resource forecast and milestones.
16. User Management
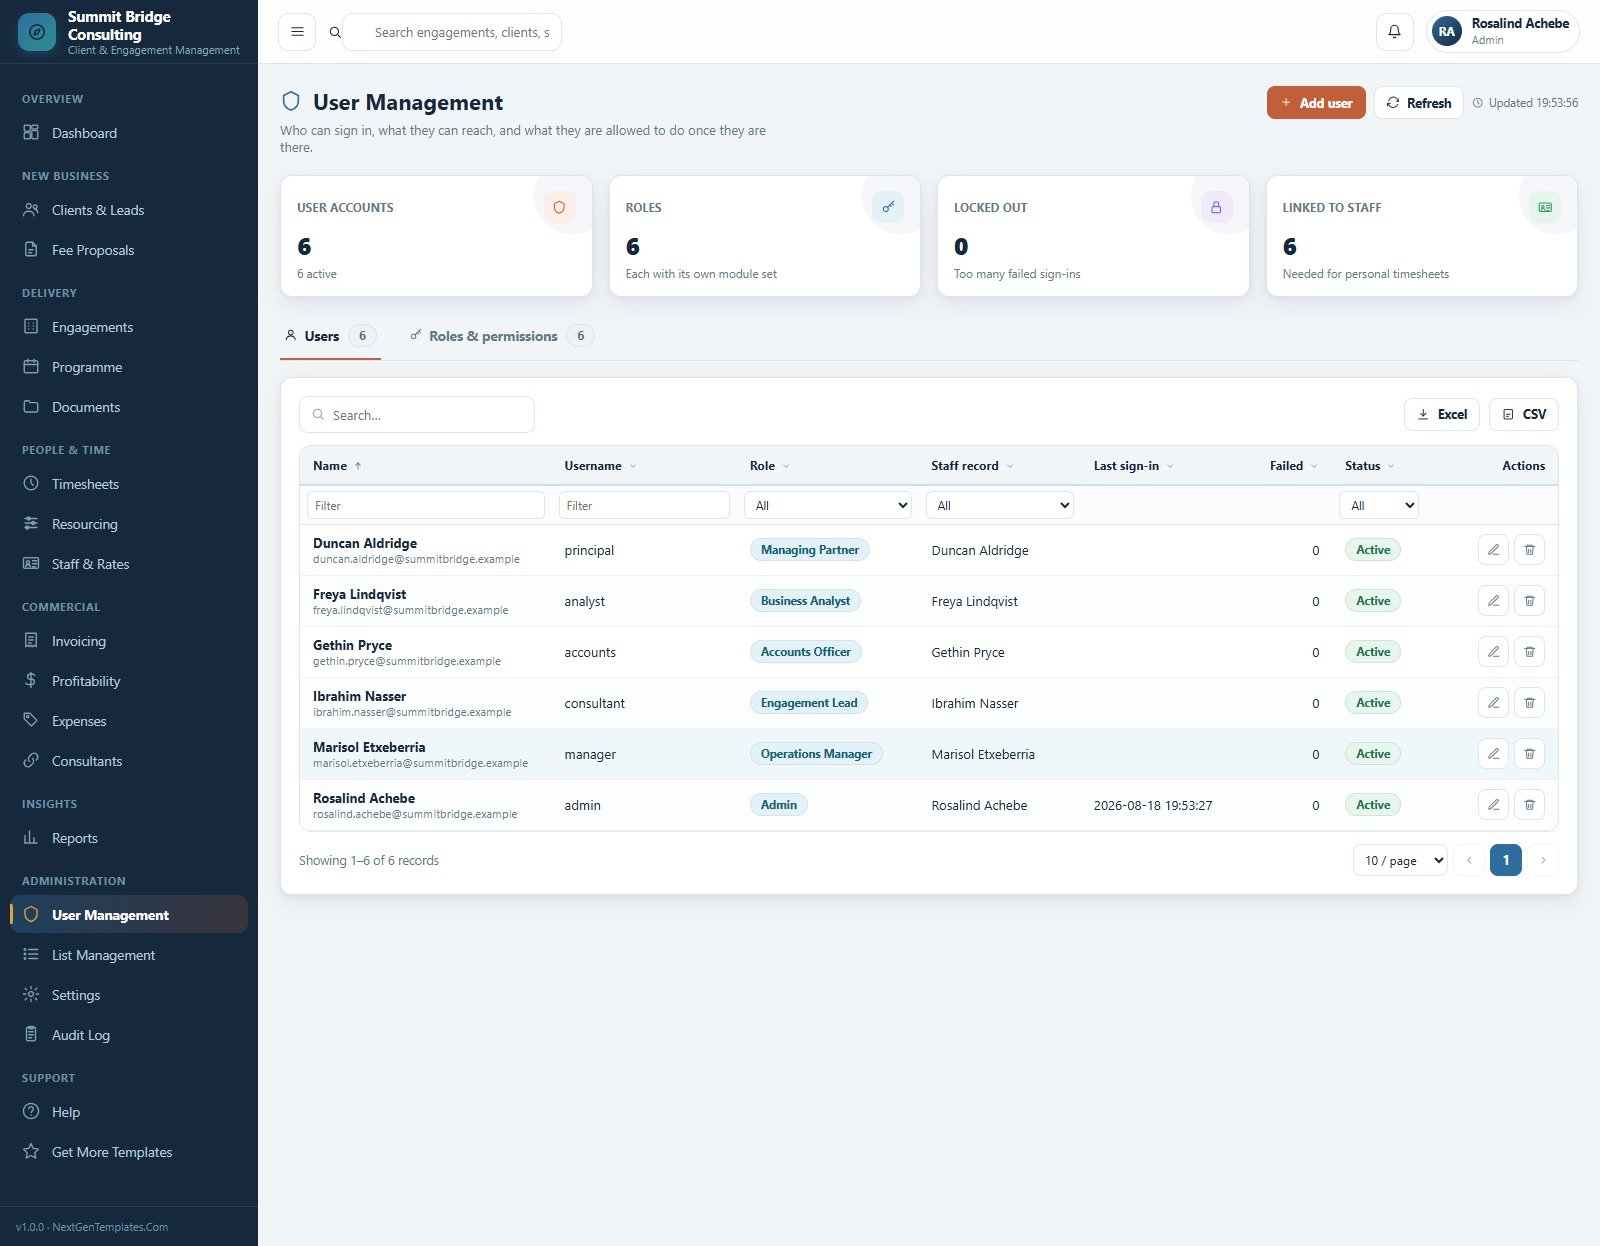
Who can sign in, which modules they reach and what they may do. Six roles ship configured, each linked to a staff record so personal timesheets work.
17. List Management
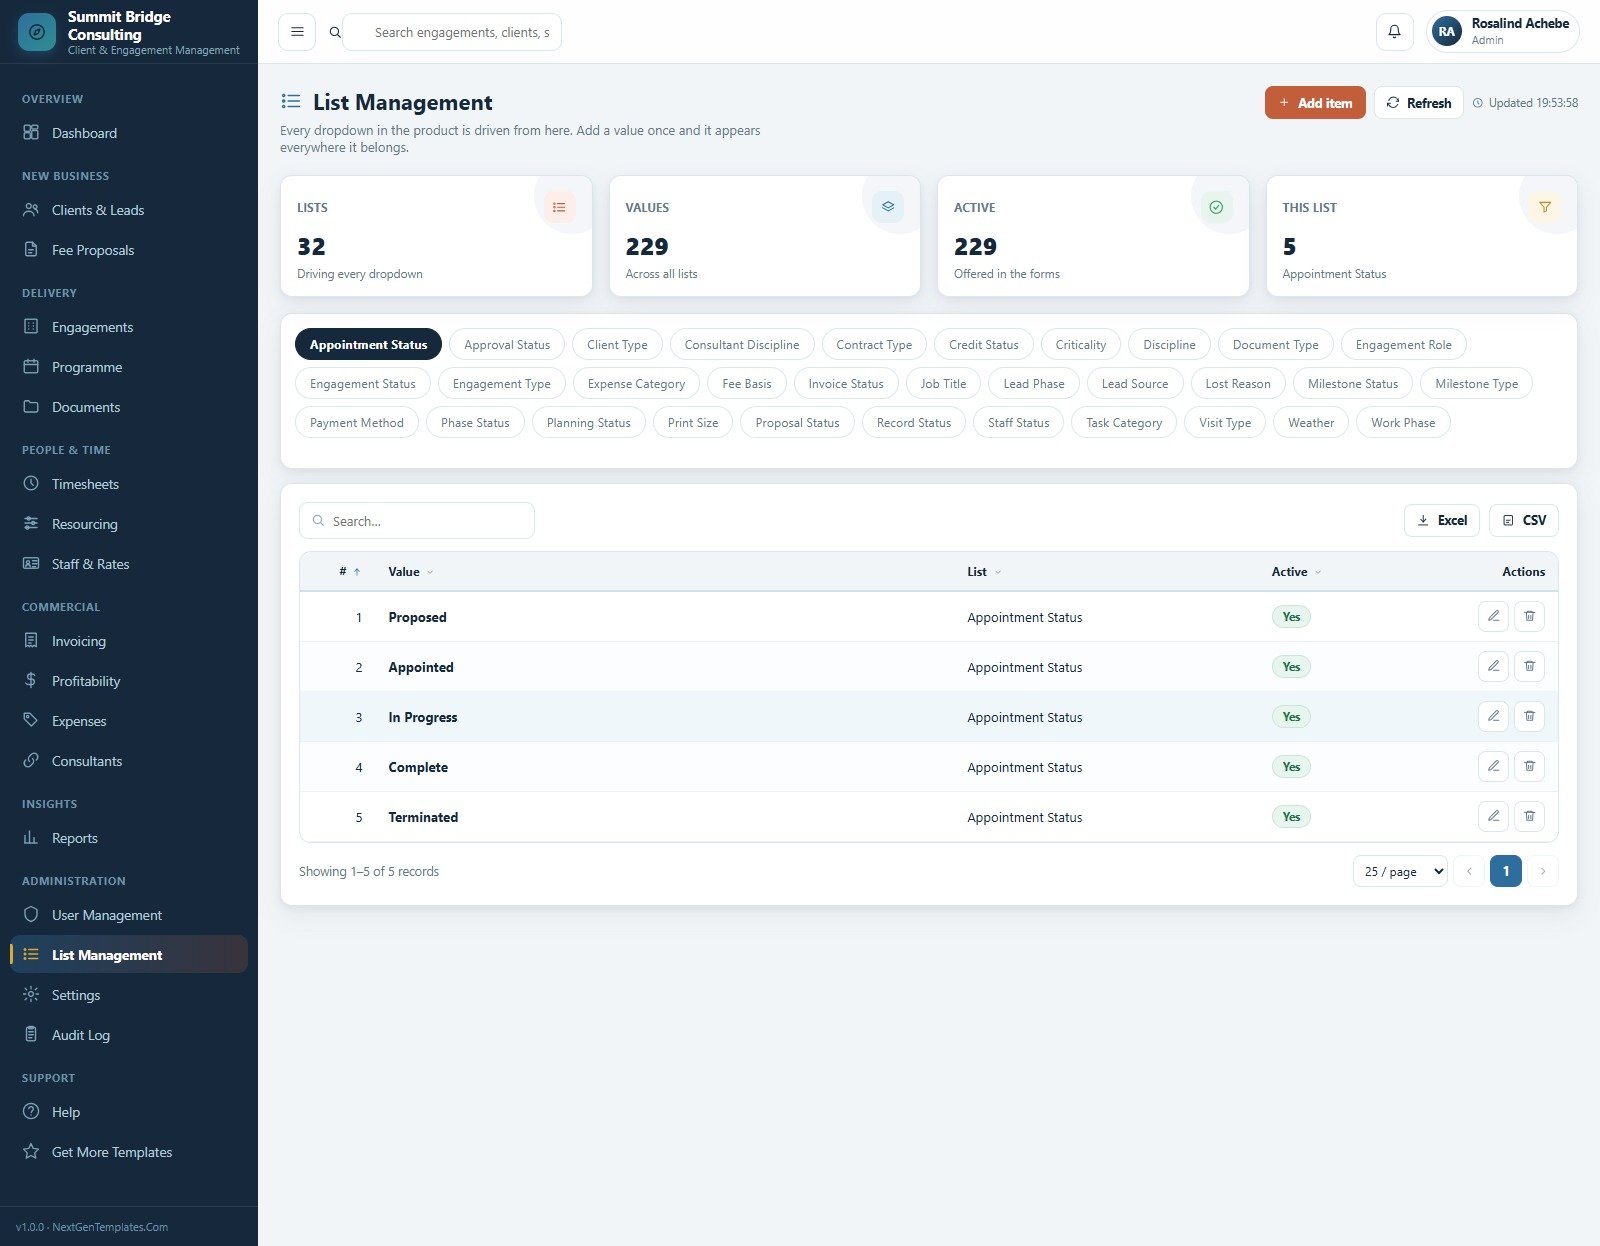
All 32 dropdown lists and their 229 values, including Work Phase, Engagement Type, Criticality, Expense Category, Lead Source, Lost Reason and Contract Type.
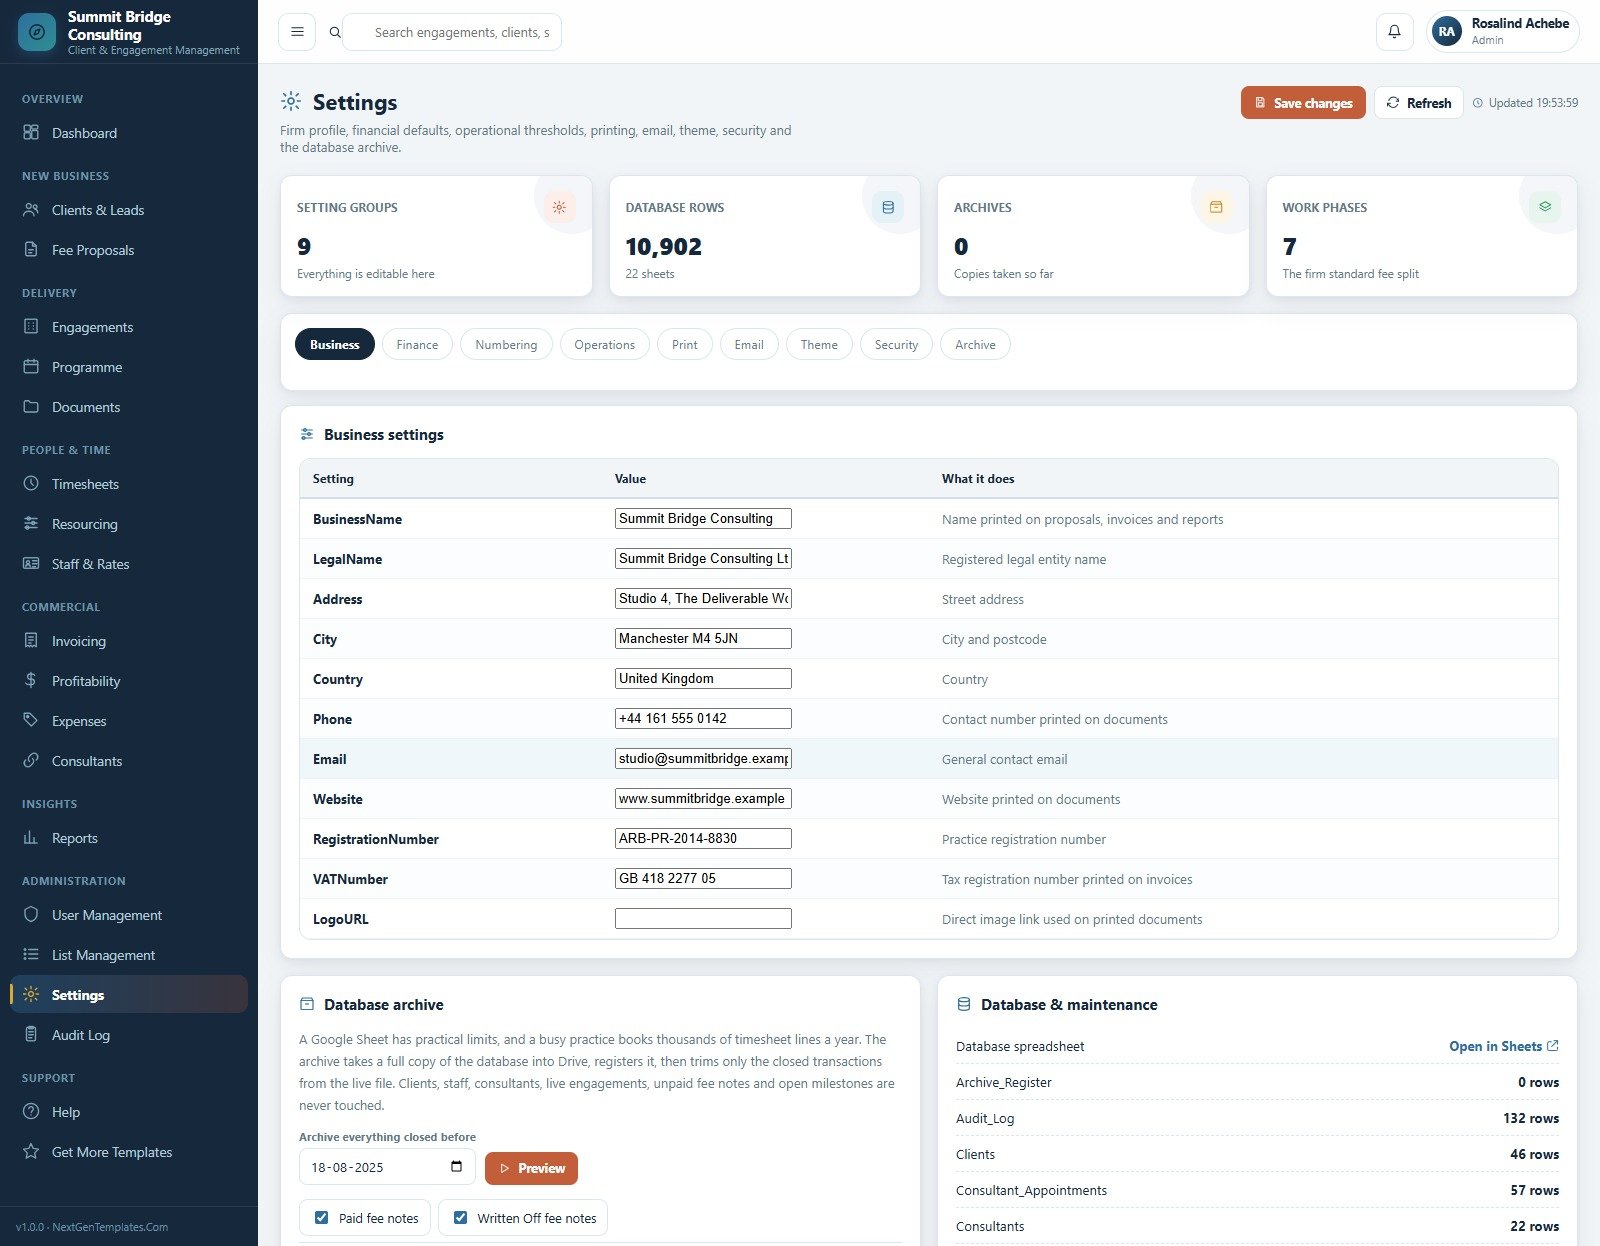
18. Settings
Nine setting groups — Business, Finance, Numbering, Operations, Print, Email, Theme, Security and Archive — plus a database archive that copies closed transactions to Drive and trims the live file.
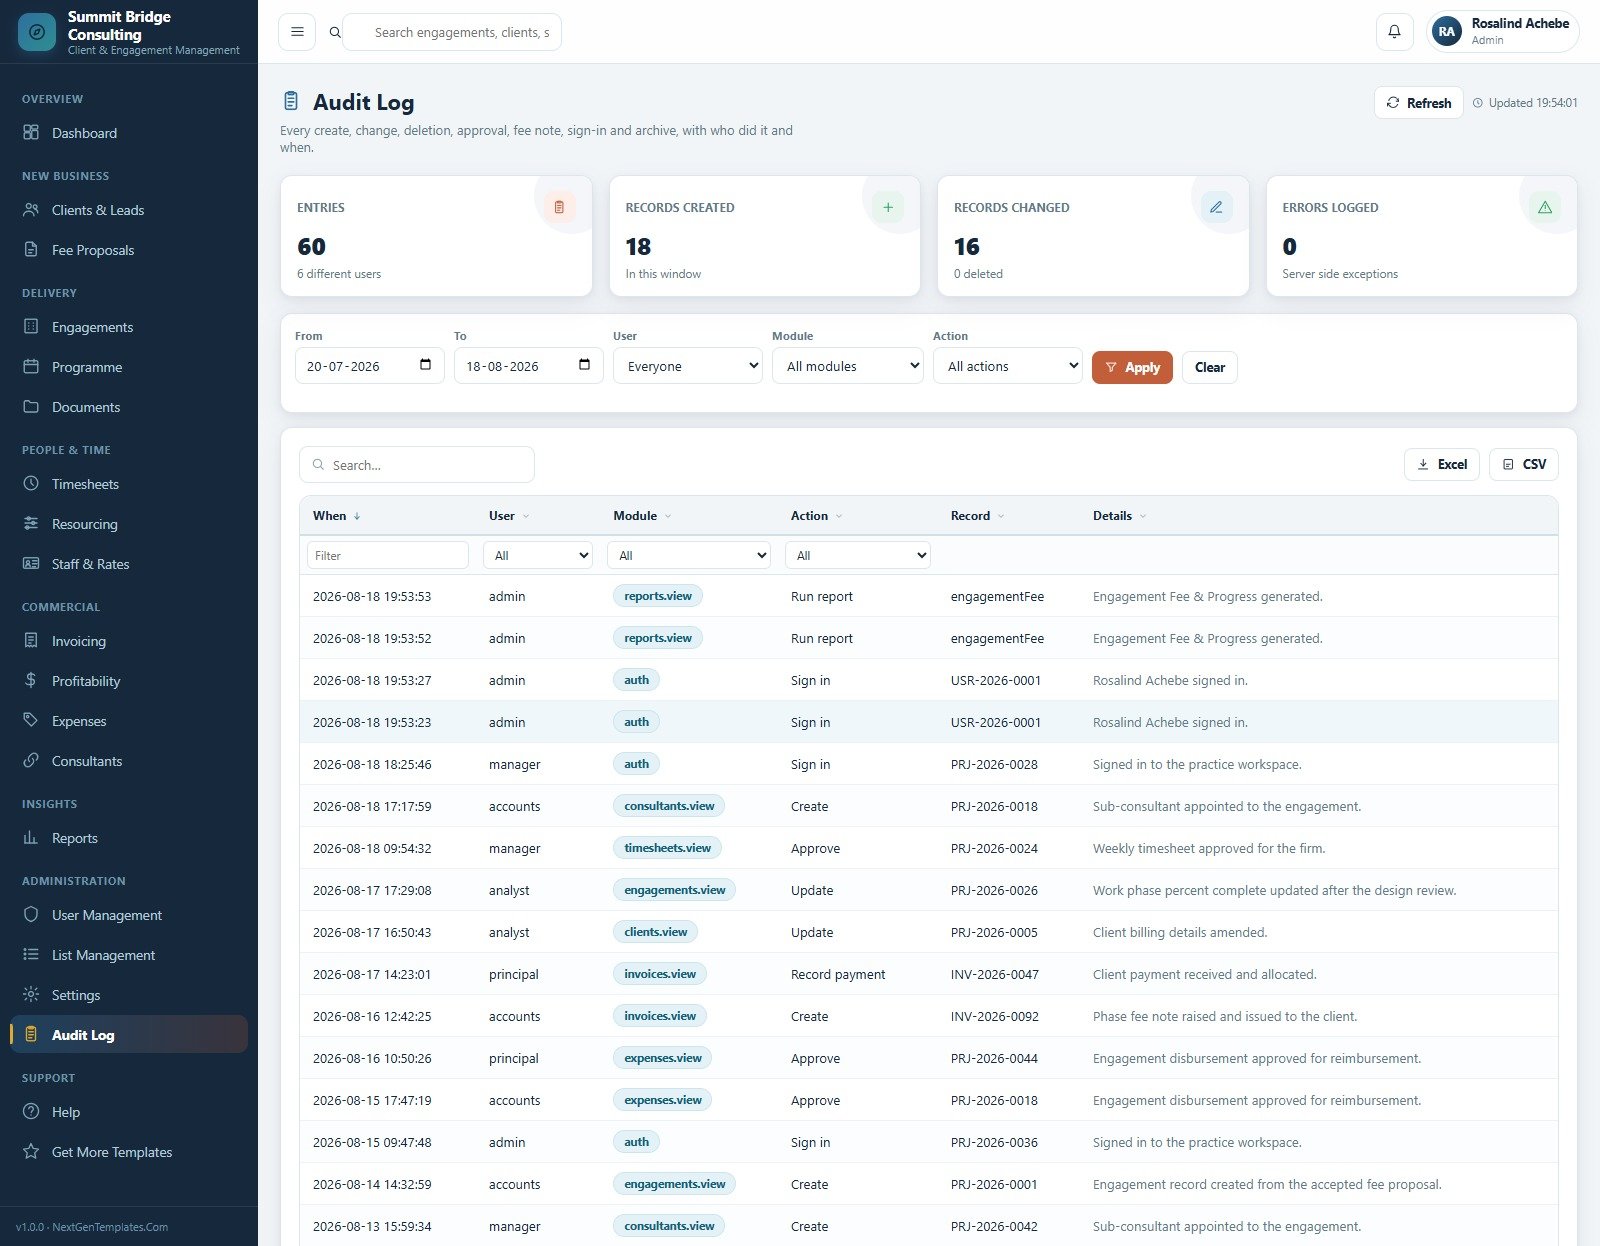
19. Audit Log
Every create, change, deletion, approval, fee note, sign-in and archive with the user, module, record reference and timestamp, filterable four ways.
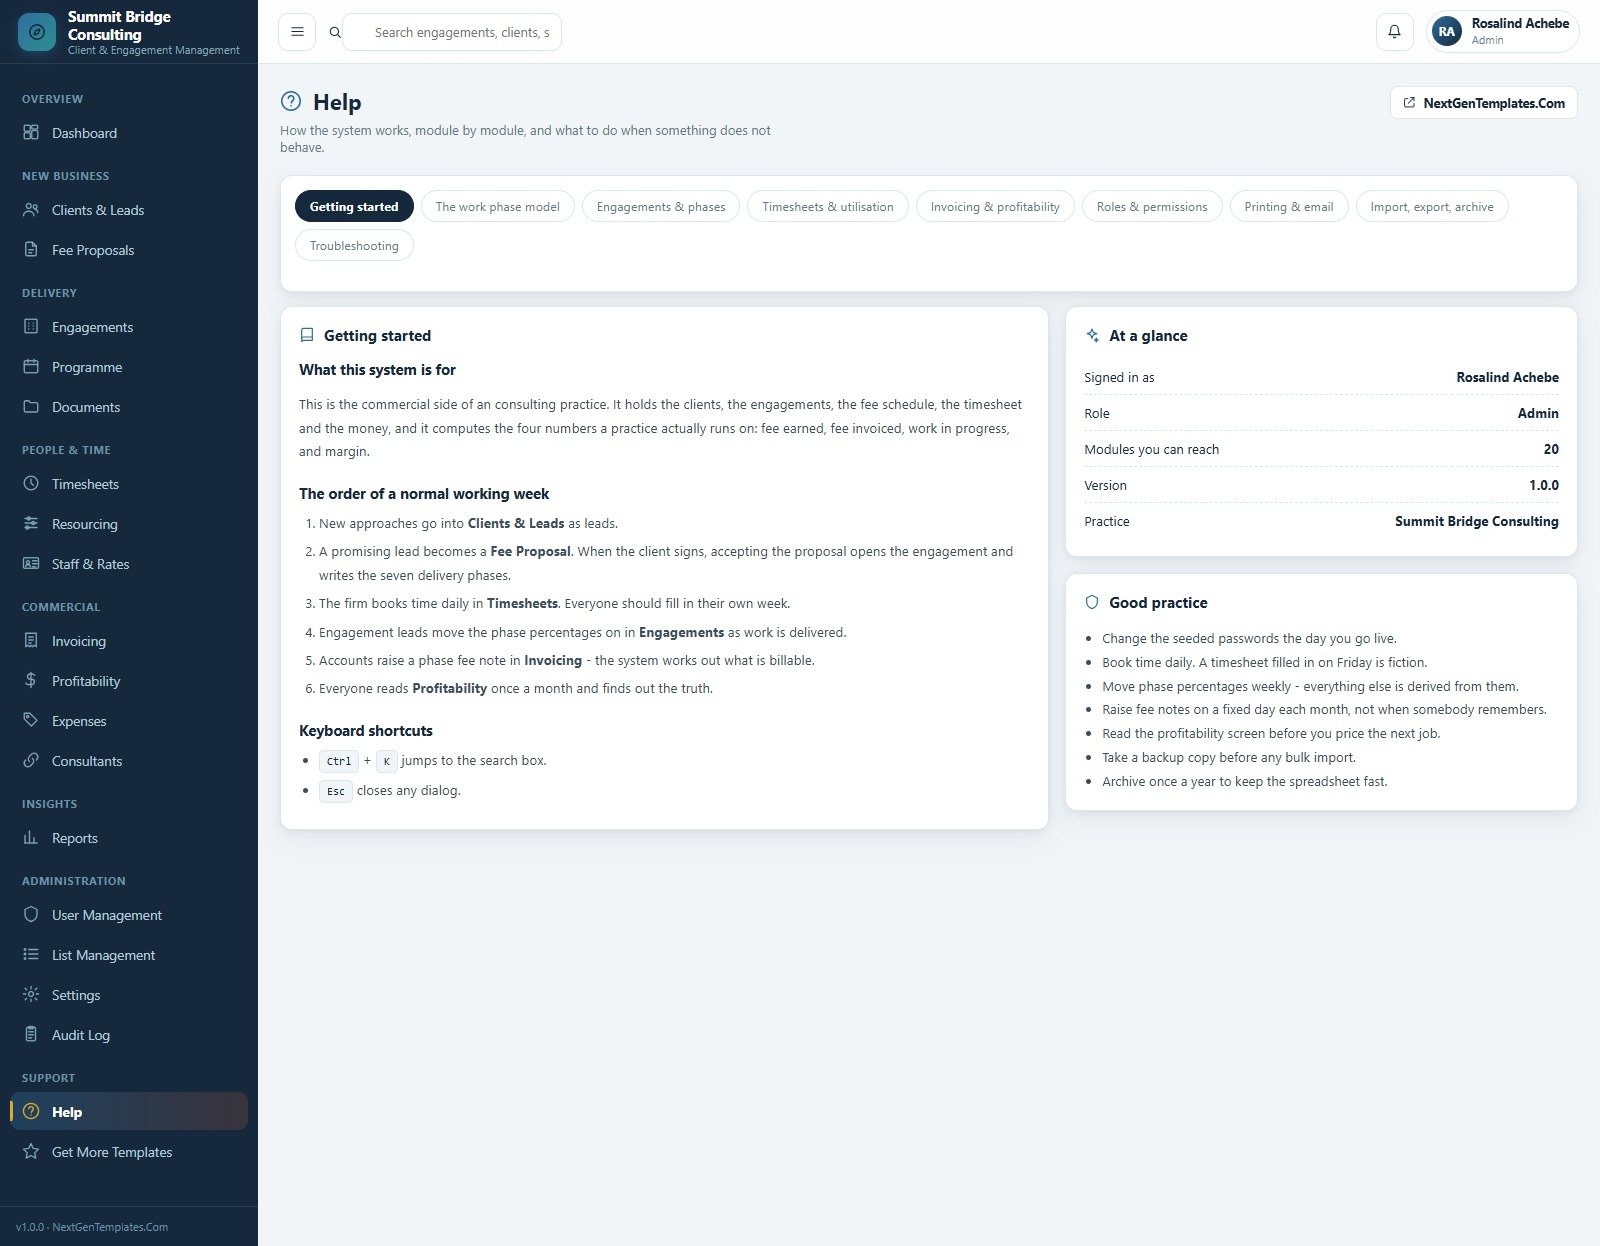
20. Help
Nine in-app help tabs covering getting started, the work phase model, engagements and phases, timesheets and utilisation, invoicing and profitability, roles and permissions, printing and email, import and archive, and troubleshooting.
Business Consulting Client Management System Web App vs. a Spreadsheet Tracker vs. Paid PSA Software — Feature Comparison
| Feature | This web app | Google Sheets / Excel tracker | Harvest / Scoro / Kantata |
|---|---|---|---|
| Cost | $39.99 one-time | Low cash cost, high build time | $12–$60 per user per month |
| Platform | Google Sheets database + Apps Script browser app | Spreadsheet tabs | Vendor-hosted cloud |
| Setup time | About 15 minutes to deploy 20 screens | Weeks of formula and form building | Onboarding plus configuration |
| Real-time team collaboration | Multi-user with login and roles | Shared editing, no roles | Yes |
| Mobile access | Any browser | Sheets app or browser | App or browser |
| Customisable fields | Lists, settings and source code all editable | Editable cells | Plan dependent |
| Seven-phase fee schedule | Built in | Only if hand-built | Usually a paid tier |
| Margin computed from timesheets | Yes, never typed in | Manual formulas | Yes |
| Year-1 cost at 5 users | $39.99 total | Template cost plus build time | $720–$3,600 |
For practices that want engagement margin, utilisation and phase billing without paying per seat every month, this system sits in the sweet spot.
Who Should Use This Template
Perfect for:
- Management, strategy and operations consultancies with roughly 5–60 fee earners
- Engagement leads who need burn and utilisation visible every week
- Practice managers replacing four disconnected spreadsheets
- Independent consultants who bill by phase and sub-contract specialist work
- Teams that want to own the source code rather than rent a seat
Not a fit if:
- You need SSO, SOC 2 attestation or a vendor support contract
- You require native accounting sync with Xero, QuickBooks or NetSuite
- You want a client-facing portal with external logins
- You have no Google Workspace or personal Google account available
Real-World Use Cases
Rosalind, consulting director at a 26-person strategy firm. Every Monday she opens the dashboard, filters engagements to at-risk only, and sees which jobs are burning hours faster than progress. She then checks the resourcing heat grid before agreeing to any new scope, because two of her consultants are already over 150% of monthly capacity.
Duncan, managing partner, pricing new work. Before quoting, he opens Engagement Profitability, filters to the same engagement type, and reads recovery per hour and margin percent on comparable completed jobs. His fee is based on what similar work actually returned rather than on a guess.
Gethin, accounts officer. He raises phase fee notes on the same day each month, watches the debtor ageing brackets, and chases overdue notes from the same screen — no separate receivables workbook, no reconciling two versions of the same invoice list.
Advantages of the Business Consulting Client Management System Web App
The biggest advantage is arithmetic honesty. Because fee earned comes from the phase schedule and cost comes from booked timesheet hours multiplied by cost rates, nobody can quietly improve a margin figure by typing over it. That single design decision makes the profitability screen trustworthy enough to price the next job from.
The second advantage is cost. A five-person practice on a mid-tier PSA platform spends roughly $720 to $3,600 in the first year. This is a one-time purchase with the source code included, which means no per-seat maths when a new consultant joins.
The third is ownership. The data lives in your own Google Sheet, in your own Drive, and the app runs in your own Apps Script project. There is no export request and no vendor lock-in if you decide to change approach later.
Opportunities for Improvement
Being honest about the limits matters more than a longer feature list. There is no accounting integration — fee notes are raised and tracked here, but posting them to Xero or QuickBooks is a manual step. There is no client-facing portal, so clients cannot log in to view progress or download documents themselves.
Google Sheets also has practical row limits, which is why the archive tool exists. A busy practice booking thousands of timesheet lines a year should run the archive annually rather than waiting for the file to slow down. Finally, there is no native mobile app; the interface is responsive in a browser, but a consultant booking time on a phone will find a laptop more comfortable.
Best Practices
- Change the seeded passwords on day one. The system ships with demo accounts for every role.
- Book time daily. A timesheet filled in on Friday afternoon is fiction, and every utilisation and margin number depends on it.
- Move phase percentages weekly. Everything downstream is derived from them, so a stale percentage produces a stale margin.
- Raise fee notes on a fixed calendar day rather than when someone remembers, which is what keeps the debtor ageing meaningful.
- Read Profitability before pricing the next job, not after the job has gone wrong.
- Take a backup copy before any bulk import, and run the archive once a year.
Explore Relevant Templates
- Consulting Project and Billing Management System Web App — quotation-to-project workflow with GST and export invoicing.
- Construction Project Management System Web App — the same phase-and-billing model for construction delivery.
- Civil Contractor Job Management System Web App — job costing and site records for contracting teams.
- Client Billing and Invoice Management Dashboard in Google Sheets — a lighter reporting-only option.
- Cold Storage Management System Web App and Civil Contractor Job Management System Web App — more Apps Script systems built the same way.
Want to build skills like this step by step? The NextGenTemplates Academy learning paths cover the spreadsheet foundations behind management systems, with practice files.
Get the Business Consulting Client Management System Web App
Frequently Asked Questions
What does the Business Consulting Client Management System Web App include?
The Business Consulting Client Management System Web App includes 20 modules covering the dashboard, clients and leads, fee proposals, engagements, programme, documents, timesheets, resourcing, staff rates, invoicing, profitability, expenses, sub-consultants, 14 reports, users, lists, settings, audit log and in-app help.
How long does setup take?
Deployment takes about 15 minutes. You paste Code.gs and Index.html into a new Google Apps Script project, deploy it as a web app, sign in with the seeded admin account and change the passwords. Firm profile and staff rate setup usually takes another hour.
How does this compare to Harvest, Scoro or Kantata?
Those platforms charge $12–$60 per user per month and host your data. The Business Consulting Client Management System Web App is a one-time purchase that runs in your own Google account, with the source code included so you can change fields, phases and reports yourself.
How is engagement margin calculated?
Margin is derived, never typed. Fee earned comes from the phase schedule, studio labour cost comes from booked timesheet hours at each person’s cost rate, and sub-consultant cost comes from appointments. The result is shown in currency and as a percent against target.
Can different people see different modules?
Yes. Six roles ship configured — Managing Partner, Consulting Director, Engagement Lead, Operations Manager, Accounts Officer and Business Analyst — each with its own module set, and every action is written to the Audit Log.
Will the Google Sheet slow down as data grows?
The Settings module includes a database archive that copies closed transactions into Drive and trims them from the live file. Clients, staff, sub-consultants, live engagements, unpaid fee notes and open milestones are never touched by the archive.
Can I rename the seven work phases?
Yes. List Management drives all 32 dropdown lists and their 229 values, so work phases, engagement types, expense categories and lost reasons can be renamed without touching code. The source files remain editable for deeper changes.Business Consulting Client Management System Web App
About the Author
Built by PK — Microsoft Certified Professional with 15+ years of Excel, Google Sheets, and Power BI experience. Founder of NextGenTemplates, reaching 300K+ subscribers across YouTube channels. Every template is hand-built and tested before release.Business Consulting Client Management System Web App
Conclusion
If your practice is currently reconciling a time sheet, a fee tracker, an invoice list and a resourcing plan that never quite agree, this system replaces all four with one set of numbers that derive from each other. Twenty modules, seven phases, fourteen reports, and a margin figure nobody can type over.Business Consulting Client Management System Web App
Instant download · One-time payment · No subscription
Last updated: August 2026Business Consulting Client Management System Web App