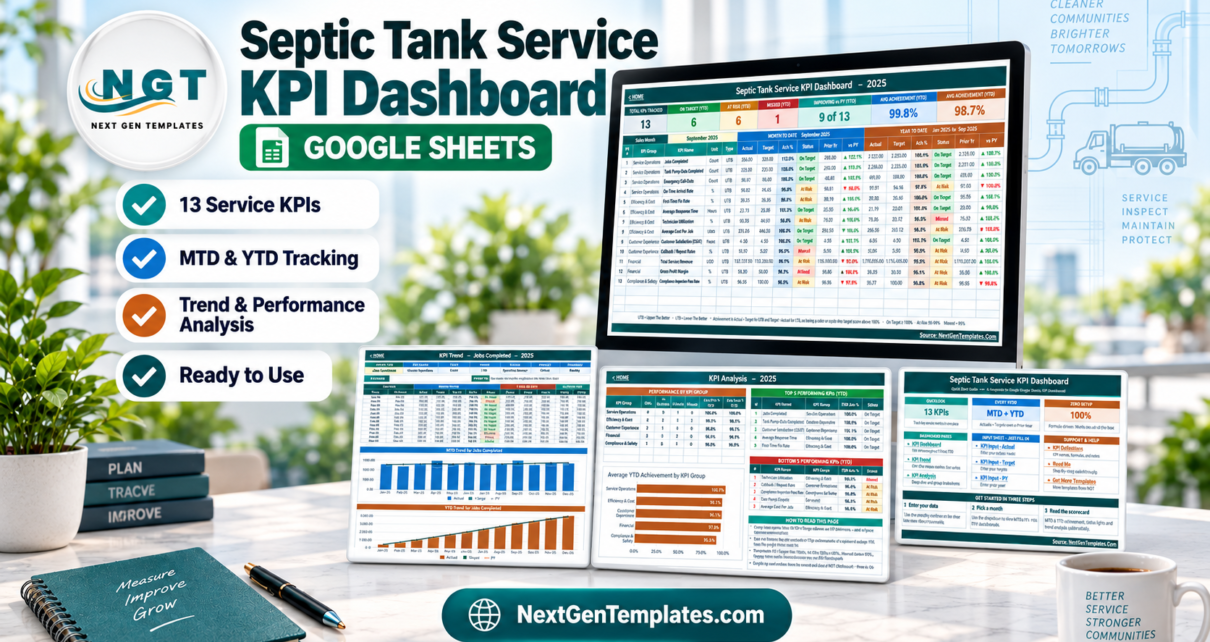
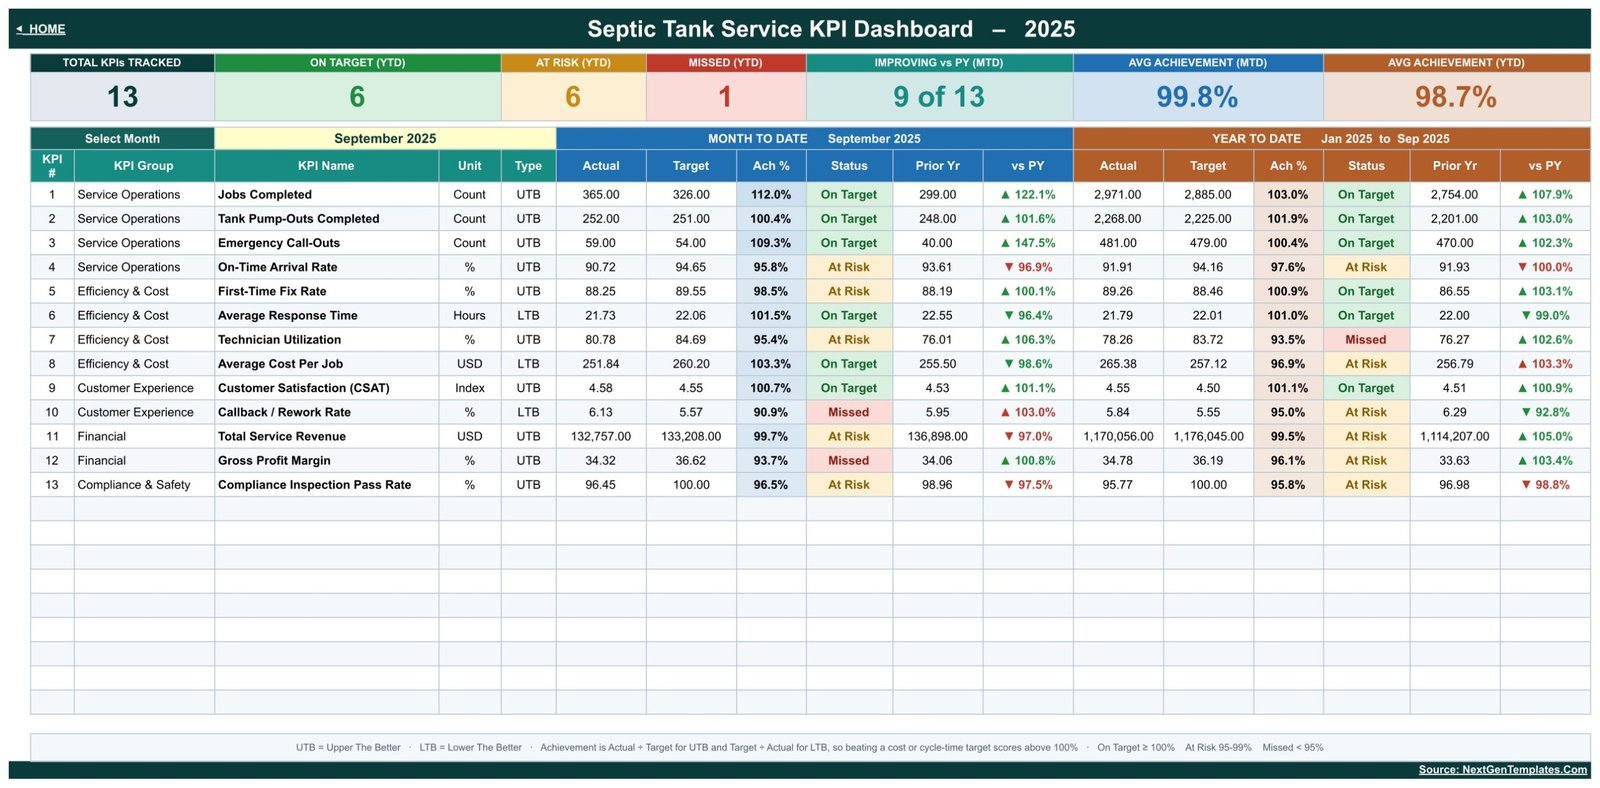
Septic-service leaders often have the numbers but not one place to read them. The Septic Tank Service KPI Dashboard in Google Sheets organizes 13 operational, cost, customer, financial, and compliance metrics into one monthly scorecard. In its September sample, 6 KPIs are on target YTD, 6 are at risk, 1 is missed, and 9 of 13 are improving against prior year. Average achievement is 99.8% MTD and 98.7% YTD. Those figures are sample data, not a promise about your business; their purpose is to show exactly how the traffic lights, comparisons, and rankings work before you enter your own numbers.
Key Features of the Septic Tank Service KPI Dashboard in Google Sheets
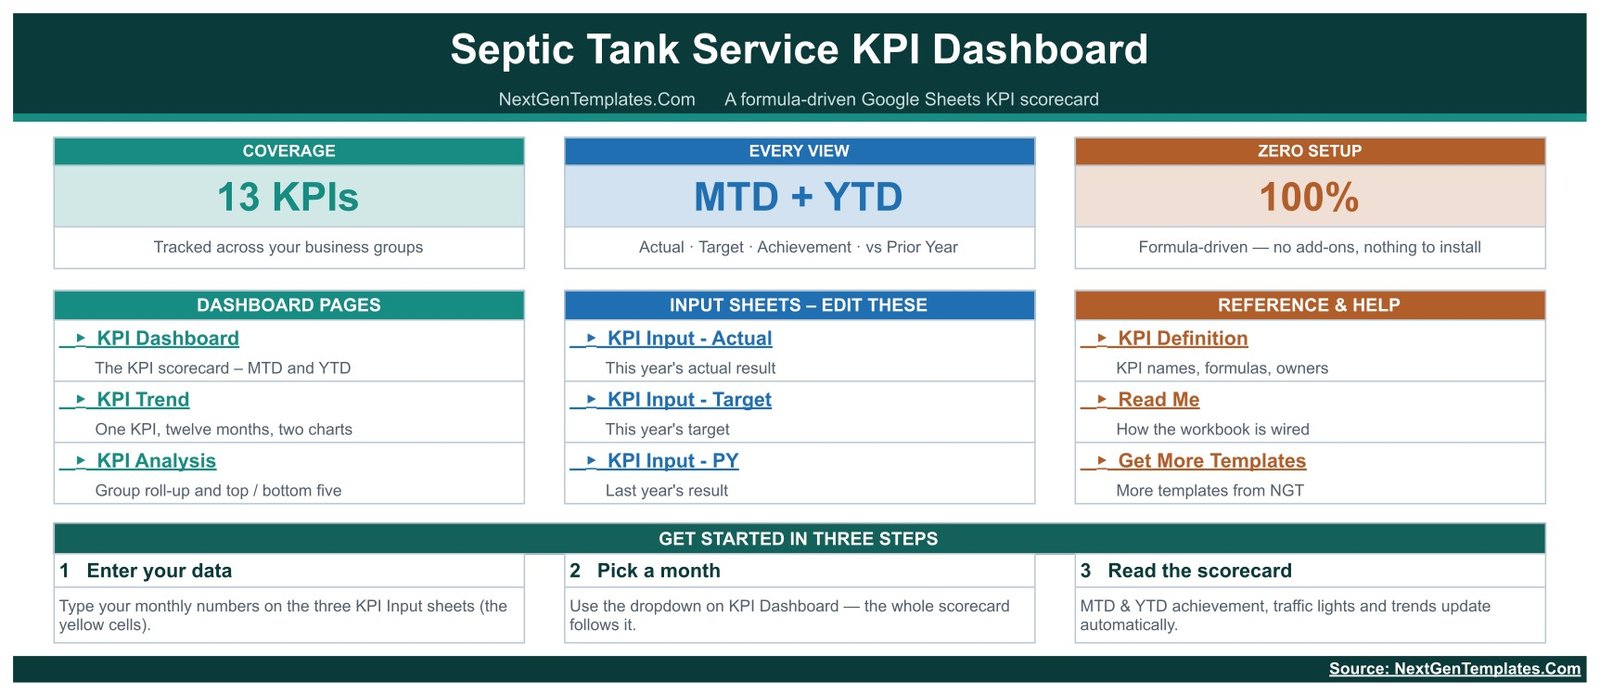
This is the KPI Dashboard family: a month picker, MTD/YTD scorecard, trend and analysis pages, and separate actual, target, and previous-year inputs. It is different from the analytical Google Sheets Dashboard family and from the smaller KPI Scorecard family.
- 13 supplied KPIs in Service Operations, Efficiency & Cost, Customer Experience, Financial, and Compliance & Safety.
- MTD and YTD together, including actual, target, achievement percentage, status, prior year, and comparison.
- Three status bands: On Target at 100%+, At Risk at 95%-99%, and Missed below 95%.
- UTB/LTB logic so lower response times, rework rates, and costs score in the correct direction.
- Twelve-month trend views for a selected KPI, with Actual, Target, and PY series.
- Group analysis and rankings showing average MTD/YTD achievement and top/bottom five KPIs.
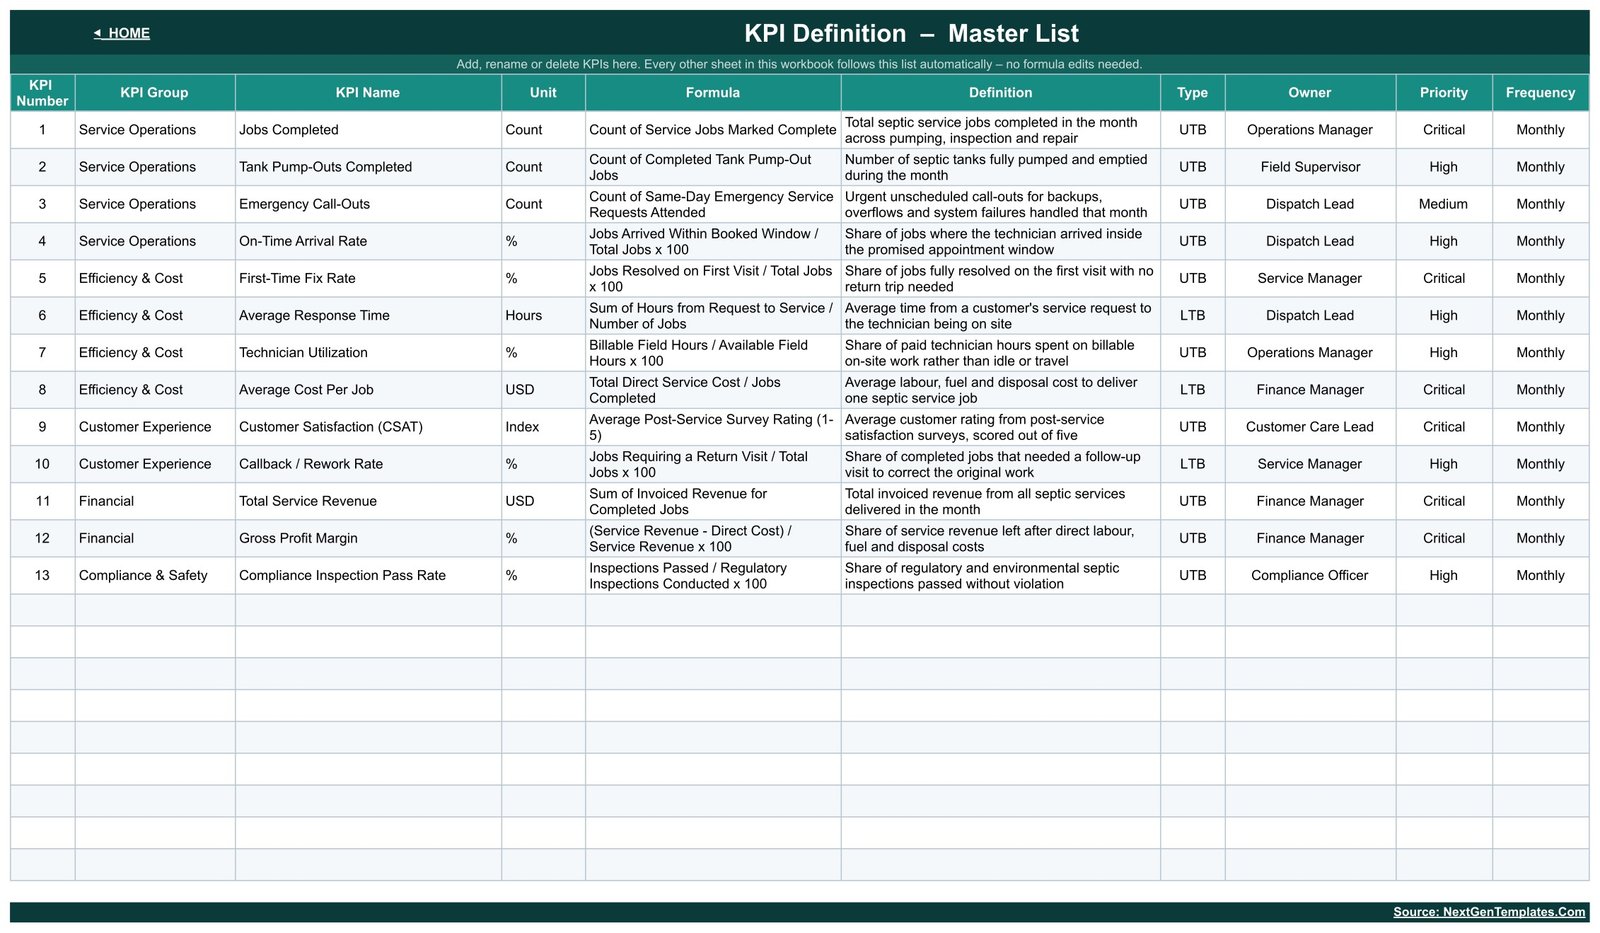
- Editable master definitions with formula, owner, priority, and frequency fields.
- No scripts or add-ons; ordinary Google Sheets formulas recalculate the pages.
Dashboard Pages Explanation
KPI Dashboard
The main scorecard has seven headline cards: 13 KPIs tracked, 6 on target YTD, 6 at risk YTD, 1 missed YTD, 9 of 13 improving versus prior year MTD, 99.8% average achievement MTD, and 98.7% average achievement YTD. The September table then shows each KPI’s MTD and YTD actual, target, achievement, status, previous-year result, and directional comparison.
KPI Trend
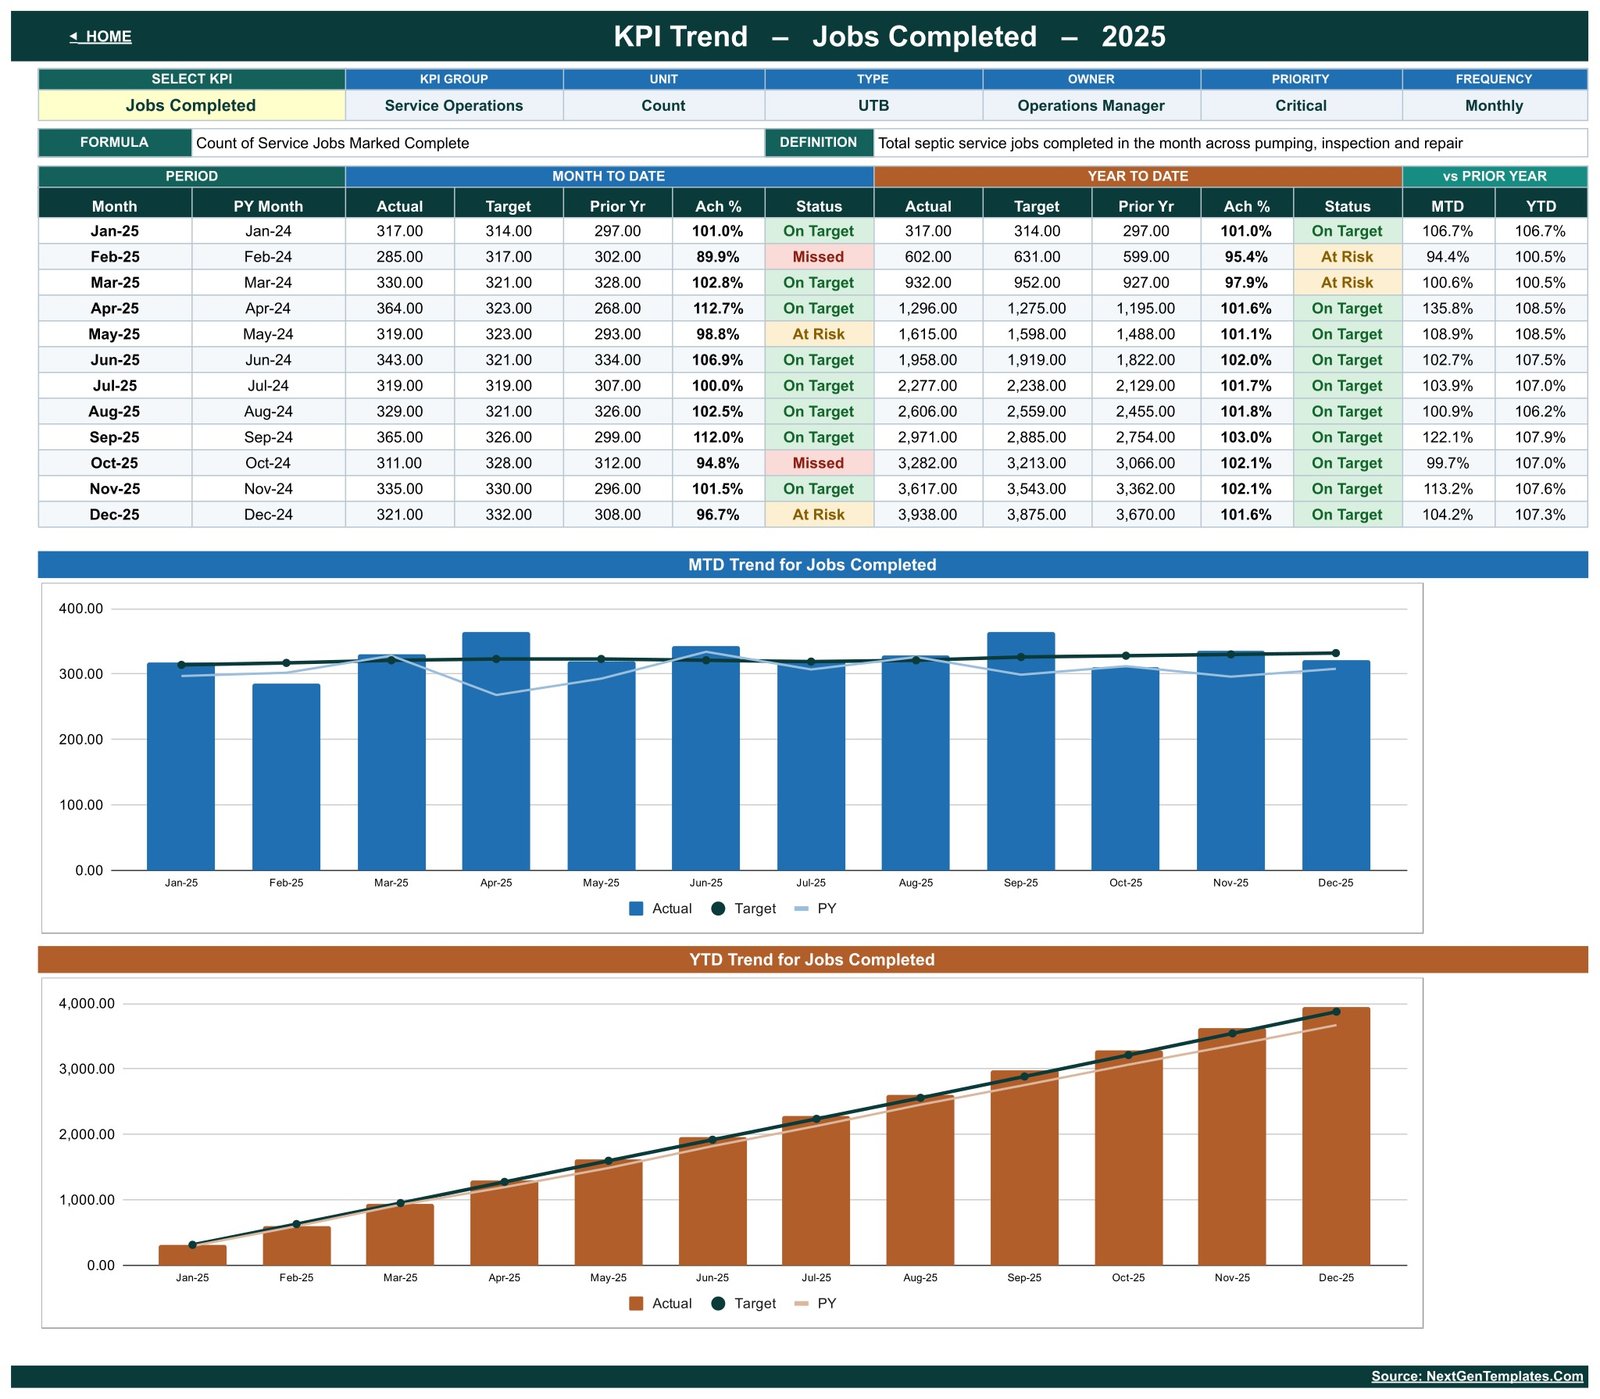
Select one metric and the page shows its group, unit, UTB/LTB type, owner, priority, frequency, formula, and definition. A twelve-row table and two charts compare Actual, Target, and PY on MTD and cumulative YTD bases. For Jobs Completed, the sample ranges from 285 in February to 365 in September and makes the seasonal pattern visible without hiding the target.
KPI Analysis
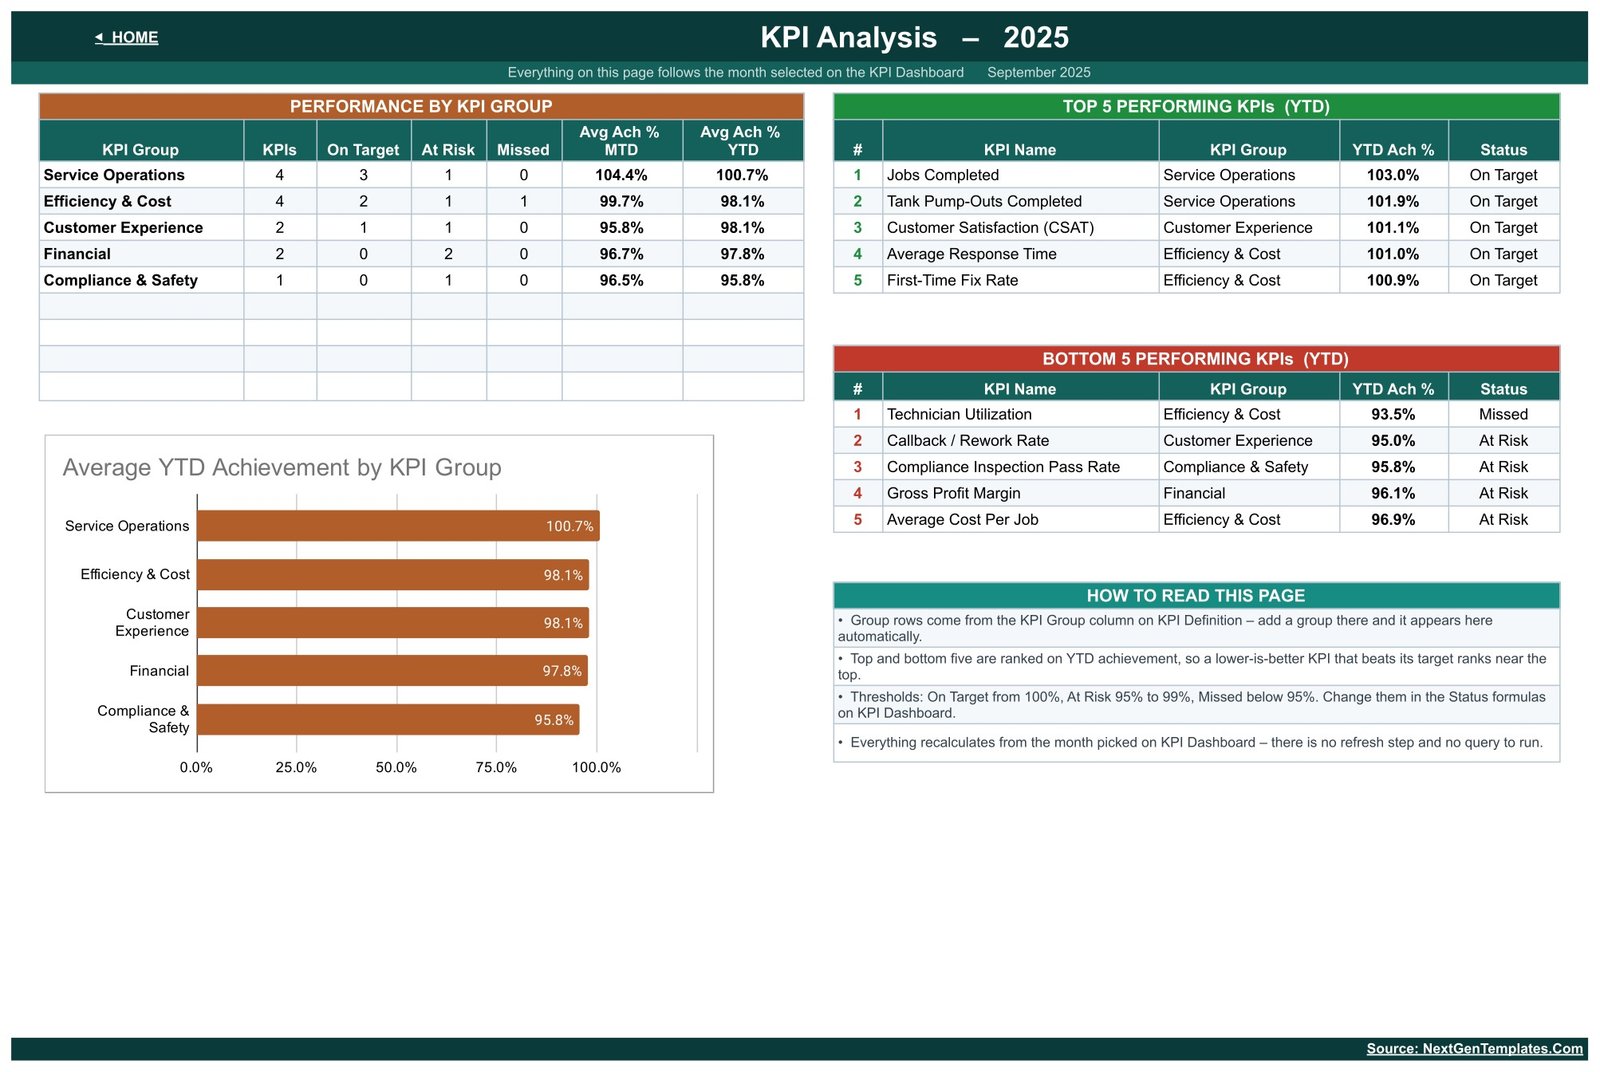
The analysis page groups all metrics and displays KPI counts, On Target/At Risk/Missed counts, and average MTD/YTD achievement. It also ranks the top and bottom five YTD performers. In the sample, Jobs Completed leads at 103.0%, while Technician Utilization is the only missed YTD KPI at 93.5%.
Input and definition sheets
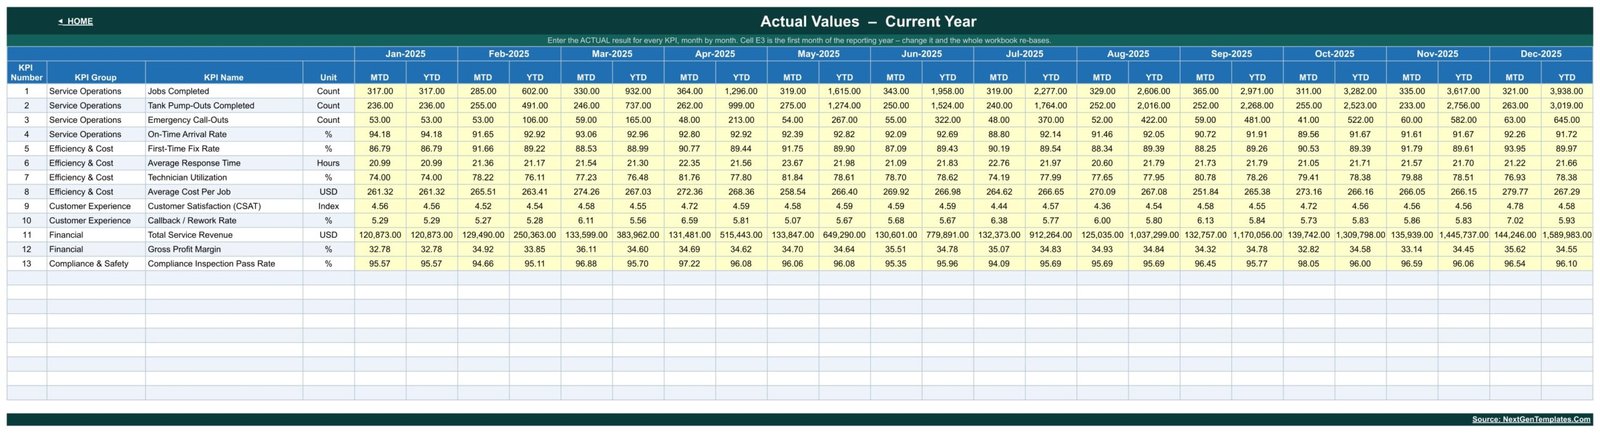
The Actual Values page stores MTD and calculated YTD values month by month. Matching Target and PY input sheets keep comparison data separate. The KPI Definition master list contains Jobs Completed, Tank Pump-Outs Completed, Emergency Call-Outs, On-Time Arrival Rate, First-Time Fix Rate, Average Response Time, Technician Utilization, Average Cost Per Job, Customer Satisfaction (CSAT), Callback / Rework Rate, Total Service Revenue, Gross Profit Margin, and Compliance Inspection Pass Rate.
Septic Tank Service KPI Dashboard in Google Sheets vs. Excel vs. Paid Field-Service SaaS – Feature Comparison
| Decision point | This Google Sheets dashboard | Excel alternative | Paid SaaS |
|---|---|---|---|
| Year-one cost | One-time 13.99, 8.99 on sale | Template plus any Excel license | Recurring plan, often per user or technician |
| Setup | Make a copy and replace monthly inputs | Download and edit locally | Implementation and migration |
| Collaboration | Real-time link sharing | Depends on cloud co-authoring | Account-based access |
| Mobile access | Google Sheets app/browser | Limited editing experience | Usually native app |
| Customization | Open cells and editable definitions | Open workbook | Vendor-controlled fields |
| Routing and dispatch | No | No | Often yes |
| Best fit | Monthly KPI review | Offline analysis | Live operational workflow |
If you need route optimization, job dispatch, customer records, invoicing, or automatic accounting feeds, choose operational software. If you need a shared monthly KPI review with transparent formulas and no subscription, this template is the leaner fit.
Who Should Use This Template
Use it if you manage a septic pumping or maintenance company and can summarize results monthly. Owner-operators can lead a compact performance meeting. Dispatch managers can watch call-outs, arrival rates, and response time. Service managers can compare first-time fix and rework. Finance staff can review cost per job, revenue, and margin. Compliance staff can include an inspection-pass summary without turning the dashboard into a regulatory system.
Do not use it as a permit register, disposal manifest, effluent log, inspection record, health-department filing, or environmental compliance system. The dashboard only reports management numbers you enter; it offers no legal, environmental, wastewater, or public-health guidance.
Real-World Use Cases
A Monday operations meeting
Ravi selects September and sees call-outs above target while on-time arrivals remain at risk. He opens the trend page before deciding whether the issue is one unusual month or a persistent pattern.
A service-quality review
Angela compares first-time fix, CSAT, and callback/rework together. A good satisfaction score does not hide a rising return-visit rate.
A margin conversation
Tom reviews revenue, gross margin, and cost per job beside technician utilization. The page does not replace the accounts; it gives managers the same summary for discussion.
Advantages of the Septic Tank Service KPI Dashboard in Google Sheets
The main advantage is clarity. Every figure has a target, prior-year comparator, achievement formula, status, and owner. Google Sheets supports simultaneous editing and granular sharing; see Google’s guide to sharing files from Google Drive. The template is also portable: your copy lives in your Drive, you can change the labels, and the formulas are visible. There is no locked vendor dashboard and no seat-based fee.
Opportunities for Improvement
The dashboard deliberately stays at company/month level. A future version could add branches, trucks, technicians, or service-area dimensions, but those would require more detailed inputs. It could also add imports from dispatch or accounting tools; this edition uses manual monthly entry. Alerts, email notifications, route maps, job-level drilldowns, and mobile forms are outside its scope. Those are worthwhile only when the source data and process are mature enough to support them.
Best Practices
- Agree each KPI’s formula and owner before entering data.
- Keep UTB/LTB direction accurate; an incorrect direction reverses the meaning of achievement.
- Freeze targets for the reporting period so results are not improved by moving the goalposts.
- Enter actual, target, and prior-year values at the same cadence.
- Use KPI Trend before reacting to one month’s red status.
- Keep operational and regulatory source records outside this summary sheet.
- Use view-only access for most readers and limit edit access to data owners.
Explore Relevant Templates
The Septic Tank Service KPI Scorecard in Google Sheets offers a smaller scorecard-style alternative. Related field-service templates include the Plumbing Business KPI Scorecard, HVAC Contractor KPI Scorecard, and Swimming Pool Service KPI Scorecard. Browse the full Google Sheets KPI Dashboard collection.
More on this blog: Septic Tank Service KPI Scorecard in Google Sheets, DevOps KPI Dashboard in Google Sheets and Railway KPI Dashboard in Google Sheets.
Want to build skills like this step by step? The Excel Pivot Tables & Dashboards course on NextGenTemplates Academy covers KPI reporting and dashboards with practice files.
Frequently Asked Questions
Is this a KPI dashboard or a KPI scorecard?
It is the KPI Dashboard line: it includes the main scorecard plus KPI Trend and KPI Analysis pages, separate input sheets, and a definition master.
How many KPIs are included?
Thirteen, covering service operations, efficiency and cost, customer experience, finance, and compliance and safety.
Can I replace the KPI names?
Yes. Edit the KPI Definition sheet and keep the expected row structure. Review unit, formula, owner, priority, frequency, and UTB/LTB type at the same time.
Does it connect to dispatch or accounting software?
No. You enter monthly summarized values manually.
Can my team collaborate?
Yes. Share your private copy using normal Google Sheets view, comment, or edit permissions.
Is it a compliance record?
No. Inspection Pass Rate is a management KPI only. Retain all permits, manifests, inspection documents, and other required records separately.
What is delivered?
A PDF containing the link to create your own editable Google Sheets copy.
About the Author
Built by PK – Microsoft Certified Professional with 15+ years of Excel, Google Sheets, and Power BI experience. Founder of NextGenTemplates, reaching 300K+ subscribers across YouTube channels. Every template is hand-built and tested before release.
Conclusion
The Septic Tank Service KPI Dashboard in Google Sheets is for teams that want a disciplined monthly review without buying another operational platform. Its 13-metric framework makes targets, prior-year comparisons, status bands, trends, and group priorities visible while keeping every definition editable. Get the dashboard from NextGenTemplates, make your own copy, and replace the sample figures with your operation’s monthly results. For more Google Sheets tutorials, visit NeoTechNavigators on YouTube.