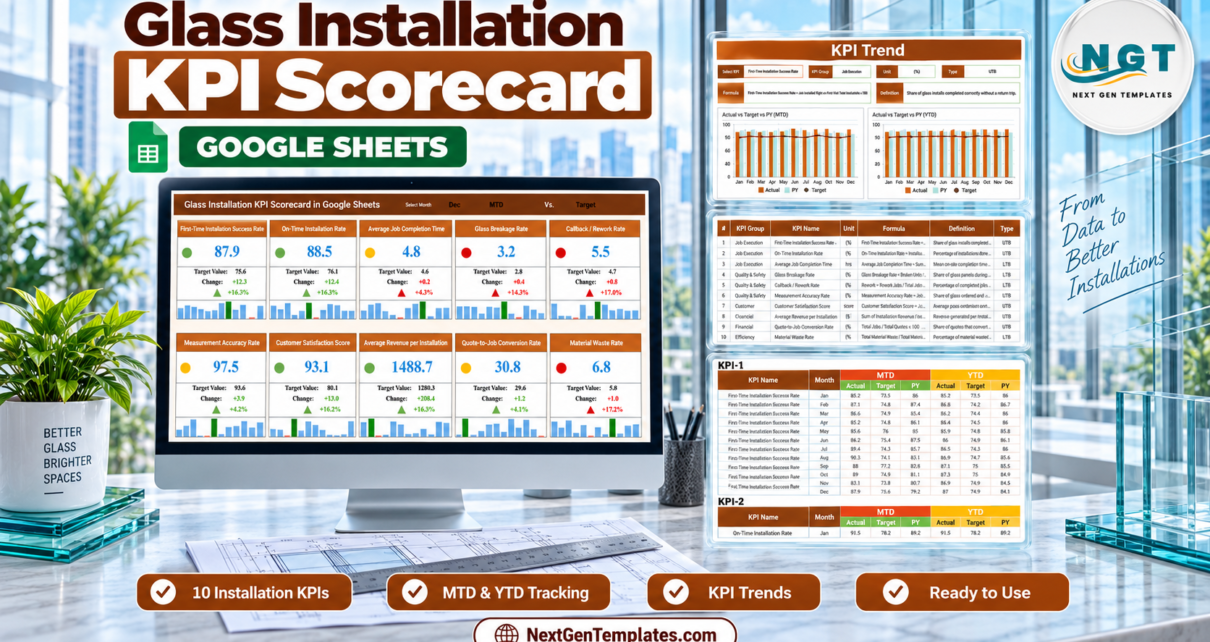
The Glass Installation KPI Scorecard in Google Sheets brings ten monthly measures into a single two-row board. In its December MTD sample, four cards are green, three amber, and three red. That makes the purpose immediately clear: celebrate strong installation success, timing, satisfaction, and revenue while keeping completion time, breakage, rework, conversion, measurement accuracy, and waste visible. The figures are demonstration data, not industry benchmarks or promises. Replace them with your own monthly results and use the status dots, change figures, arrows, and mini trends to guide a focused performance conversation.
Get the Glass Installation KPI Scorecard in Google Sheets
Key Features of the Glass Installation KPI Scorecard in Google Sheets
- Ten installation KPIs across five groups: Job Execution, Quality & Safety, Customer, Financial, and Efficiency.
- Month, basis, and comparison controls let you review any month on MTD or YTD against Target or Prior Year.
- Red, amber, and green cards help managers prioritize the exceptions.
- UTB/LTB direction handles metrics where lower time, breakage, rework, and waste are better.
- Two change views show the gap as both a value and a percentage with a directional arrow.
- One-year mini charts add trend context to every scorecard card.
- Dedicated trend analysis compares Actual, Target, and PY for MTD and YTD.
- Open definitions and inputs make the calculation meaning visible to the team.
Scorecard Pages Explanation
Scorecard
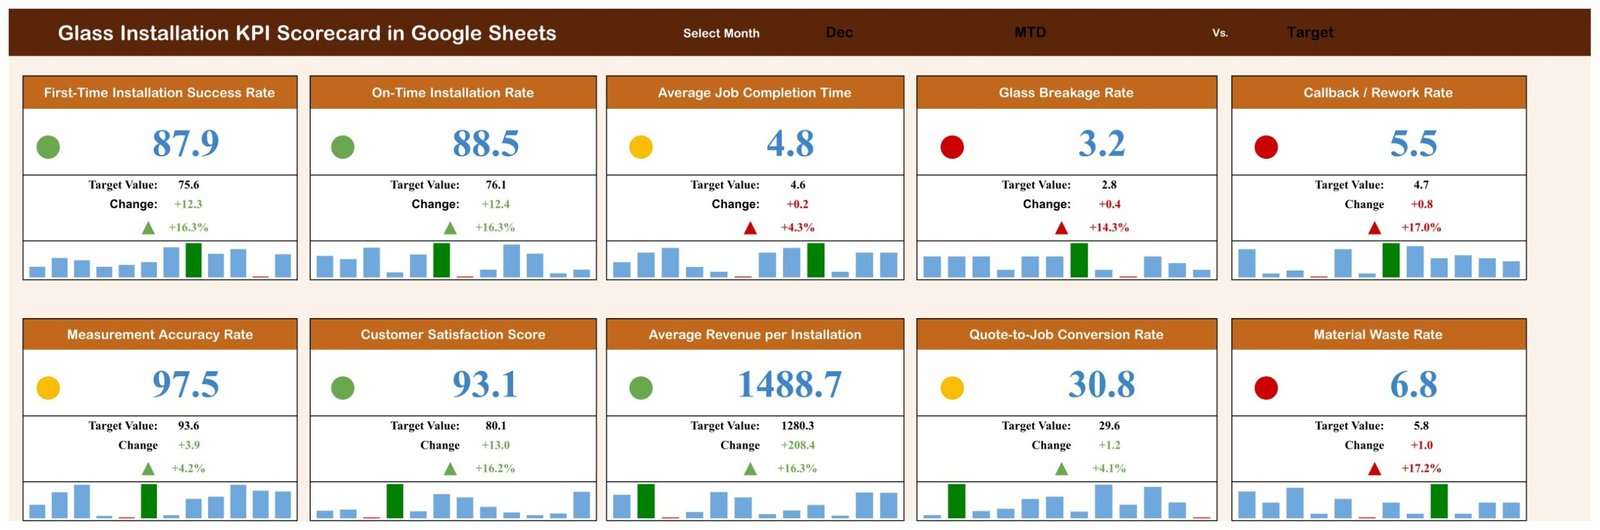
The main page displays ten cards in two rows of five. December, MTD, and Target are selected in the screenshot. First-Time Installation Success Rate is 87.9 against 75.6; On-Time Installation Rate is 88.5 against 76.1. Both are green. Average Job Completion Time is 4.8 hours against 4.6 and appears amber because it is an LTB metric. Glass Breakage Rate at 3.2 against 2.8 and Callback / Rework Rate at 5.5 against 4.7 are red.
The second row covers Measurement Accuracy Rate, Customer Satisfaction Score, Average Revenue per Installation, Quote-to-Job Conversion Rate, and Material Waste Rate. Each card combines the selected result, comparison value, change, percentage, arrow, and a twelve-month bar strip.
KPI Trend
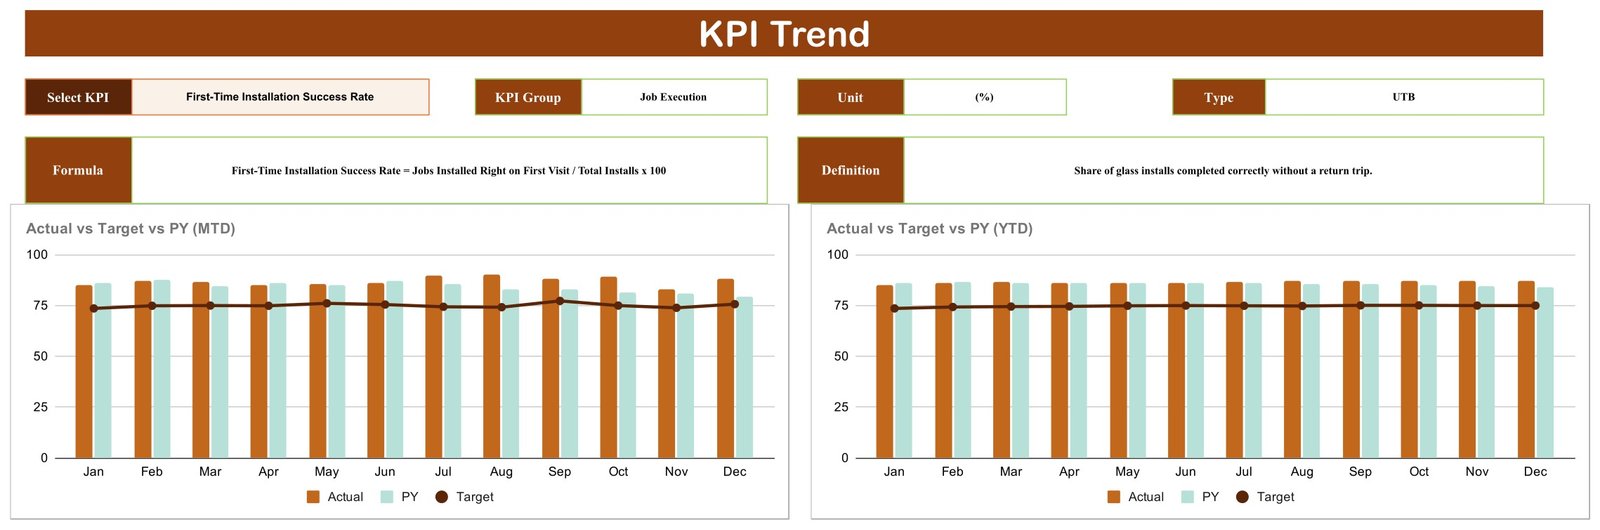
Select a KPI to reveal its group, unit, type, formula, and definition. For First-Time Installation Success Rate, the formula is jobs installed right on the first visit divided by total installs, multiplied by 100. Two charts then compare Actual, PY, and Target for all twelve months on MTD and YTD bases.
KPI Definition
The master table lists ten KPIs with group, unit, formula, definition, and direction. The exact set is First-Time Installation Success Rate, On-Time Installation Rate, Average Job Completion Time, Glass Breakage Rate, Callback / Rework Rate, Measurement Accuracy Rate, Customer Satisfaction Score, Average Revenue per Installation, Quote-to-Job Conversion Rate, and Material Waste Rate.

Input Data
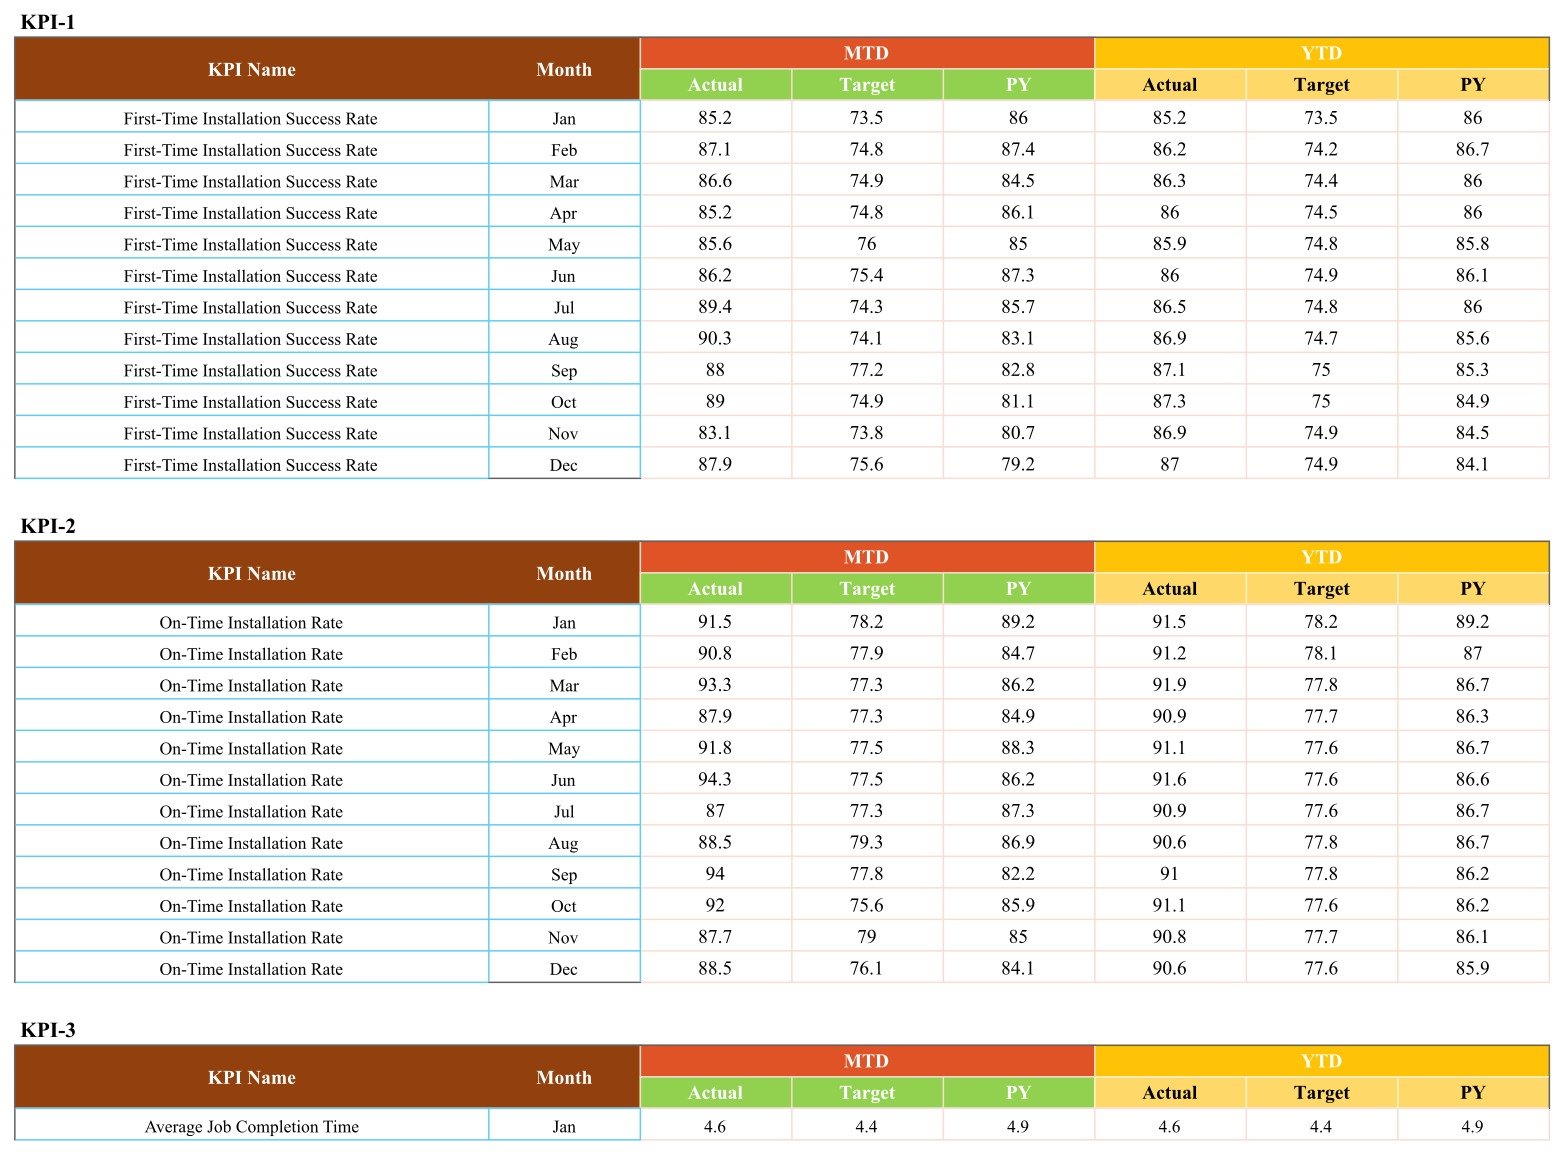
Input Data is organized as one twelve-month block per KPI. Every row has MTD Actual, Target, and PY plus YTD Actual, Target, and PY. That layout supports the three selectors without hiding where a number came from.
Glass Installation KPI Scorecard in Google Sheets vs. Excel vs. Paid Field-Service SaaS – Feature Comparison
| Decision point | This Google Sheets scorecard | Excel alternative | Paid SaaS |
|---|---|---|---|
| Year-one cost | One-time 13.99, 8.99 on sale | Template plus Excel license | Recurring subscription |
| Access | Browser and Google Sheets app | Desktop-first | Vendor app/login |
| Setup time | Make a copy and enter summaries | Download and edit | Implementation and migration |
| Collaboration | Real-time link sharing | Cloud setup required | Paid account access |
| Custom fields | Open definitions and cells | Open workbook | Plan-dependent |
| Quotes, jobs, scheduling | No | No | Often yes |
| Best use | Monthly KPI review | Offline reporting | Live operational workflow |
Choose field-service software when you need live quoting, scheduling, dispatch, invoicing, project documents, or customer records. Choose this scorecard when those systems already exist and the missing piece is a simple, shared monthly performance view.
Who Should Use This Template
Glazing contractors, commercial glass installers, storefront teams, residential replacement businesses, project managers, quality leaders, estimators, and owners can use it. It suits teams able to summarize performance monthly and agree on definitions. It does not replace an ERP, CRM, safety system, estimating platform, drawing register, inspection record, or accounting ledger.
The scorecard is especially useful when different managers currently bring different spreadsheets to the same review. A project manager may focus on completion time and on-time installation, a quality lead on measurement accuracy and breakage, and an owner on revenue and conversion. Bringing those ten agreed measures into one structure does not eliminate the source systems; it gives the meeting a common starting point. Small teams can begin with the supplied definitions, while larger contractors can rename the KPIs to match their own operating language.
Real-World Use Cases
Field execution review
Meera reviews first-time success, on-time installation, and job completion time together before adding labor or changing schedules.
Quality and waste review
Owen watches measurement accuracy, glass breakage, callbacks, and material waste to distinguish ordering issues from handling or installation issues.
Commercial performance review
Fatima compares customer satisfaction, average revenue, and quote-to-job conversion while leaving the supporting invoices and estimates in their source systems.
Advantages of the Glass Installation KPI Scorecard in Google Sheets
The main advantage is transparent, low-friction review. Formula text sits beside each definition. Direction is explicit. The same KPI can be viewed MTD or YTD against target or prior year. Google Sheets also supports simultaneous editing and controlled sharing; Google’s Drive sharing guide explains view, comment, and edit permissions. For more practical spreadsheet guidance, browse Google Sheets articles on NeoTechNavigators.
Opportunities for Improvement
This edition uses company-level monthly summaries. A future version could add branch, crew, installer, project type, glass type, or customer segment dimensions, but each adds data-entry demands. Imports from estimating, accounting, or job-management platforms could remove manual entry. Alerts, incident workflows, scheduling, project documentation, and mobile field forms would require a separate operational system.
The ten-card limit is also deliberate. It keeps the page readable, but a business with distinct residential, commercial, automotive, or facade divisions may need separate scorecards or a more detailed dashboard. Likewise, the mini bars show direction over time but do not explain why a figure changed. Pair the scorecard with a short written action log: owner, suspected cause, next step, and review date. That turns a red dot into a managed follow-up instead of a recurring talking point.
Best Practices
- Agree the formula, unit, owner, and direction for every KPI.
- Use one reporting cut-off so monthly numbers are comparable.
- Set targets before reviewing actuals.
- Enter Actual, Target, and PY on the same cadence.
- Check KPI Trend before reacting to one red month.
- Limit edit access to data owners.
- Keep detailed project, safety, and financial records in their required systems.
For percentages, document the numerator and denominator rather than relying on the KPI name alone. For example, First-Time Installation Success Rate uses jobs installed correctly on the first visit divided by total installs, while Measurement Accuracy Rate uses panes cut to the correct size on the first try divided by total panes cut. Keeping those definitions stable is what makes month-to-month and prior-year comparisons meaningful.
Explore Relevant Templates
Related options include the Flooring Installation KPI Scorecard, Fencing Contractor KPI Scorecard, Masonry Contractor KPI Scorecard, and Roofing Contractor KPI Scorecard. You can also browse the Google Sheets KPI collection.
To go further with reporting like this, the Excel Pivot Tables & Dashboards course on NextGenTemplates Academy teaches the skills behind it, with practice files included.
Get the Glass Installation KPI Scorecard in Google Sheets
Frequently Asked Questions
How many KPIs are included?
Ten, covering execution, quality and safety, customer, financial, and efficiency measures.
Can I switch between MTD and YTD?
Yes. The scorecard has a basis selector and the input table holds both MTD and YTD values.
Can I compare with prior year?
Yes. Switch the comparison selector from Target to PY.
Can I rename a KPI?
Yes. Update the definition and associated input label while keeping the expected structure.
Does it connect to job software?
No. Enter summarized monthly figures manually.
Is this a safety or inspection record?
No. It is a management scorecard. Keep required incident, inspection, certification, and project records separately.
What is delivered?
A PDF with the link for making your own editable Google Sheets copy.
About the Author
Built by PK – Microsoft Certified Professional with 15+ years of Excel, Google Sheets, and Power BI experience. Founder of NextGenTemplates, reaching 300K+ subscribers across YouTube channels. Every template is hand-built and tested before release.
Conclusion
The Glass Installation KPI Scorecard in Google Sheets gives installation businesses a disciplined monthly review without another subscription. Its ten cards connect targets, prior-year comparisons, status, direction, and trends while keeping the source definitions visible. Get the Glass Installation KPI Scorecard, create your private copy, and replace the sample values with your own results. For Google Sheets tutorials, visit NeoTechNavigators on YouTube.