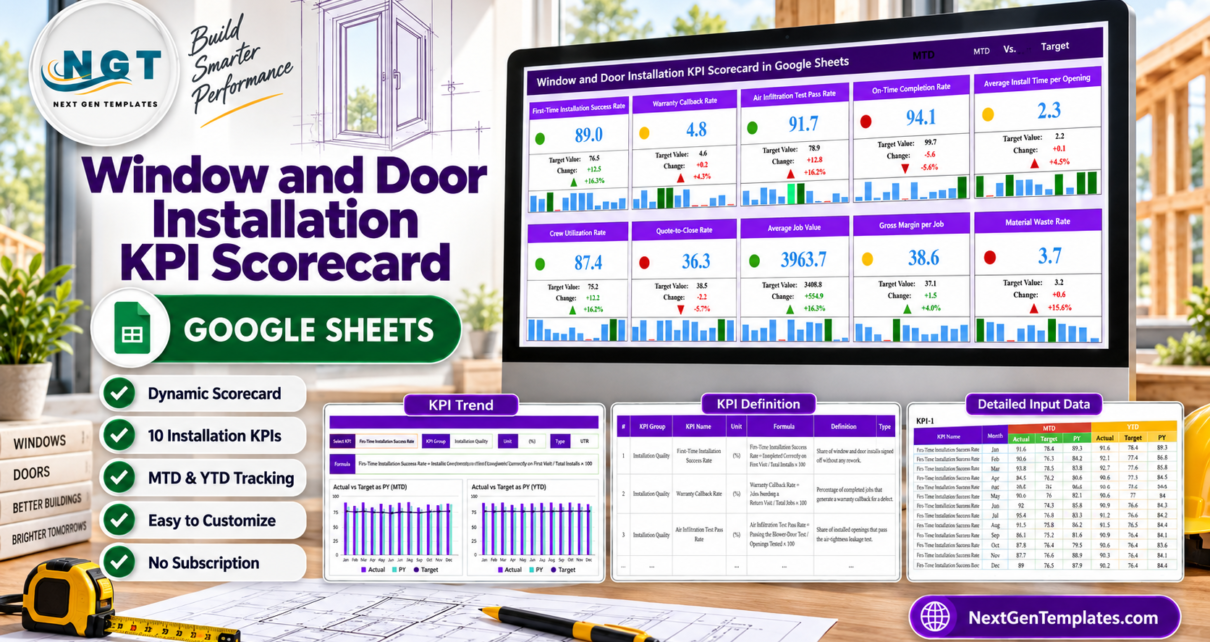
A window and door installation business can finish a full schedule and still lose ground through callbacks, slow openings, weak quote conversion, or wasted material. The Window and Door Installation KPI Scorecard in Google Sheets fixes the monthly review around 10 KPIs, 4 groups, 12 months, and 720 MTD/YTD entries. Each card compares Actual with Target or Prior Year, displays absolute and percentage change, and uses a traffic light that understands whether higher or lower is better.Window and Door Installation KPI Scorecard
Get the Window and Door Installation KPI Scorecard in Google Sheets
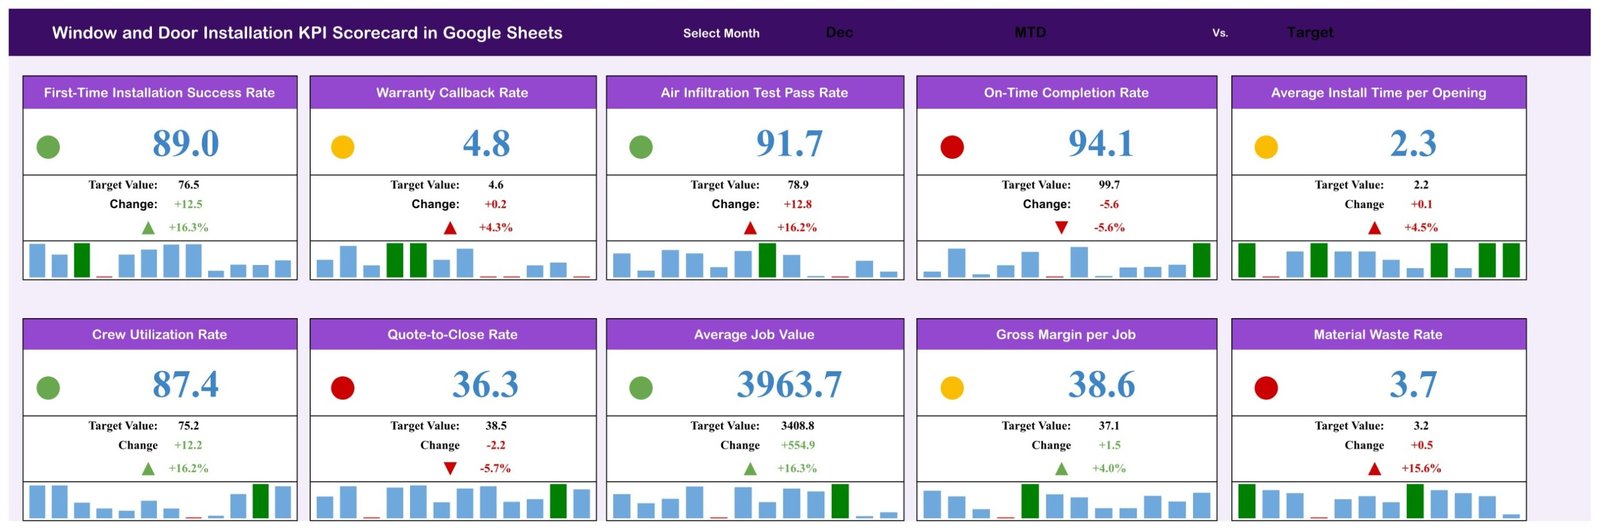
The displayed December sample includes green, amber, and red cards so the logic can be inspected before you replace the data. These figures are demonstration data, not installation-industry benchmarks. This is also the KPI Scorecard family, not the separate KPI Dashboard or analytical Dashboard families.Window and Door Installation KPI Scorecard
Key Features of Window and Door Installation KPI Scorecard in Google Sheets
Ten KPIs across four operating groups
Installation Quality contains First-Time Installation Success Rate, Warranty Callback Rate, and Air Infiltration Test Pass Rate. Scheduling & Efficiency contains On-Time Completion Rate, Average Install Time per Opening, and Crew Utilization Rate. Sales & Estimating covers Quote-to-Close Rate and Average Job Value. Financial covers Gross Margin per Job and Material Waste Rate.Window and Door Installation KPI Scorecard
Three controls change the whole scorecard
Select the month, choose MTD or YTD, and switch the comparison between Target and PY. Every card then recalculates its current value, comparison, change, change percentage, arrow, colour, and status.Window and Door Installation KPI Scorecard
Upper-is-better and lower-is-better logic
Warranty Callback Rate, Average Install Time per Opening, and Material Waste Rate are LTB metrics. The other seven are UTB. This distinction matters: a callback rate beating its target by being lower should not be scored the same way as a success rate that needs to rise.Window and Door Installation KPI Scorecard
Scorecard Pages Explanation
1. Main Scorecard
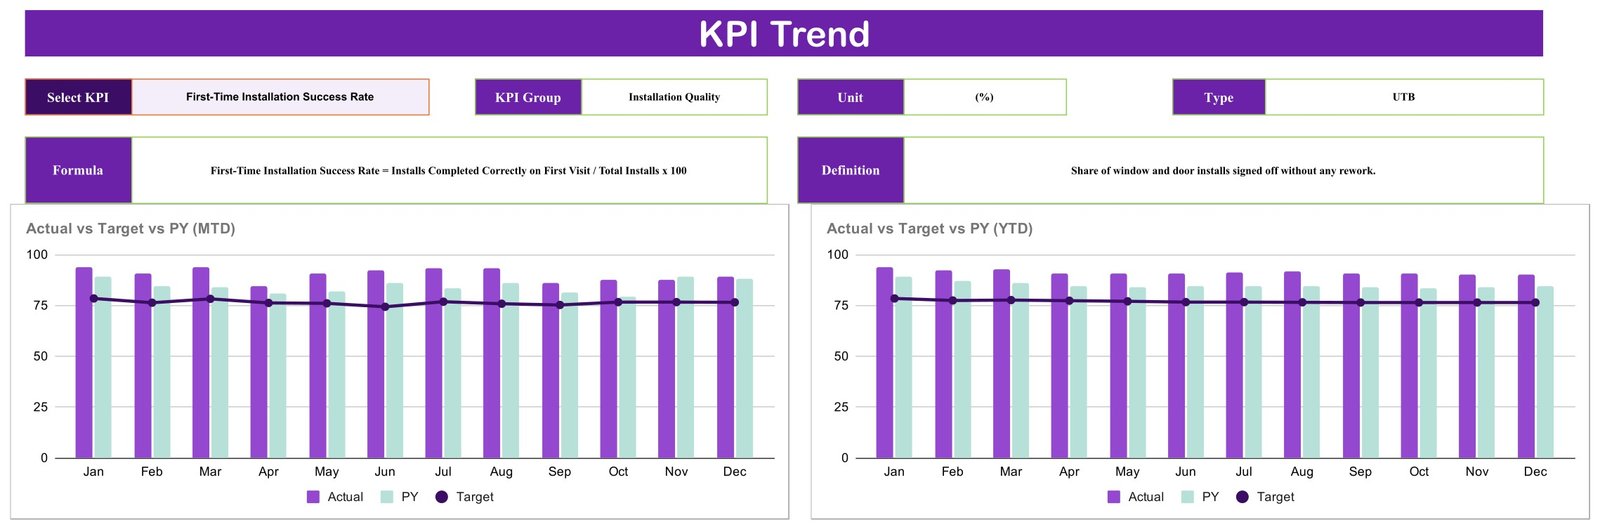
Ten cards are arranged in two rows of five. Each contains a KPI name, traffic-light dot, current value, comparison value, absolute and percentage change, direction arrow, and a twelve-month mini bar strip. In the sample December MTD vs Target view, First-Time Installation Success Rate reads 89.0 against 76.5, while On-Time Completion Rate reads 94.1 against 99.7. The first is ahead of target; the second is behind.
2. KPI Trend
Select one KPI to display its group, unit, UTB/LTB direction, formula, and definition. Two charts show Actual, Target, and PY by month: one for MTD and one for YTD. This is where a manager can distinguish a single red card from a continuing trend.Window and Door Installation KPI Scorecard
3. KPI Definition
The register lists all ten KPI names, groups, units, written formulas, definitions, and directions. For example, First-Time Installation Success Rate is defined as installs completed correctly on the first visit divided by total installs; Material Waste Rate is wasted or reordered material divided by total material cost.Window and Door Installation KPI Scorecard

4. Detailed Input Data
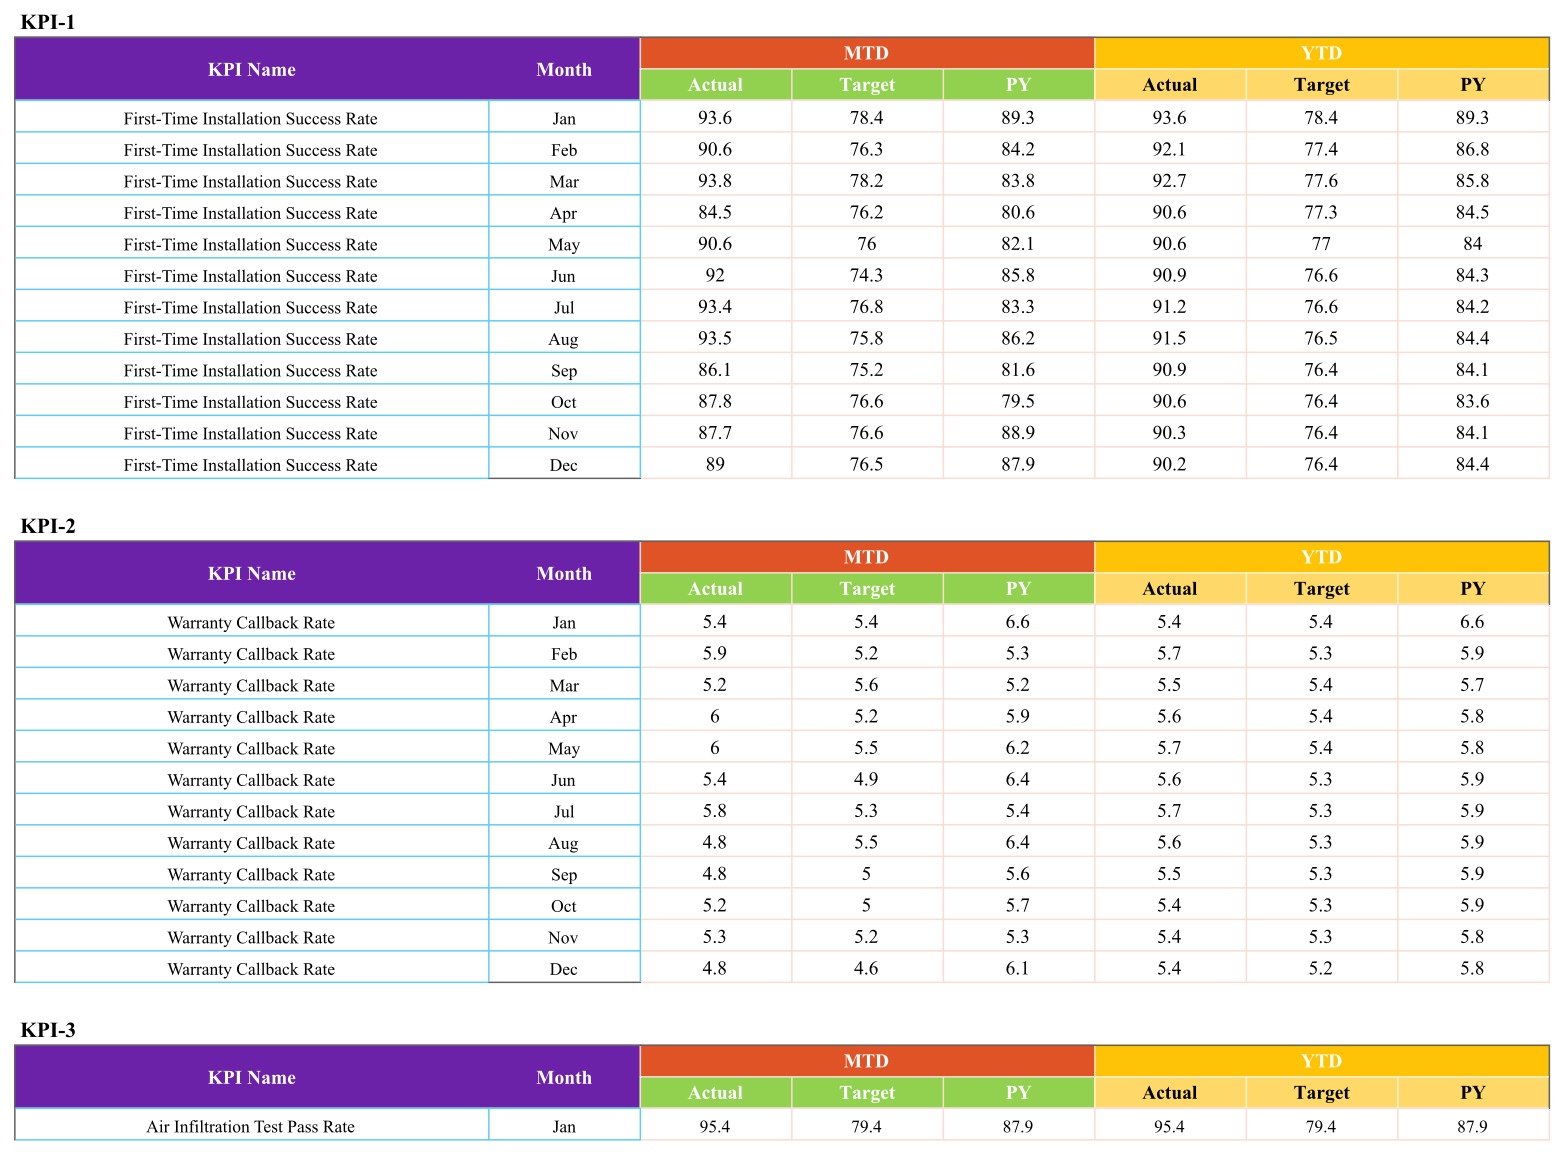
Each KPI receives twelve monthly rows. Six fields sit beside every month: MTD Actual, Target, and PY, followed by YTD Actual, Target, and PY. That is 10 x 12 x 6, or 720 editable numeric cells. YTD is supplied separately rather than being generated from MTD, so it can match the exact cumulative logic in your source report.Window and Door Installation KPI Scorecard
Window and Door Installation KPI Scorecard in Google Sheets vs. Excel vs. Paid Field Service SaaS – Feature Comparison
| Area | This scorecard | Excel alternative | Paid field service SaaS |
|---|---|---|---|
| Cost | $8.99 one time | File plus Microsoft 365 if needed | Recurring, often per user |
| Platform | Google Sheets | Excel desktop/web | Vendor web/mobile app |
| Collaboration | Native link sharing | OneDrive co-authoring | Native, seat-based |
| Setup | Define KPIs and paste monthly summaries | Download and configure | Onboarding and integration |
| Five-user year-one cost | $8.99 total | Template plus licences | Hundreds to thousands |
| Custom KPI definitions | Visible editable cells | Editable workbook | Vendor-dependent |
| Quotes, jobs, invoices | Not included | Not included | Usually included |
| Test certificates and code checks | Not included | Depends on tool | Vendor-dependent |
Who Should Use This Template
It fits owner-operators, project managers, installation supervisors, estimators, and finance leads who can produce monthly summary results and need a fixed scorecard for the review meeting. It also suits a fractional operations manager who wants one repeatable structure across several contractor clients.
It does not fit a business looking for job scheduling, crew dispatch, quoting, takeoffs, inventory, invoices, CRM, warranty cases, test records, or code-compliance documentation. Those are operational workflows, while this file is a monthly measurement layer.
Real-World Use Cases
Alicia manages three installation crews. She reads first-time success beside callback rate and air-test pass rate before deciding whether a crew needs training or a product line needs investigation.
Dev runs estimating. Quote-to-Close Rate is red while Average Job Value is green. Instead of celebrating the larger jobs alone, he reviews which proposal types are not converting.
Ben owns the company. Gross Margin per Job is amber and Material Waste Rate is red. He opens the monthly trend before changing supplier, price, or cut-list procedure.
Advantages of Window and Door Installation KPI Scorecard in Google Sheets
- One-page monthly review: ten cards create a fixed agenda.
- Visible definitions: a new manager can see how each KPI is intended to be calculated.
- Two comparisons: Target and prior year answer different questions without duplicating the file.
- Direction-aware signals: time, waste, and callbacks are treated as lower-is-better.
- No lock-in: the copy stays in your Drive with no subscription.
- Easy sharing: give view or edit access with normal Google Sheets permissions.
Opportunities for Improvement
- Manual data entry: there is no connector to estimating, field-service, accounting, or test software.
- Monthly summary grain: no drill-down by project, opening, crew member, product, supplier, or customer.
- Separate YTD input: cumulative values are not calculated from MTD, so reconcile both sets to your source report.
- No workflow: a red Warranty Callback Rate card does not open a claim or assign a corrective action.
- No certification: Air Infiltration Test Pass Rate is a typed percentage, not a test record or code decision.
- Marketing artwork: the wide promotional image compresses the small month-selector label on its laptop mockup. The actual worksheet page and product square show the control correctly.
Best Practices
- Agree on definitions and data owners before entering the first month.
- Keep the KPI names identical between the definition register and input blocks.
- Set UTB or LTB correctly whenever a KPI is replaced.
- Archive the source report behind each monthly input.
- Reconcile YTD totals separately because they are entered separately.
- Use view-only sharing for readers and protect formula areas from accidental edits.
- For general Google Sheets collaboration controls, see Google’s official sharing guidance.
Explore Relevant Templates
- Flooring Installation KPI Scorecard walkthrough – another installation scorecard.
- Fencing Contractor KPI Scorecard walkthrough – a related contractor scorecard.
- Garage Door Service KPI Scorecard walkthrough – a field-service neighbour.
- Glass Installation KPI Scorecard in Google Sheets – a closely related product.
- Solar Panel Installation KPI Scorecard in Google Sheets – another installation operations template.
Curious how to build reports like this yourself? The Excel Pivot Tables & Dashboards course on NextGenTemplates Academy covers the method with practice files.
Get the Window and Door Installation KPI Scorecard in Google Sheets
Frequently Asked Questions
Is this a KPI Scorecard or a KPI Dashboard?
A KPI Scorecard with ten cards, a trend page, a definition register, and monthly data blocks. KPI Dashboards are a separate family.
Can I change the ten KPIs?
Yes. Names, groups, units, formulas, definitions, and UTB/LTB directions are editable. Update the matching input labels too.
Do I need Google Workspace?
No. A free Google account can copy, edit, and share it.Window and Door Installation KPI Scorecard
Does it calculate YTD from MTD?
No. Enter both MTD and YTD from your source report.Window and Door Installation KPI Scorecard
Does it perform air-infiltration testing or verify code compliance?
No. The test pass rate is a summary percentage you supply. The sheet includes no test method, technical standard, certificate, or approval.Window and Door Installation KPI Scorecard
Will it manage warranty callbacks?
No. It measures the callback rate but does not store claims, schedule visits, or notify a team.
How do I receive the file?
The download is a PDF containing the link used to make your own Google Sheets copy.Window and Door Installation KPI Scorecard
About the Author
Built by PK – Microsoft Certified Professional with 15+ years of Excel, Google Sheets, and Power BI experience. Founder of NextGenTemplates, reaching 300K+ subscribers across YouTube channels. Every template is hand-built and tested before release.Window and Door Installation KPI Scorecard
Conclusion
Ten agreed numbers can do more for a monthly meeting than another page of raw jobs. This scorecard makes quality, scheduling, estimating, and financial results visible together, then gives each red or amber card a twelve-month context. Replace the sample data, confirm the definitions, and keep the underlying evidence with your operational records.Window and Door Installation KPI Scorecard
Get the Window and Door Installation KPI Scorecard in Google Sheets for $8.99 – one-time payment, no subscription. For more walkthroughs, visit PK An Excel Expert on YouTube.Window and Door Installation KPI Scorecard