A garage door service business lives on four numbers most owners cannot state from memory: how often the van fixes it on the first visit, how long the customer waited, how many jobs came back inside thirty days, and what was left after direct costs. The Garage Door Service KPI Scorecard in Google Sheets puts those four beside six more on a single page, colours each one red, amber or green, and recalculates the lot when you change one dropdown. Ten KPIs, twelve months, six measures per month – 720 live figures, all driven from one flat 120-row table, with no scripts, no add-ons and no subscription.Garage Door Service KPI Scorecard in Google Sheets
Get the Garage Door Service KPI Scorecard
Before anything else, a word on naming, because NextGenTemplates publishes three families with confusingly similar titles. This is the KPI Scorecard: a fixed ten-card page that answers “are we on target this month”. A KPI Dashboard is a separate product with a different layout. A plain Dashboard is the analytical line – slicers, pivots, cross-filtering. They are companions rather than alternatives, and this guide is about the scorecard.
Key Features of the Garage Door Service KPI Scorecard
Three switches drive the whole page
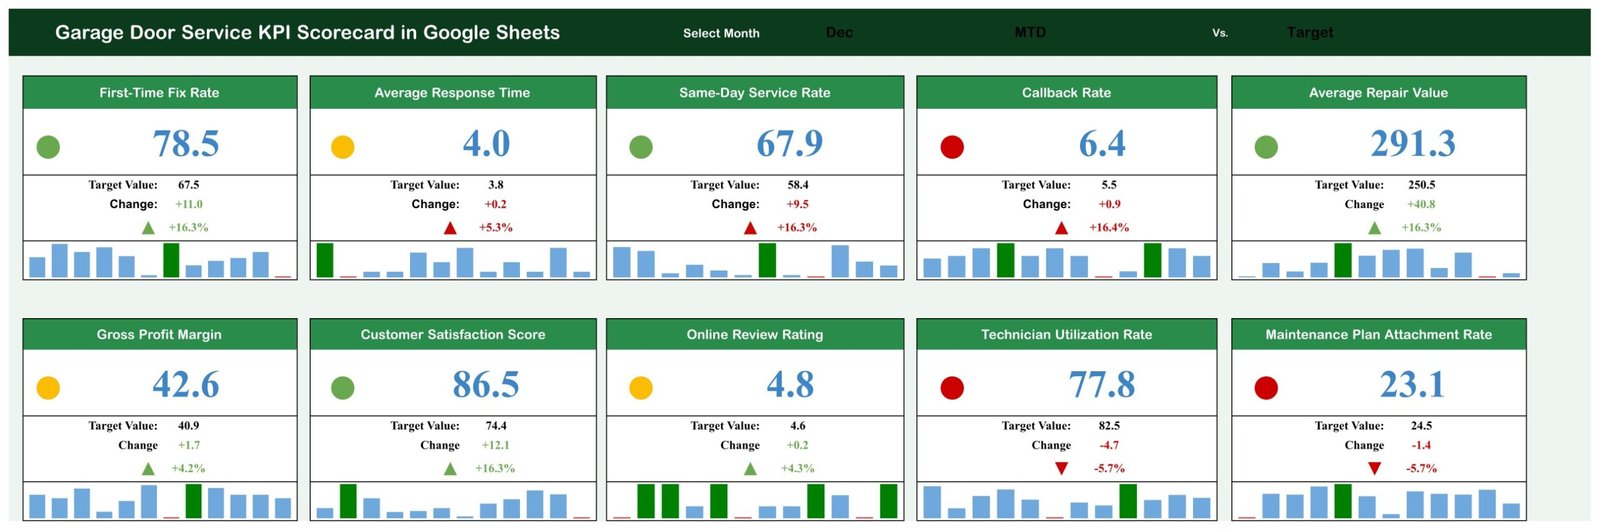
The Scorecard header carries Select Month, an MTD / YTD toggle and a Vs. Target / PY toggle. Nothing on the page is hard-coded to one view: every card reads the three switches through SUMIFS lookups against named ranges, so flipping from Target to PY re-benchmarks all ten KPIs at once.Garage Door Service KPI Scorecard in Google Sheets
Traffic lights that know which way is good
Each KPI carries a direction tag – UTB (upper the better) or LTB (lower the better). Average Response Time and Callback Rate are LTB, so they turn red when they climb. The other eight are UTB and turn red when they fall. The tag is a cell on the KPI Definition tab, so if you swap a KPI for one of your own you set its direction in the same place.Garage Door Service KPI Scorecard in Google Sheets
Published RAG bands
The bands are variance-based, not absolute: for an upper-the-better KPI, more than 10% above the comparison is green, within 10% above is amber, on or below is red. For a lower-the-better KPI the bands mirror. Both are written out in plain text on the Color Settings tab so you can see the rule rather than guess it, and the live thresholds sit on the Support tab where you can tighten them.Garage Door Service KPI Scorecard in Google Sheets
A twelve-month mini bar strip on every card
Under each card sits a small bar chart of all twelve months with the highest and the lowest month picked out in colour. It gives you the shape of the year at a glance without leaving the front page.Garage Door Service KPI Scorecard in Google Sheets
A real drill-down page
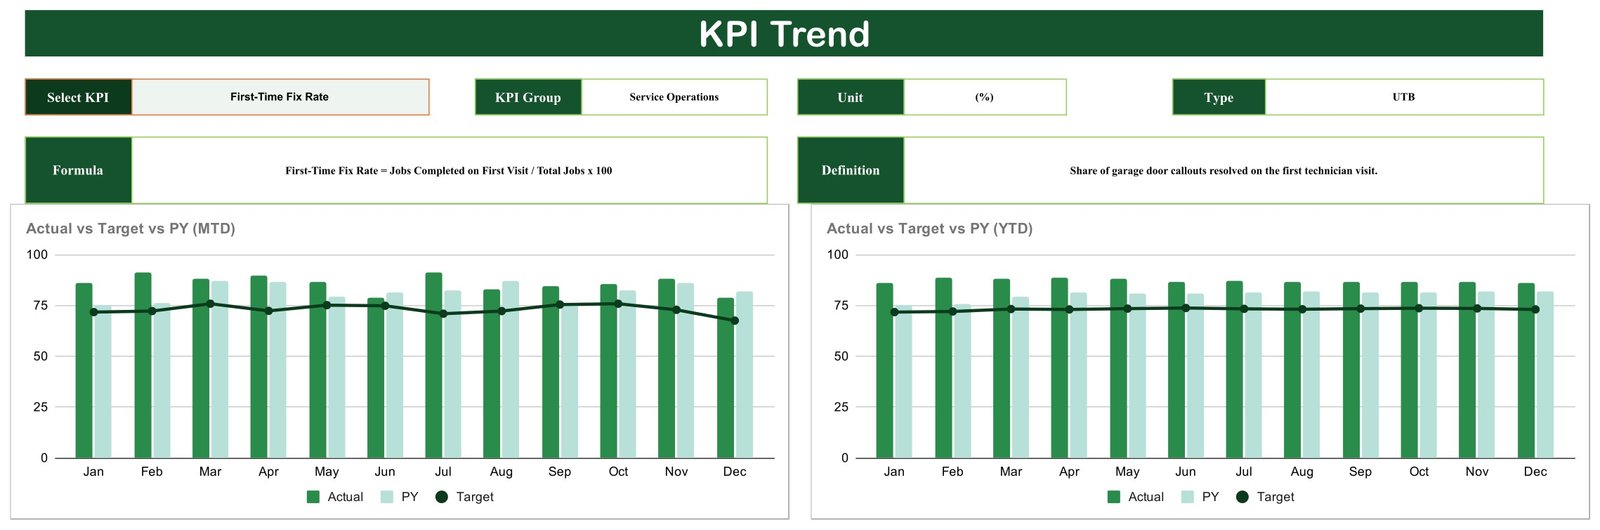
The KPI Trend tab has its own KPI picker. Choose a KPI and the group, unit, direction, calculation formula and one-line definition all fill themselves in from the register, then two combo charts draw the year: Actual vs Target vs PY by Month (MTD) and the same again for YTD, with Actual and PY as clustered columns and Target as a line.Garage Door Service KPI Scorecard in Google Sheets
Dashboard Pages Explanation
The file has eight tabs. Four you look at, four do the work.
1. Read Me
The first tab is left blank as a place for your own setup notes – who owns the monthly paste, where the source report comes from, which KPI definitions your business argued about.Garage Door Service KPI Scorecard in Google Sheets
2. Scorecard
The front page: ten cards in two rows of five. Each card shows the KPI name, a coloured status dot, the current value, the comparison value, the absolute change, the percentage change with a direction arrow, and the twelve-month mini bar strip. In the sample data, with December selected on MTD vs Target, First-Time Fix Rate reads 78.5 against a 67.5 target – a +11.0 gap, +16.3%, green – while Technician Utilization Rate reads 77.8 against 82.5, a -4.7 gap at -5.7%, red. Every one of those figures reconciles to the Input Data tab; nothing is typed in twice.Garage Door Service KPI Scorecard in Google Sheets
3. KPI Trend
One KPI at a time, across twelve months, in both MTD and YTD form. Useful for the conversation that starts “is this a bad month or a bad year”.Garage Door Service KPI Scorecard in Google Sheets
4. Input Data
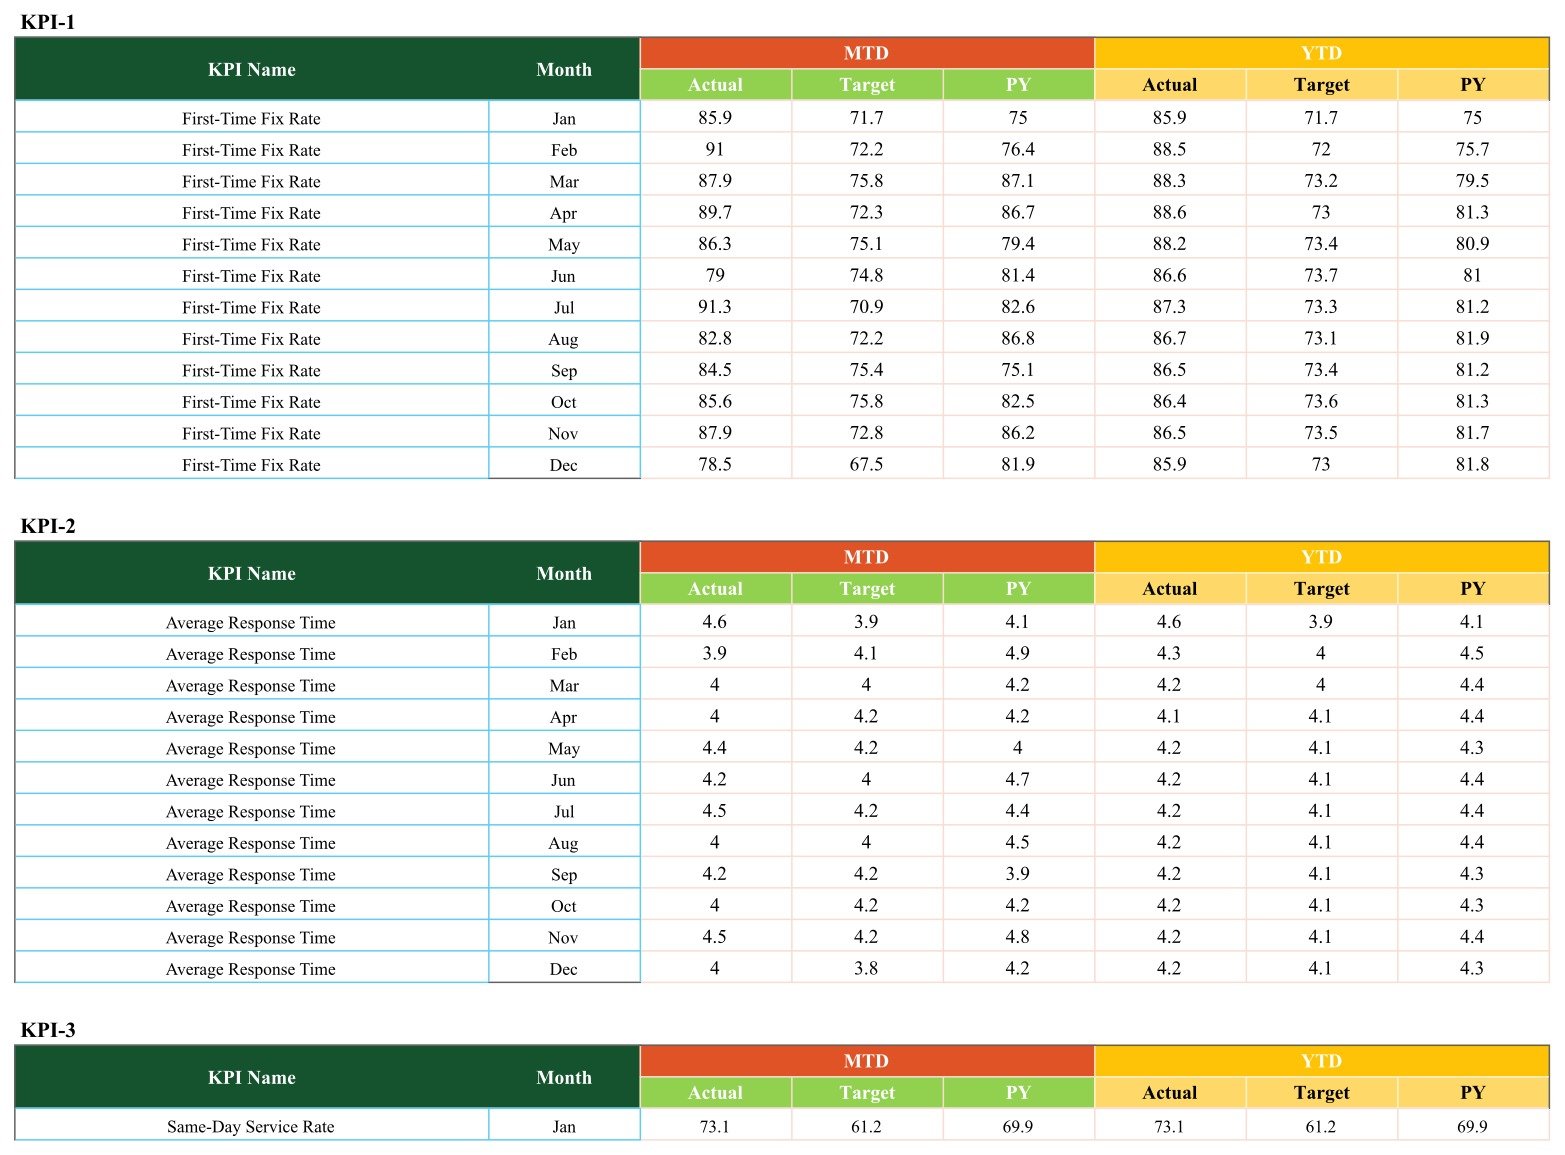
The only tab you type into. Ten blocks, one per KPI, twelve monthly rows each, and six numeric columns per row: MTD Actual, MTD Target, MTD PY, YTD Actual, YTD Target, YTD PY. That is the whole data model.
5. KPI Definition
The register: number, KPI group, KPI name, unit, calculation formula, plain-English definition and direction. As shipped it holds ten garage door KPIs across five groups – Service Operations (First-Time Fix Rate, Average Response Time, Same-Day Service Rate, Callback Rate), Financial (Average Repair Value, Gross Profit Margin), Customer Experience (Customer Satisfaction Score, Online Review Rating), Workforce (Technician Utilization Rate) and Growth (Maintenance Plan Attachment Rate).

6. Color Settings
A printed reference of the red / amber / green bands for both KPI directions.
7. Support
The engine. Card values, comparison values, change, change percentage, arrow glyph, arrow colour and traffic light colour are all resolved here from the three header switches, and the live RAG thresholds live on this tab too.
8. Trend_Support
The twelve-row Actual / Target / PY table, MTD and YTD side by side, that the two trend charts read.
Garage Door Service KPI Scorecard vs. Microsoft Excel vs. Paid Field Service Software – Feature Comparison
| This Google Sheets scorecard | An Excel KPI scorecard | Paid field service platforms | |
|---|---|---|---|
| Cost | $8.99 one time (regular $13.99) | One time, plus a Microsoft 365 licence | Recurring subscription, normally per technician per month |
| Platform | Google Sheets, any browser | Excel for Windows or Mac | Vendor web app plus a phone app |
| Setup time | Under an hour: copy, paste 120 rows, rename KPIs | Similar once downloaded | Days to weeks of onboarding and data import |
| Real-time team collaboration | Yes, native | Only via OneDrive co-authoring | Yes |
| Mobile access | Yes, Sheets mobile app | Limited | Yes, purpose-built |
| Customizable KPIs and fields | Fully – names, units, formulas and directions are cells | Fully | Usually limited to the vendor’s KPI set |
| Share with a link | Yes, no seat charge | Needs a file or OneDrive link | Extra seats normally chargeable |
| Year-1 cost at 5 users | $8.99 total | File price plus existing 365 seats | Hundreds to thousands of dollars, per seat per year |
| Direction-aware traffic lights | Yes, per KPI, editable | Yes, in the Excel edition | Usually fixed by the vendor |
| Dispatch, invoicing, scheduling | No – measurement only | No | Yes |
Who Should Use This Template
It fits an owner or service manager of a garage door installation and repair business with roughly two to twenty technicians, who already produces monthly job and revenue figures and wants one page to review them on. It also fits a bookkeeper or fractional operations manager running several trade clients, because the KPI register is data rather than code – one copy per client, different KPIs in each.
It does not fit a shop that needs live dispatching, GPS, invoicing or a customer portal; that is what a field service platform is for. It also does not fit anyone needing per-job or daily grain, because the grain here is one row per KPI per month, nor anyone who wants to slice by branch, technician or door type – that is the analytical dashboard line.
Real-World Use Cases
The first-Monday review. An owner with six vans pastes last month’s numbers into Input Data, sets the month, leaves the toggles on MTD and Target, and screenshots the Scorecard into the team chat. The reds pick the agenda.
Settling an argument about callbacks. A service manager who thinks callbacks are up flips the comparison from Target to PY, sees whether the year is genuinely worse than last, then opens KPI Trend on Callback Rate and reads the twelve months before naming anyone.
Selling the maintenance plan. Maintenance Plan Attachment Rate is a Growth KPI in the register precisely because it is the number that moves a garage door business from break-fix to recurring revenue. Watching it on the same page as Gross Profit Margin makes the trade-off visible.
Advantages of the Garage Door Service KPI Scorecard
- Nothing is hidden. The formulas, the RAG bands and the KPI definitions are all on visible tabs. You can audit the file in ten minutes.
- One data table. There is exactly one place to type, which is the single biggest reason spreadsheet scorecards survive past month three.
- No lock-in. No Apps Script, no add-ons, no connectors, no vendor account. A free Google account is enough.
- Costs nothing per user. Share it with the whole shop for the same $8.99.
- Both benchmarks in one file. Target and prior year, MTD and YTD, without duplicating the sheet.
Opportunities for Improvement
Honest limitations, so you can judge before you buy:
- Data entry is manual. There is no connector to an invoicing or dispatch system. Budget fifteen to twenty minutes a month.
- One year at a time. The model holds twelve months. A second year means a second copy or an extended Input Data block plus a wider Support table.
- The mini bar strip is a magnitude view, not a performance view. It highlights the highest and lowest month of the twelve. On the two lower-is-better KPIs – Average Response Time and Callback Rate – the highlighted high month is therefore your weakest month, not your best. Read the strip as size, and read the traffic light for good or bad.
- Month labels must match exactly. The Input Data month column and the Scorecard month picker are matched as text. If you retype a month in a different form the cards will come back blank, so keep the three-letter form the sample uses.
- Color Settings is a reference, not a control. The bands you edit to change behaviour are on the Support tab; Color Settings documents them.
- No per-technician or per-branch breakdown. The scorecard is company-level by design.
Best Practices
- Fix the KPI register before you paste anything. Change names, units, formulas and directions on the KPI Definition tab first, then mirror the KPI names into Input Data so the lookups still match.
- Write the definition down and stop arguing. The Definition column exists so that “first-time fix” means the same thing in March as in September.
- Set targets you will not move. A scorecard whose targets follow the actuals is decoration.
- Keep two lower-is-better KPIs. Response time and callback rate stop the page becoming a wall of growth metrics.
- Tighten the RAG band once you trust the data. Ten percent is generous for a mature shop; five is a sharper signal.
- Review MTD in the meeting, YTD before you spend. They answer different questions.
- Keep the raw export. The sheet holds summary figures only, so archive the report you typed them from.
If you are new to how Google Sheets resolves this kind of criteria-based lookup, Google’s own SUMIFS documentation explains the function the whole file is built on.
Explore Relevant Templates
- Locksmith Business KPI Scorecard in Google Sheets – the same eight-tab build with a locksmith register.
- Septic Tank Service KPI Scorecard in Google Sheets – route-based service trade.
- Swimming Pool Service KPI Scorecard in Google Sheets – seasonal service business.
- Electrical Contractor KPI Scorecard in Google Sheets – mixed trade shop.
- Plumbing Business KPI Dashboard in Google Sheets – the KPI Dashboard line, for comparison.
- Auto Garage Job Card Management System Web App – for running jobs rather than measuring them.
If you would like to build scorecards like this one yourself, the Excel Pivot Tables & Dashboards course on NextGenTemplates Academy walks through the reporting techniques with practice files.
Get the Garage Door Service KPI Scorecard
Frequently Asked Questions
Is this a KPI Scorecard or a KPI Dashboard?
A KPI Scorecard. Ten fixed cards, one traffic light each, one month at a time. The KPI Dashboard line is a separate product with a different layout, and the analytical Dashboard line is different again. Owners often keep a scorecard for the monthly meeting and a dashboard for the deep dive.
Do I need a paid Google account?
No. A free personal Google account is enough to copy, edit and share the file. There is no Apps Script and no add-on.
Can I use my own KPIs instead of the ten supplied?
Yes. Edit the KPI Definition tab – name, unit, formula text, definition and UTB / LTB direction are ordinary cells – then update the matching KPI name in the Input Data blocks. The Scorecard and KPI Trend pages follow automatically.
How do the red, amber and green bands work?
They read percentage variance against whichever comparison you picked. Upper-the-better: over 10% ahead is green, within 10% ahead is amber, level or behind is red. Lower-the-better mirrors it. Both are documented on Color Settings and adjustable on Support.
What is the difference between MTD and YTD here?
They are separate columns in your data, not a calculation the sheet performs. You supply both, and the toggle chooses which set every card reads.
Can several people use it at once?
Yes. It is a normal Google Sheet, so as many viewers and editors as you like, on desktop or mobile, at no extra cost.Garage Door Service KPI Scorecard in Google Sheets
How long does the monthly update take?
Once your source report is stable, most owners report fifteen to twenty minutes: one paste into Input Data, then set the month.Garage Door Service KPI Scorecard in Google Sheets
About the Author
Built by PK – Microsoft Certified Professional with 15+ years of Excel, Google Sheets, and Power BI experience. Founder of NextGenTemplates, reaching 300K+ subscribers across YouTube channels. Every template is hand-built and tested before release.Garage Door Service KPI Scorecard in Google Sheets
Conclusion
Most garage door businesses are measured by whatever number was easiest to pull that week. A scorecard fixes the set, fixes the definitions, fixes the targets, and then puts a colour against each one so that the monthly review takes ten minutes instead of an hour of arguing about what counts. The Garage Door Service KPI Scorecard in Google Sheets does that with ten KPIs, three switches, two trend charts and one table to type into – for $8.99 one time, with no per-user cost and no subscription.Garage Door Service KPI Scorecard in Google Sheets
Get the Garage Door Service KPI Scorecard in Google Sheets – instant download, unlimited users.