In the fast-paced electronics industry, managing key performance indicators (KPIs) is essential for monitoring and improving business operations. KPIs provide critical insights into various aspects of the business, including sales, manufacturing, and customer service. A well-designed KPI dashboard enables businesses to track their progress in real-time and make data-driven decisions.
In this article, we will explore the Electronics KPI Dashboard in Google Sheets—a ready-to-use template designed to help electronics businesses track essential KPIs efficiently. This guide will cover the KPIs, their definitions, formulas, and whether they should be “lower the better” or “upper the better.”
Key Features of the Electronics KPI Dashboard in Google Sheets
Before diving into the specifics of the KPIs, let’s first understand the key features of this dashboard template:
Dashboard Sheet Tab
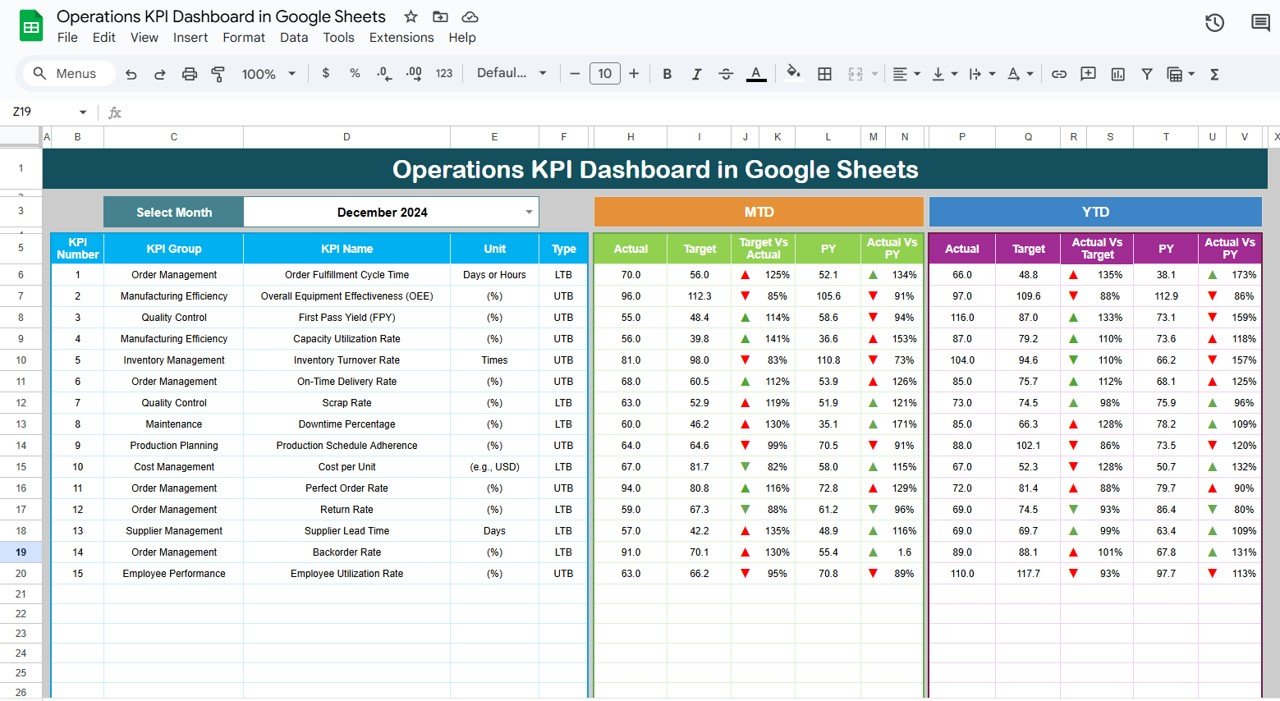
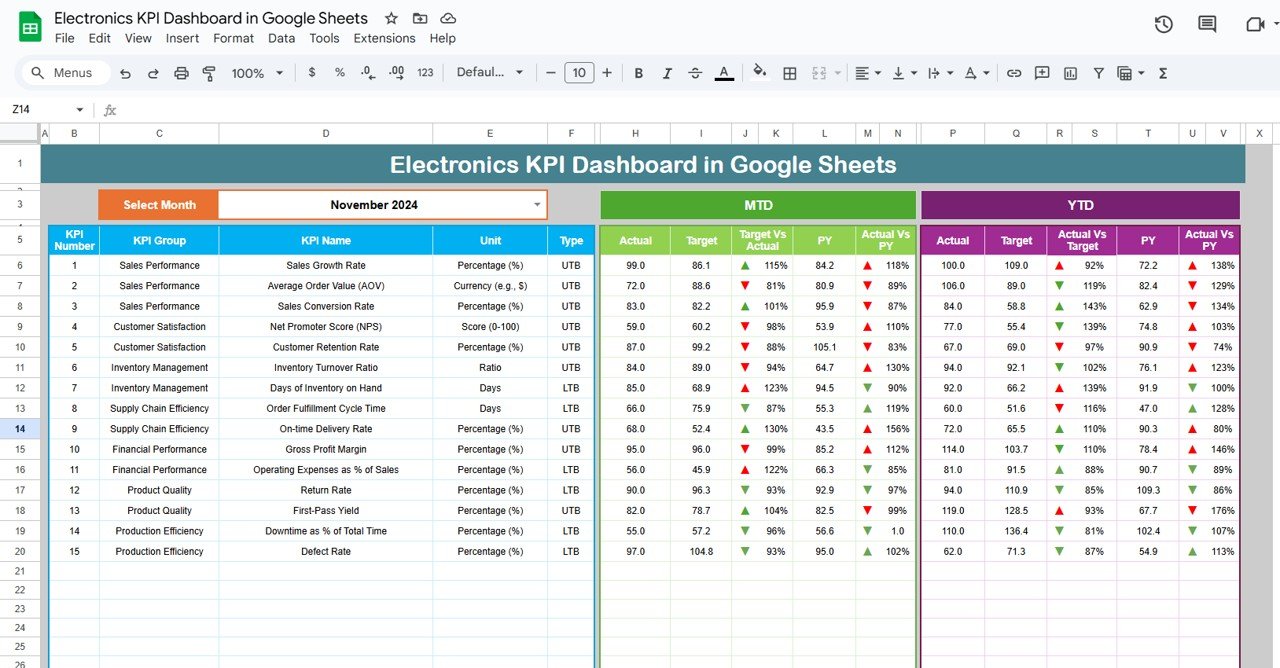
The dashboard serves as the central hub for monitoring all KPIs. Here, you can select the month from a drop-down menu (cell D3), and the dashboard will dynamically update to display the current month’s data. It includes:
-
MTD (Month-to-Date) Actual vs Target: Displays how well the company is meeting its monthly goals.
-
YTD (Year-to-Date) Actual vs Target: Shows a cumulative view of performance throughout the year.
-
Comparison with Previous Year: Compares current data with the same period in the previous year, using conditional formatting (up or down arrows) to highlight changes.
Click to buy Electronics KPI Dashboard in Google Sheets
KPI Trend Sheet Tab
This tab allows users to select specific KPIs from a drop-down list (cell C3). For each KPI, the dashboard will show:
-
KPI Group
-
Unit of Measure
-
Type (Lower the Better or Upper the Better)
-
Formula to calculate the KPI
-
KPI Definition

Actual Numbers Sheet Tab
In this tab, you input the actual numbers for both MTD and YTD, which are used for comparison in the dashboard. The month selection is available in cell E1.

Click to buy Electronics KPI Dashboard in Google Sheets
Target Sheet Tab
This tab is where you enter the target values for each KPI for MTD and YTD. These values help track performance against set goals.

Previous Year Numbers Sheet Tab
This tab holds the previous year’s data, allowing for year-over-year comparisons. Input the same type of data as the current year for accurate analysis.

Click to buy Electronics KPI Dashboard in Google Sheets
KPI Definition Sheet Tab
This sheet contains detailed information for each KPI, including:
-
KPI Name
-
KPI Group
-
Unit of Measure
-
Formula used to calculate the KPI
-
Definition explaining what each KPI represents

Click to buy Electronics KPI Dashboard in Google Sheets
Advantages of Using an Electronics KPI Dashboard in Google Sheets
An Electronics KPI Dashboard in Google Sheets offers several advantages to businesses aiming to monitor and improve their operations. Here are the key benefits:
-
Real-Time Data Tracking: Monitor KPIs in real-time, enabling quicker decision-making and responsive management of operations.
-
Customizable Templates: Google Sheets allows for flexibility, enabling you to customize the dashboard to meet your unique business needs. You can add or remove KPIs and adjust formulas as necessary.
-
Cost-Effective: Google Sheets is free to use, making it an affordable option for small and medium-sized electronics businesses.
-
Collaboration Features: Being cloud-based, Google Sheets allows multiple team members to collaborate in real-time, keeping everyone updated.
-
Accessibility: Google Sheets can be accessed from any device with internet connectivity, allowing your team to monitor KPIs from anywhere.
Opportunities for Improvement in the Electronics KPI Dashboard
While the Electronics KPI Dashboard in Google Sheets is a powerful tool, there are opportunities to enhance its functionality:
Automating Data Entry
-
Current Challenge: Manual data entry can be time-consuming and prone to errors.
-
Opportunity: Integrating Google Sheets with external systems (e.g., CRM, ERP) can automate data entry, reducing human error and improving efficiency.
Enhanced Visualizations
-
Current Challenge: Basic visualizations might not be engaging enough for all users.
-
Opportunity: Add advanced visualizations such as sparklines, bar charts, and pie charts to make the data more visually engaging and easier to interpret.
Advanced Reporting Features
-
Current Challenge: The dashboard offers basic reporting capabilities.
-
Opportunity: Expand reporting features by adding options for customizable report generation and export, such as PDFs or automated email summaries.
Best Practices for Using the Electronics KPI Dashboard
Click to buy Electronics KPI Dashboard in Google Sheets
To get the most out of the Electronics KPI Dashboard in Google Sheets, consider these best practices:
-
Regularly Update the Data: Ensure that data is updated at least once a month to maintain the accuracy and relevance of the dashboard.
-
Use Clear and Consistent Naming Conventions: Consistently name KPIs, units, and formulas to avoid confusion.
-
Set Realistic Targets: Make sure your targets are achievable and based on historical data, as unrealistic goals can demotivate teams.
-
Encourage Collaboration: Share the dashboard with relevant team members and encourage collaboration to keep everyone aligned.
-
Leverage Conditional Formatting: Use conditional formatting to provide instant visual cues for performance trends, such as up/down arrows or color changes.
Conclusion
The Electronics KPI Dashboard in Google Sheets is a powerful tool for tracking key performance metrics in the electronics industry. By utilizing this dashboard, businesses can monitor operations efficiently, identify areas for improvement, and make informed decisions to drive growth and success.
Frequently Asked Questions (FAQs)
What is a KPI in the electronics industry?
A KPI (Key Performance Indicator) is a measurable value that indicates how effectively a company is achieving its business objectives. In the electronics industry, common KPIs include production efficiency, defect rates, and customer satisfaction.
How can I customize my Electronics KPI Dashboard?
You can easily customize the dashboard by adding or removing KPIs, adjusting formulas, and changing the data sources according to your business needs.
How do I enter data into the Electronics KPI Dashboard?
Simply enter data for KPIs such as actual numbers and targets into the appropriate tabs (Actual Numbers Sheet, Target Sheet, Previous Year Numbers Sheet) for each month.
Can I automate the data entry process?
Yes, you can integrate Google Sheets with other systems like CRM or ERP to automatically populate data, eliminating the need for manual entry.
What KPIs should I track in my electronics business?
Key KPIs for the electronics industry include production efficiency, product defect rates, customer satisfaction, on-time delivery, and warranty claims.
Visit our YouTube channel to learn step-by-step video tutorials
Youtube.com/@NeotechNavigators