Efficient performance tracking is essential in the printing and publishing industry, where managing production, costs, and customer satisfaction is crucial. The Printing & Publishing KPI Dashboard in Google Sheets is a ready-to-use template that helps you track and optimize key performance indicators (KPIs) for your printing and publishing operations.
In this article, we will explore the Printing & Publishing KPI Dashboard in Google Sheets, its key features, and how it can help improve the overall efficiency and effectiveness of your operations.
Key Features of the Printing & Publishing KPI Dashboard in Google Sheets
Below are the key features of this KPI dashboard template:
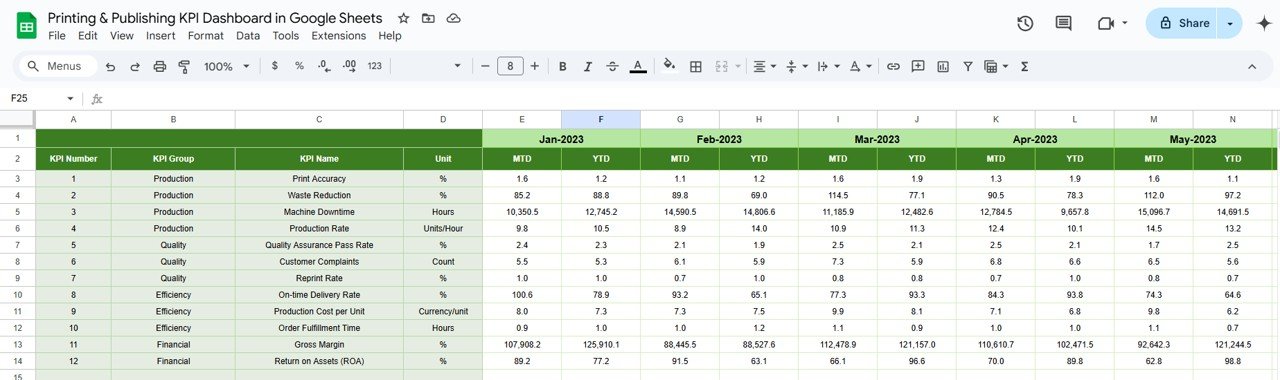
1. Dashboard Sheet Tab
This is the main sheet where all KPI data is displayed.
-
Month Selection: In Range D3, select the month from the drop-down menu, and the dashboard will update to show data for that month.
-
MTD (Month-to-Date): Displays actual numbers, target values, and comparisons with previous year data using conditional formatting (up or down arrows).
-
YTD (Year-to-Date): Shows cumulative performance with comparisons to target and previous year data.

Click to buy Printing & Publishing KPI Dashboard in Google Sheets
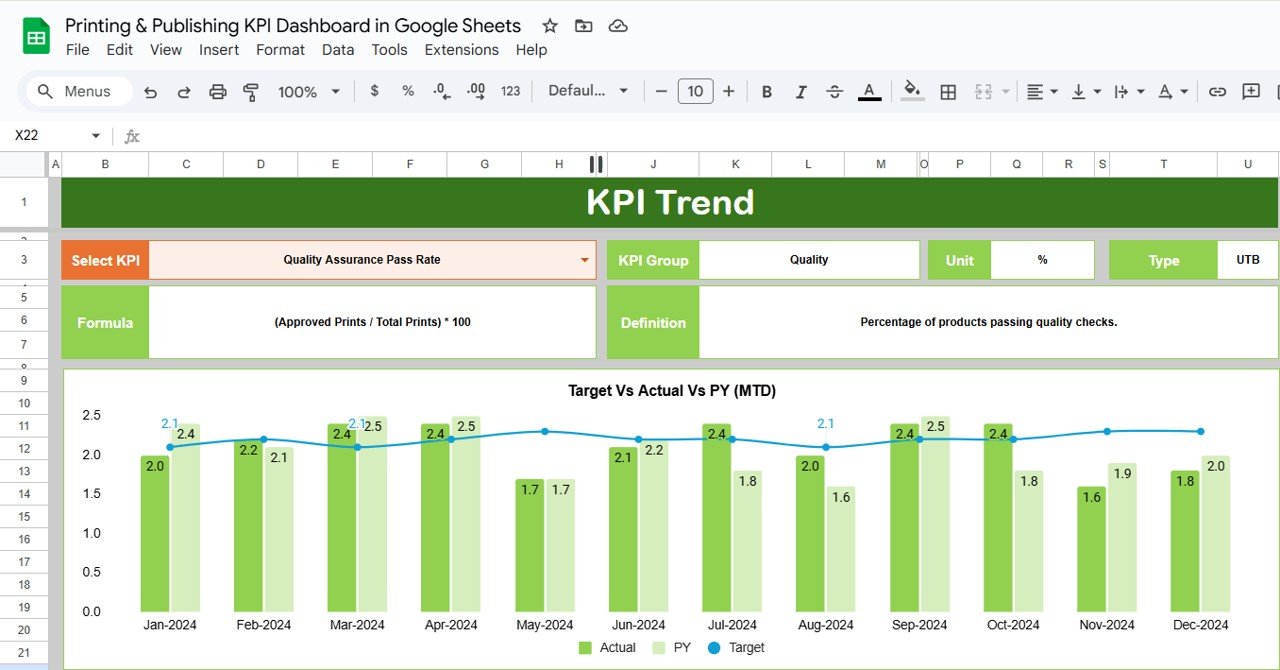
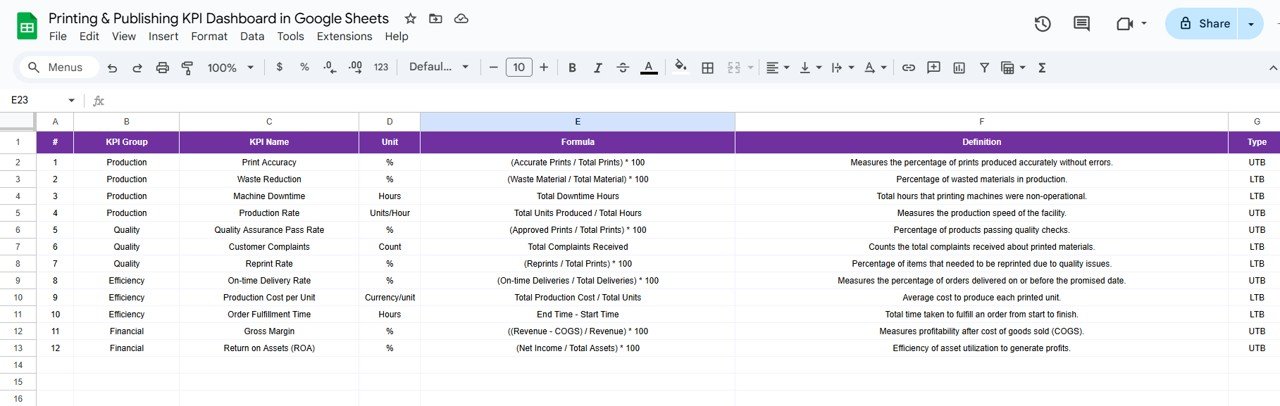
2. KPI Trend Sheet Tab
-
Select KPIs from the dropdown in Range C3.
-
Displays KPI group, unit of measure, type (Lower the Better or Upper the Better), formula, and KPI definition.
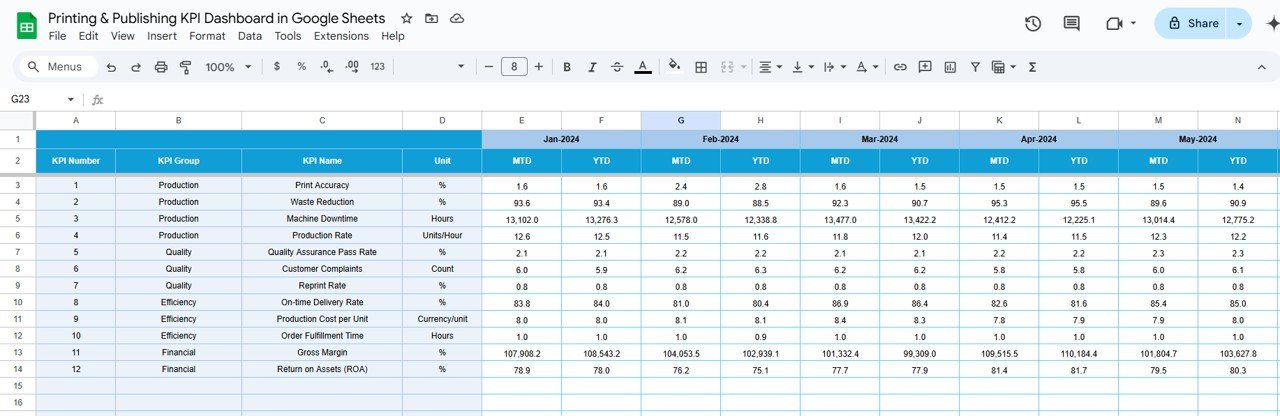
3. Actual Number Sheet Tab
-
Input actual numbers for MTD and YTD for the selected month.
-
The month selection is available in Range E1, where you input the first month of the year.

Click to buy Printing & Publishing KPI Dashboard in Google Sheets
4. Target Sheet Tab
-
Enter target values for each KPI for MTD and YTD.
-
Helps track performance against the set goals.
5. Previous Year Number Sheet Tab
-
Enter previous year’s data for year-over-year comparisons.
-
This data should be entered in the same format as the current year to maintain consistency.
6. KPI Definition Sheet Tab
This sheet contains detailed information for each KPI, including:
- KPI Name
- KPI Group
- Unit of Measure
- Formula for KPI Calculation
- Definition of the KPI
Click to buy Printing & Publishing KPI Dashboard in Google Sheets
Advantages of Using the Printing & Publishing KPI Dashboard in Google Sheets
The Printing & Publishing KPI Dashboard in Google Sheets offers several benefits to businesses:
-
Real-Time Tracking: Track key performance metrics in real-time to make data-driven decisions.
-
Customizable: Customize the dashboard to suit your specific KPIs and production needs.
-
Cost-Effective: Google Sheets is free, making it an affordable solution for businesses of any size.
-
Collaboration: Share the dashboard with team members to improve communication and coordination across the production process.
-
Accessibility: Access the dashboard from any device with internet connectivity, ensuring that you are always up-to-date.
Opportunities for Improvement in the Printing & Publishing KPI Dashboard
While the Printing & Publishing KPI Dashboard in Google Sheets is a powerful tool, there are opportunities for improvement:
Automating Data Entry:
- Current Challenge: Manual data entry can be time-consuming and prone to errors.
- Opportunity: Integrating the dashboard with production and inventory systems can automate data entry, saving time and improving accuracy.
Advanced Visualizations:
- Current Challenge: Basic visualizations might not provide a comprehensive view of trends.
- Opportunity: Add advanced visualizations like graphs, heatmaps, or interactive charts to make data interpretation easier.
Customizable Reporting:
- Current Challenge: The dashboard offers basic reporting features.
- Opportunity: Expand reporting features to allow users to generate customized reports, such as PDF exports or automated email summaries.
Best Practices for Using the Printing & Publishing KPI Dashboard
Click to buy Printing & Publishing KPI Dashboard in Google Sheets
To get the most out of the Printing & Publishing KPI Dashboard in Google Sheets, consider these best practices:
-
Update Data Regularly: Keep the data up to date to monitor performance accurately and make timely adjustments to production.
-
Set Realistic Targets: Use historical data and industry benchmarks to set achievable KPIs.
-
Analyze Trends: Regularly analyze trends to identify areas for improvement and optimize production processes.
-
Collaborate Across Teams: Share the dashboard with relevant departments, such as production, sales, and finance, to improve cross-functional collaboration.
-
Use Conditional Formatting: Highlight key performance trends, such as low production efficiency or high defect rates, with color-coding or arrows.
Conclusion
The Printing & Publishing KPI Dashboard in Google Sheets is an essential tool for optimizing your printing and publishing operations. By tracking key metrics like production efficiency, customer satisfaction, and waste rate, businesses can improve efficiency, reduce costs, and boost overall profitability.
Frequently Asked Questions (FAQs)
What is a KPI in printing and publishing?
A KPI (Key Performance Indicator) is a measurable value that indicates how effectively a business is achieving its printing and publishing goals. Common KPIs include production efficiency, cost per unit, and customer satisfaction.
How do I customize my Printing & Publishing KPI Dashboard?
You can easily customize the dashboard by adding or removing KPIs, adjusting formulas, and tailoring it to suit your specific printing and publishing goals.
How do I enter data into the Printing & Publishing KPI Dashboard?
Simply input actual numbers for MTD and YTD in the relevant sheets (Actual Numbers Sheet, Target Sheet, Previous Year Numbers Sheet) for each month.
Can I automate data entry?
Yes, you can integrate the dashboard with other systems, such as production or inventory management, to automate data entry.
Which KPIs should I track in printing and publishing?
Common KPIs for the printing and publishing industry include production efficiency, customer satisfaction, print quality defect rate, and cost per unit.
Visit our YouTube channel to learn step-by-step video tutorials
Youtube.com/@NeotechNavigators
Click to buy Printing & Publishing KPI Dashboard in Google Sheets