Running a small business involves juggling multiple tasks while ensuring that key performance indicators (KPIs) are met. The Small Business KPI Dashboard in Google Sheets is an essential tool to help you keep track of vital metrics and improve business performance. This ready-to-use template offers an efficient and customizable solution for monitoring KPIs in real time. In this article, we’ll explore the features of the dashboard, the KPIs tracked, and how to get the most out of this template.
What is a Small Business KPI Dashboard?
A Small Business KPI Dashboard is a tool used to track and visualize the performance of a business using key metrics. By organizing and displaying important KPIs, the dashboard provides a clear overview of the business’s financial health, customer satisfaction, operational efficiency, and other critical aspects.
The Google Sheets template makes it easy for small business owners to monitor their KPIs regularly. This ensures that they can make informed, data-driven decisions for business growth and improvement.
Key Features of the Small Business KPI Dashboard in Google Sheets
The Small Business KPI Dashboard consists of six worksheets, each designed to offer insights into various aspects of your business operations:
1. Dashboard Sheet Tab
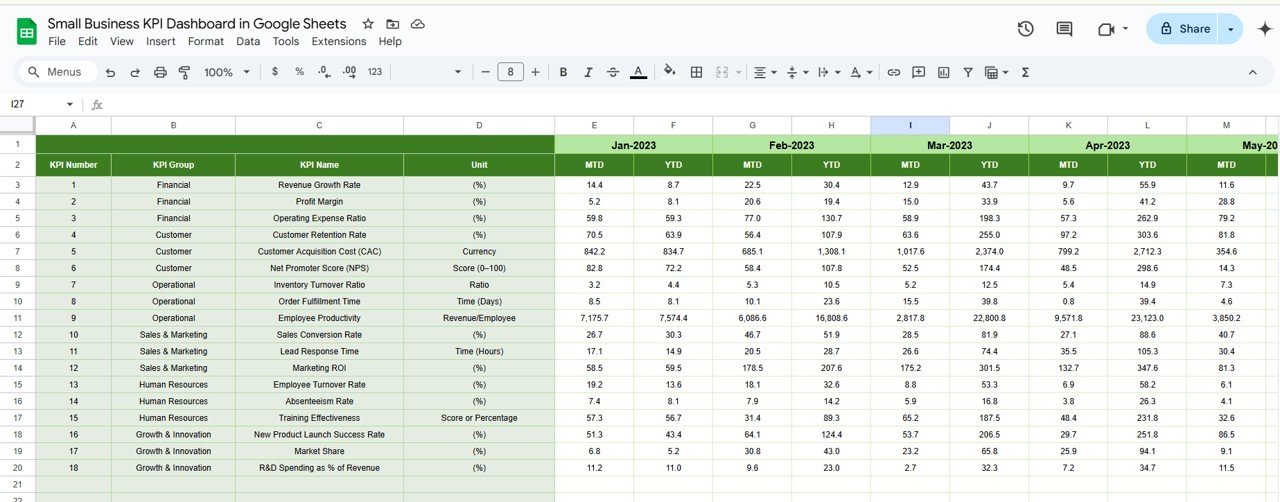
The Dashboard Sheet is the main hub of the dashboard, where all KPI data is displayed:
Dropdown for Month Selection (D3): This feature allows you to select the month, and the dashboard will automatically update to display the data for that month.
Metrics Displayed:
- MTD (Month-to-Date) Actual, Target, Previous Year Data: Displays the actual performance against the set targets, as well as comparisons with previous year’s data.
- YTD (Year-to-Date) Actual, Target, Previous Year Data: Shows the year-to-date performance compared to the target and previous year’s data.
-
Conditional Formatting: Color-coded up/down arrows indicate performance versus target or previous year data, providing an immediate visual cue of performance.

Click to buy Small Business KPI Dashboard in Google Sheets
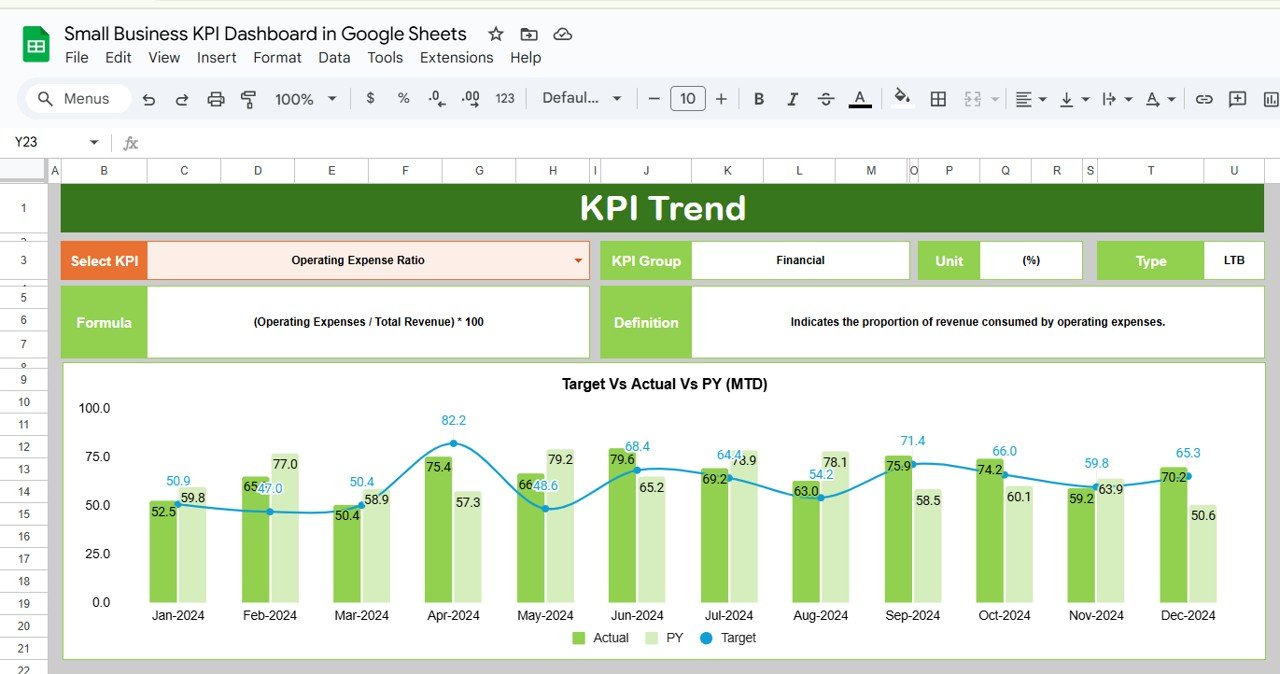
2. KPI Trend Sheet Tab
The KPI Trend Sheet allows you to track the performance of specific KPIs over time:
-
KPI Dropdown (C3): Select a KPI from the dropdown list to display its historical performance.
-
KPI Details: Includes information about the KPI Group, Unit of KPI, whether the KPI is a “Lower the Better” (LTB) or “Upper the Better” (UTB) metric, and the Formula for calculating the KPI.
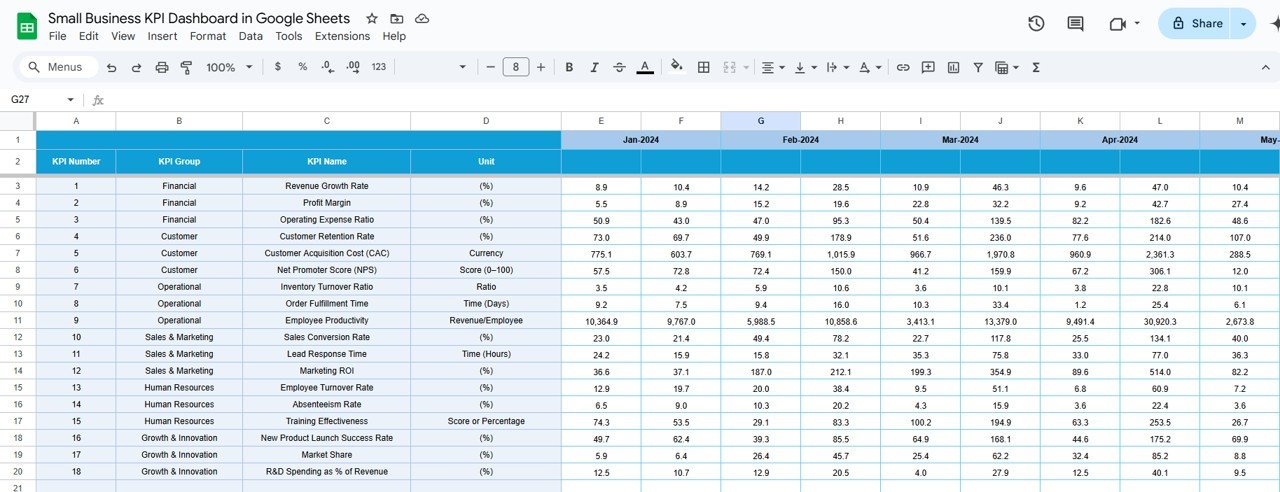
3. Actual Numbers Sheet Tab
The Actual Numbers Sheet is where you input actual values for each KPI:
-
YTD and MTD Input: Enter the actual numbers for the year-to-date (YTD) and month-to-date (MTD) performance.
-
Dynamic Month Selection (E1): The first month of the year is entered in Range E1, and the data will update based on the selected month.
Click to buy Small Business KPI Dashboard in Google Sheets
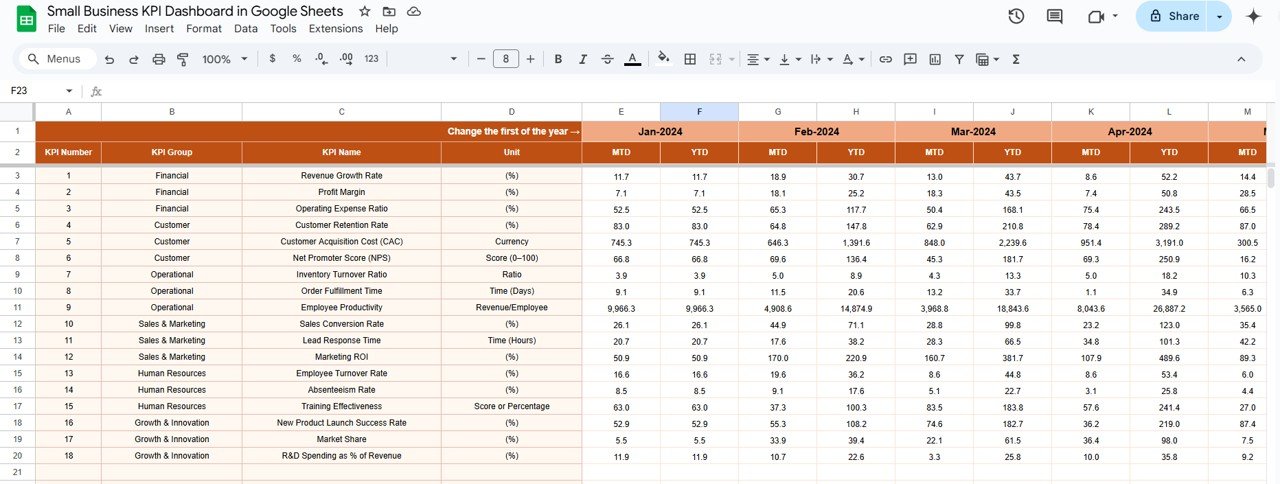
4. Target Sheet Tab
The Target Sheet is where you enter the targets for each KPI:
-
Monthly and YTD Targets: Input the target numbers for each KPI for both month-to-date and year-to-date performance.
5. Previous Year Number Sheet Tab
This sheet allows you to input the previous year’s data for comparison with the current year:
Click to buy Small Business KPI Dashboard in Google Sheets
-
Comparison of Actuals: Enter previous year’s performance to compare against the current year’s actual numbers for better analysis.
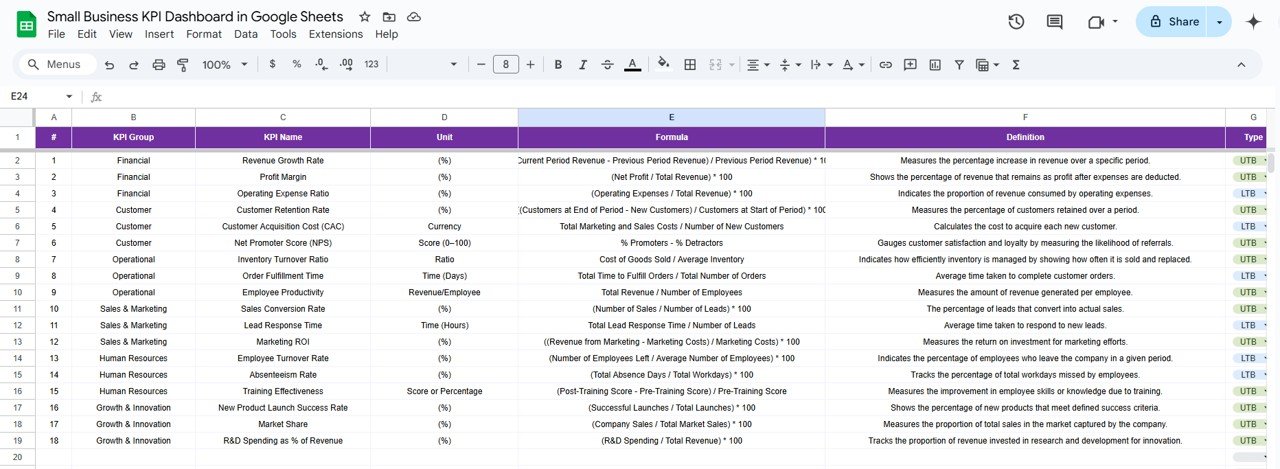
6. KPI Definition Sheet Tab
The KPI Definition Sheet is where you can define each KPI used in the dashboard:
-
KPI Name, Group, Unit: Define the KPI’s name, group, and unit of measure.
-
Formula and Definition: Include the formula used to calculate the KPI and a detailed definition to ensure clarity.
Click to buy Small Business KPI Dashboard in Google Sheets
Advantages of Using the Small Business KPI Dashboard in Google Sheets
The Small Business KPI Dashboard in Google Sheets offers several key advantages:
-
Real-Time Tracking: By inputting actual data, the dashboard provides real-time insights into business performance, helping you stay on top of important metrics.
-
Data-Driven Decisions: With accurate KPIs and performance metrics, you can make informed decisions based on real data rather than guesswork.
-
Customization: The dashboard is fully customizable, allowing you to add or modify KPIs as your business needs evolve.
-
Improved Goal Setting: Setting and tracking clear KPIs helps improve focus and drive toward specific business goals.
-
Easy Collaboration: As the template is in Google Sheets, you can easily share it with your team, ensuring everyone is aligned on performance metrics.
Opportunity for Improvement in the Small Business KPI Dashboard
While the Small Business KPI Dashboard is a powerful tool, there are areas where it could be further enhanced:
-
Automated Data Input: Integrating the dashboard with other tools (e.g., CRM or accounting software) for automated data import would reduce manual work and improve accuracy.
-
Advanced Analytics: Adding features like predictive analytics to forecast future trends based on historical data could be a valuable addition.
-
Mobile-Friendly Version: Developing a mobile-friendly version of the dashboard would make it more accessible on the go for small business owners.
-
Expanded KPI Tracking: Depending on your business, you could track additional KPIs such as website traffic, social media engagement, or customer satisfaction scores.
Best Practices for Using the Small Business KPI Dashboard
To maximize the effectiveness of the Small Business KPI Dashboard, consider the following best practices:
- Update Data Regularly: Input your actual numbers regularly to keep the dashboard up to date and accurate.
- Focus on Key KPIs: Prioritize the most relevant KPIs for your business to avoid overwhelming yourself with data.
- Set Achievable Targets: Use realistic targets for each KPI that push your business to grow without being too unrealistic.
- Share Insights with Your Team: Regularly review the dashboard with your team to ensure everyone is on the same page and working toward the same goals.
- Review Trends Over Time: Use the trend analysis features in the dashboard to spot patterns and make adjustments to improve performance.
Conclusion
Click to buy Small Business KPI Dashboard in Google Sheets
The Small Business KPI Dashboard in Google Sheets is an invaluable tool for small business owners looking to track performance, set achievable goals, and make data-driven decisions. By providing real-time insights into key metrics such as revenue, customer acquisition costs, and employee productivity, this dashboard helps business owners streamline operations and focus on areas that need improvement. With its customizable features, this dashboard is an essential asset for any small business.
Frequently Asked Questions (FAQs)
1. What is the Small Business KPI Dashboard?
The Small Business KPI Dashboard is a tool that tracks important business metrics (KPIs) to help small business owners monitor performance and make informed decisions.
2. How do I customize the Small Business KPI Dashboard?
The dashboard is fully customizable. You can add or remove KPIs, adjust target numbers, and modify formulas to suit your specific business needs.
3. How often should I update the data in the dashboard?
It’s recommended to update the dashboard regularly (e.g., weekly or monthly) to ensure that you have the most current data for decision-making.
4. What KPIs should I track for my small business?
You should track KPIs that are most relevant to your business. Common KPIs for small businesses include sales revenue, customer acquisition cost, profit margin, and employee productivity.
5. Can I share the Small Business KPI Dashboard with my team?
Yes, since it’s a Google Sheets template, you can easily share it with your team, allowing for collaboration and transparency.
Visit our YouTube channel to learn step-by-step video tutorials
Youtube.com/@NeotechNavigators
Watch the step-by-step video Demo: