In today’s rapidly evolving world of digital education, tracking key performance indicators (KPIs) is vital for ensuring that educational goals are met and that progress is measurable. The Digital Learning KPI Dashboard in Google Sheets is an efficient, user-friendly tool designed to help educators and administrators track and visualize essential metrics to improve the effectiveness of their digital learning initiatives.
This article will take you through everything you need to know about the Digital Learning KPI Dashboard in Google Sheets—its key features, KPIs, best practices, opportunities for improvement, and frequently asked questions.
What is a Digital Learning KPI Dashboard in Google Sheets?
A Digital Learning KPI Dashboard in Google Sheets is an interactive tool designed to track key performance indicators (KPIs) related to digital learning initiatives. With a simple yet powerful setup, it allows users to monitor a variety of metrics, helping administrators make informed decisions. This dashboard is built with Google Sheets, making it easy to access and collaborate with others in real time.
Key Features of the Digital Learning KPI Dashboard in Google Sheets
The Digital Learning KPI Dashboard is divided into six comprehensive worksheets, each tailored to help users input, analyze, and visualize key data. Below is a breakdown of each worksheet and its purpose:
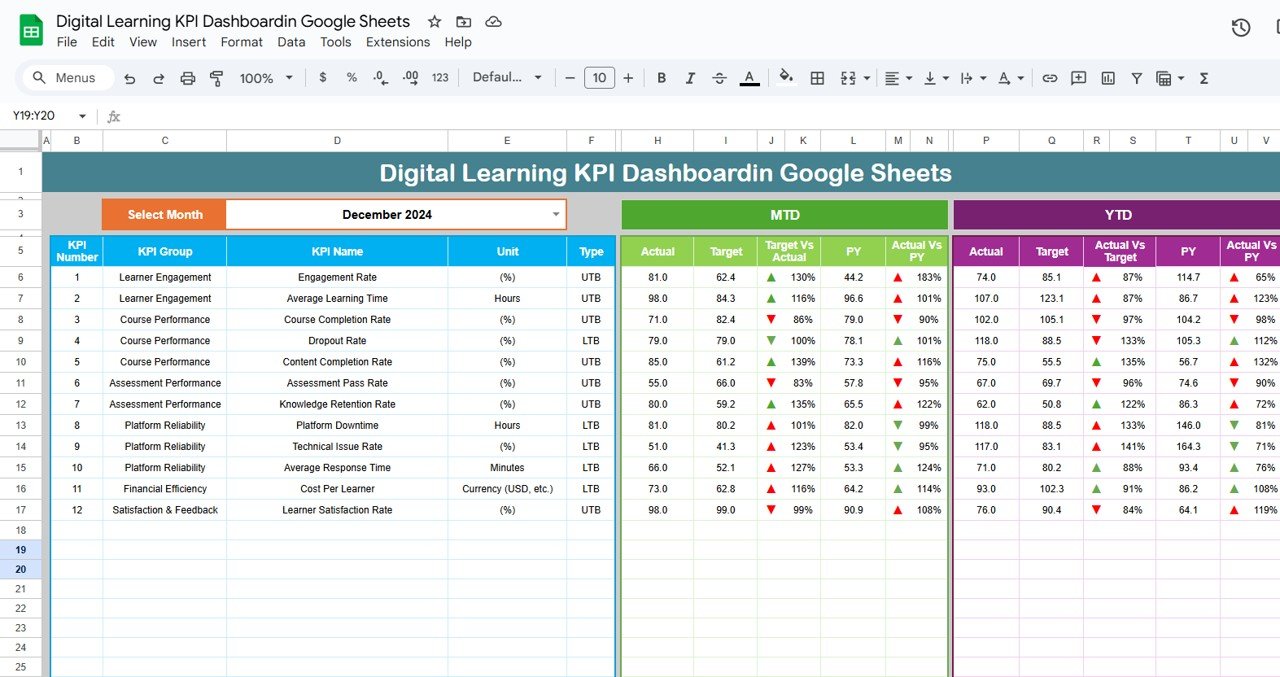
Dashboard Sheet Tab
The main page of the dashboard provides an overview of all the KPIs.
Month Selection: You can select the month of interest using a dropdown menu in cell D3. The entire dashboard will update based on your selection, showing updated KPIs for the chosen month.
Metrics Displayed:
- MTD Actual: Displays the actual performance for the selected month.
- MTD Target: Shows the set target for the month.
- PY (Previous Year) vs Actual: Compares the current month’s actual performance to the same period in the previous year.
- YTD Actual: Shows the year-to-date actual performance.
- Target vs Actual: Displays the comparison between the year-to-date target and actual performance.
- Conditional Formatting: Arrows indicate whether the performance is up or down compared to the target and the previous year.
Click to buy Digital Learning KPI Dashboardin Google Sheets
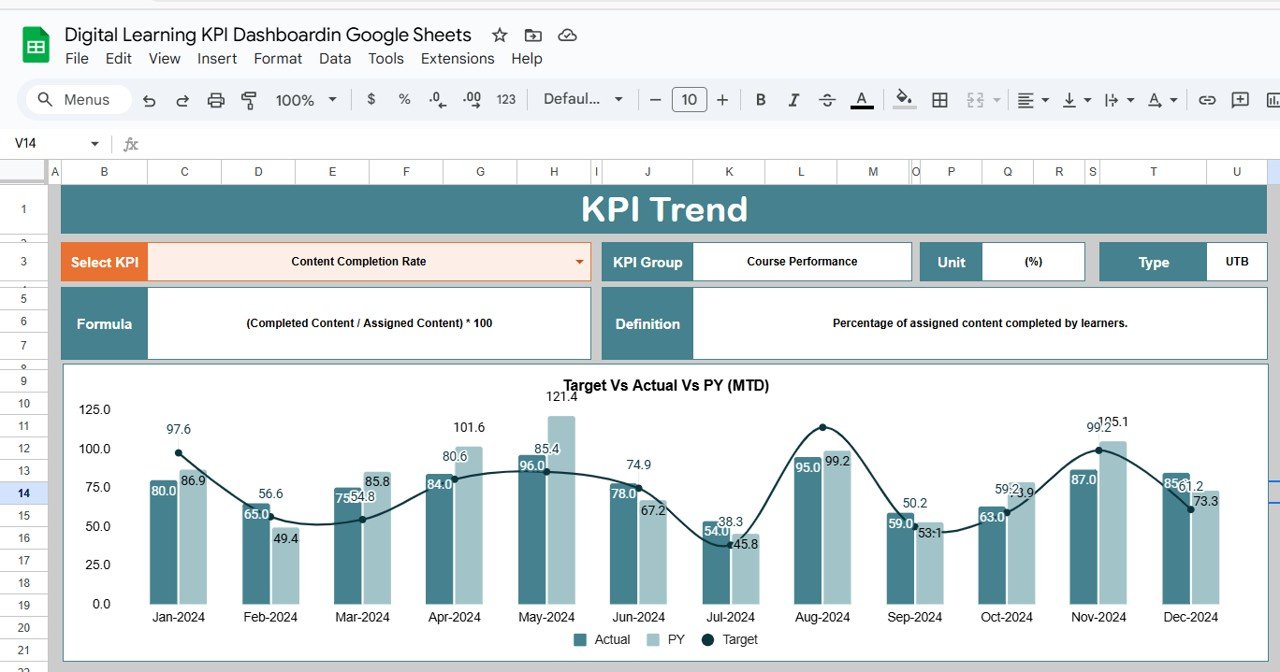
KPI Trend Sheet Tab
This tab allows you to analyze the trend of specific KPIs over time.
- KPI Selection: Select the KPI name from the dropdown in C3.
- KPI Details: Displays the KPI group, unit, formula, definition, and whether the KPI is “Lower the Better” or “Upper the Better.”
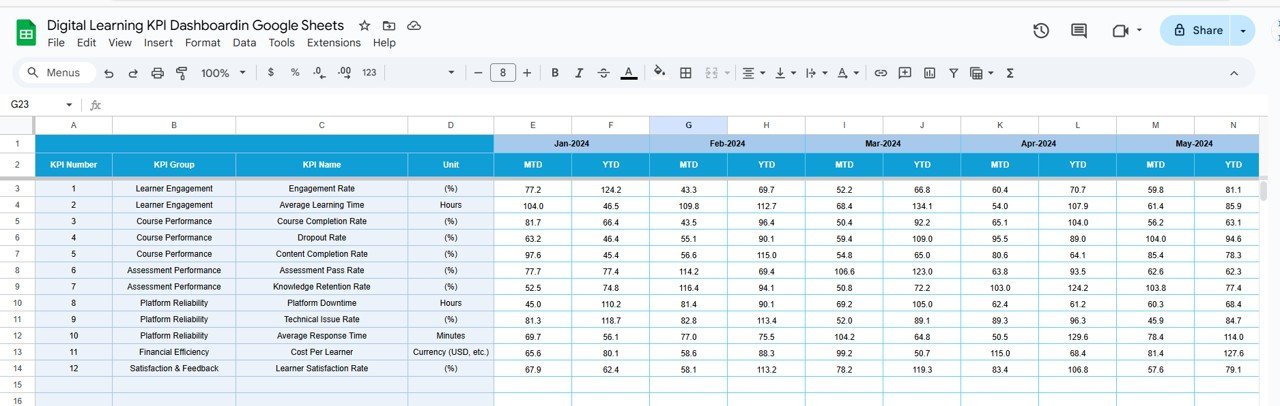
Actual Number Sheet Tab
- Input Data: In this tab, you can input the actual performance data for the current year.
- Monthly Entry: The user can change the month for which the actual data is being entered by adjusting the value in E1.

Click to buy Digital Learning KPI Dashboardin Google Sheets
Target Sheet Tab
- Target Data: Enter the target figures for each KPI for both MTD and YTD.
- This tab helps compare actual numbers with the pre-set targets.
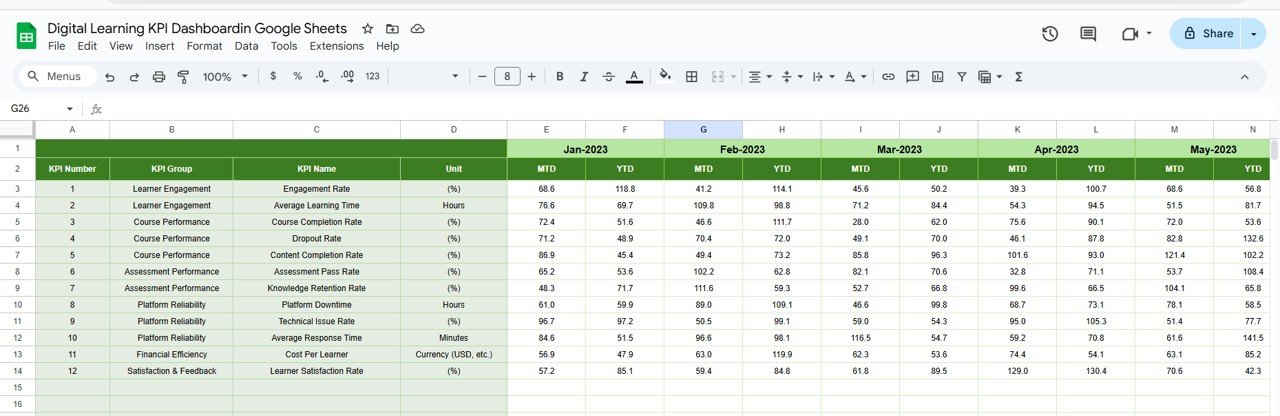
Previous Year Number Sheet Tab
- Historical Data: This sheet stores the performance numbers from the previous year.
- Comparison: This data is compared against the current year’s data to track progress and improvement.
Click to buy Digital Learning KPI Dashboardin Google Sheets
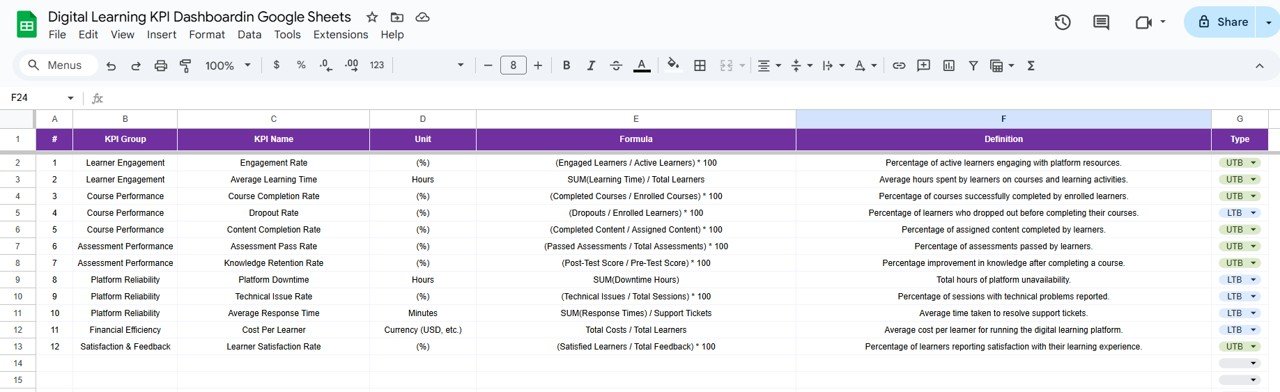
KPI Definition Sheet Tab
- KPI Details: This sheet contains all the necessary information for each KPI, including the name, group, unit, formula, and detailed definitions.
Advantages of Using the Digital Learning KPI Dashboard
The Digital Learning KPI Dashboard in Google Sheets offers numerous benefits, including:
- Centralized Tracking: All key performance data is displayed in one place, making it easy to monitor progress and make data-driven decisions.
- Real-Time Updates: The dashboard dynamically updates as you enter new data, ensuring that you’re always working with the most current information.
- Customizable: You can select different KPIs and time periods, allowing you to tailor the dashboard to your specific needs.
- Ease of Use: The interface is user-friendly, with clear sections and dropdown menus for simple navigation and input.
- Data Visualization: The dashboard provides visual cues (e.g., up and down arrows) to make it easier to spot trends and analyze performance at a glance.
Opportunity to Improve in Digital Learning KPIs
While the Digital Learning KPI Dashboard in Google Sheets is a powerful tool, there are always opportunities for improvement:
-
Advanced Data Visualization: Consider adding more sophisticated visualizations, such as graphs and charts, to enhance data comprehension.
-
Integration with Other Tools: Integrating the dashboard with other platforms, such as LMS (Learning Management Systems), can automate data inputs and improve accuracy.
-
Personalized Dashboards: Allowing users to create customized dashboards based on their specific needs and learning goals could provide more flexibility.
-
AI-Powered Insights: Incorporating machine learning to predict trends and provide actionable recommendations based on past performance could take the dashboard to the next level.
Best Practices for Using the Digital Learning KPI Dashboard
Click to buy Digital Learning KPI Dashboardin Google Sheets
To make the most of the Digital Learning KPI Dashboard, consider the following best practices:
-
Set Clear Targets: Establish clear and achievable targets for each KPI to ensure you’re measuring the right outcomes and guiding progress effectively.
-
Regularly Update Data: Ensure that data is entered consistently and promptly to maintain the dashboard’s accuracy and reliability.
-
Review Trends: Regularly review the trends for each KPI to identify areas that need improvement or adjustments in your learning strategy.
-
Leverage Insights: Use the insights gained from the dashboard to refine your digital learning programs and make informed decisions about content, delivery methods, and learner engagement strategies.
-
Collaborate with Team Members: Share the dashboard with relevant stakeholders (e.g., instructors, administrators) to facilitate data-driven discussions and collaborative decision-making.
Frequently Asked Questions (FAQs)
Click to buy Digital Learning KPI Dashboardin Google Sheets
1. How can I update the Digital Learning KPI Dashboard?
Simply input your new data for MTD (Month to Date) and YTD (Year to Date) into the Actual Number Sheet and Target Sheet. The dashboard will automatically update based on the latest entries.
2. Can I add more KPIs to the dashboard?
Yes, you can easily customize the dashboard by adding new KPIs to the KPI Definition Sheet and adjusting the dashboard and trend sheet accordingly.
3. Is the Digital Learning KPI Dashboard in Google Sheets suitable for remote teams?
Absolutely! Since the dashboard is built in Google Sheets, it is fully accessible from anywhere, allowing your team to collaborate in real-time.
4. Can I use the Digital Learning KPI Dashboard for other types of learning?
While the template is designed for digital learning, you can adapt it for other types of learning by modifying the KPIs and definitions to fit your needs.
5. How do I track learner satisfaction using this dashboard?
Learner satisfaction can be tracked by gathering feedback through surveys and entering the ratings into the KPI Trend Sheet. The dashboard will display the average satisfaction score.
Conclusion
The Digital Learning KPI Dashboard in Google Sheets is an invaluable tool for tracking and analyzing key metrics in digital education. By offering easy customization, real-time data updates, and comprehensive KPI tracking, this dashboard ensures that educators and administrators can make data-driven decisions to improve learning outcomes.
Visit our YouTube channel to learn step-by-step video tutorials
Youtube.com/@NeotechNavigators