Construction sites are inherently risky environments, making safety a top priority for both employers and workers. To ensure safety standards are met and to reduce workplace accidents, construction companies rely on monitoring various safety-related key performance indicators (KPIs). The Construction Safety KPI Dashboard in Google Sheets is a ready-to-use tool that helps construction managers track essential safety metrics such as accident rates, safety inspections, and training completions.
In this article, we’ll explore the Construction Safety KPI Dashboard in Google Sheets, its features, and how it can help you optimize safety management by tracking vital KPIs in real-time.
What is the Construction Safety KPI Dashboard in Google Sheets?
The Construction Safety KPI Dashboard in Google Sheets is an interactive template that allows construction managers to track and analyze key safety-related metrics. This dashboard helps ensure that safety practices are being followed, incidents are tracked, and necessary safety training is completed.
The template consists of six main worksheets, each designed to focus on different aspects of construction safety, from accident reporting and safety inspections to training and compliance.
Key Features of the Construction Safety KPI Dashboard in Google Sheets
The dashboard consists of six main worksheets, each dedicated to different facets of construction safety:
1. Dashboard Sheet Tab
The Dashboard Sheet serves as the main page of the template, offering a comprehensive overview of all the KPIs related to construction safety. Key features include:
MTD (Month-to-Date) and YTD (Year-to-Date) Metrics:
- MTD Actual: Displays the actual data for the current month.
- MTD Target: Shows the target data for the current month.
- PY vs Actual: Compares the current month’s performance with the same period from the previous year (PY).
- YTD Actual: Cumulative actual data for the year.
- YTD Target vs Actual: Comparison of the YTD target with actual performance for the year.
- Conditional Formatting: Up and down arrows are used to show whether performance is above or below the target and PY data.

Click to buy Construction Safety KPI Dashboard in Google Sheets
2. KPI Trend Sheet Tab
The KPI Trend Sheet helps you track individual KPIs over time, allowing you to analyze trends in construction safety performance.
KPI Selection Dropdown:
In C3, you can select a KPI, and the sheet will display:
- KPI Group: The category to which the KPI belongs (e.g., accident rates, safety inspections).
- Unit of KPI: The unit of measurement for the KPI (e.g., percentage, number of incidents, hours).
- Type of KPI: Whether the KPI is “Lower the Better” or “Upper the Better.”
- Formula of KPI: How each KPI is calculated.
- KPI Definition: A clear description of what each KPI measures and why it is important for safety management.

Click to buy Construction Safety KPI Dashboard in Google Sheets
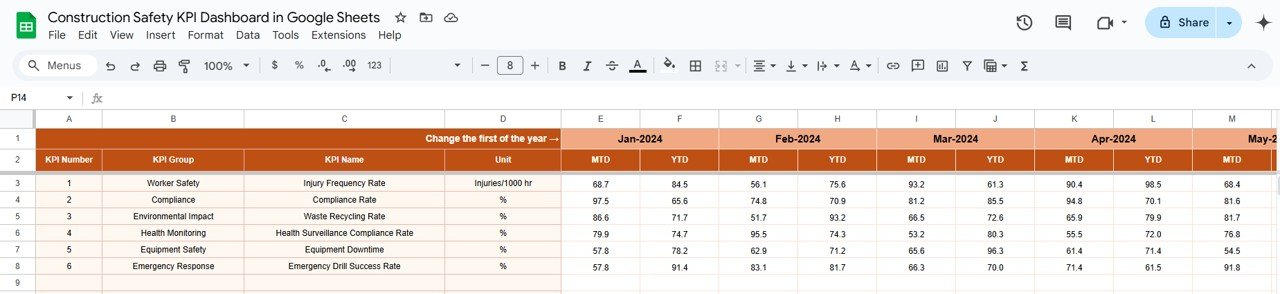
3. Actual Number Sheet Tab
The Actual Number Sheet is where you enter the actual data for MTD and YTD. This data is used to update the dashboard and track performance.
-
Monthly Data Entry:
Enter the actual numbers for each KPI for the selected month (indicated in E1), and the dashboard will update to reflect the new data.
Click to buy Construction Safety KPI Dashboard in Google Sheets
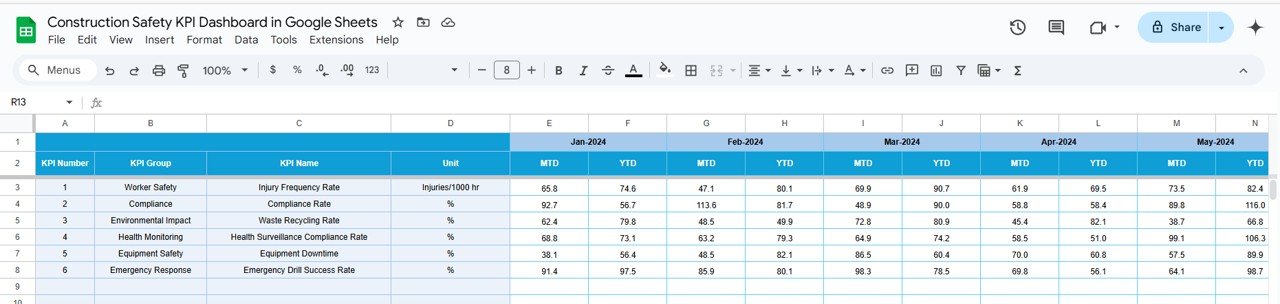
4. Target Sheet Tab
The Target Sheet allows you to set target values for each KPI, both MTD and YTD. These targets are used to evaluate the effectiveness of your safety measures.
-
Target Data Entry:
Input the target values for each KPI, and compare them with actual performance in the dashboard.
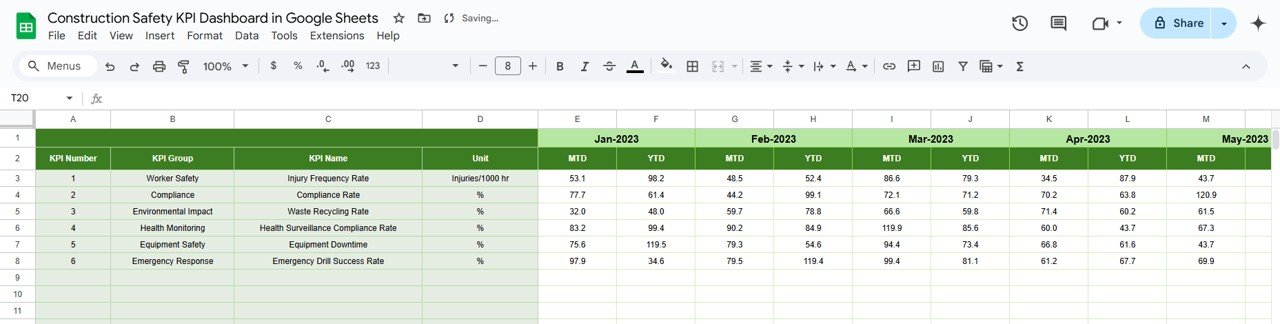
5. Previous Year Number Sheet Tab
The Previous Year Number Sheet stores data from the previous year, allowing for comparisons with the current year’s performance.
-
Previous Year Data Entry:
Enter last year’s data for each KPI to assess the improvement or decline in safety performance over time.
Click to buy Construction Safety KPI Dashboard in Google Sheets
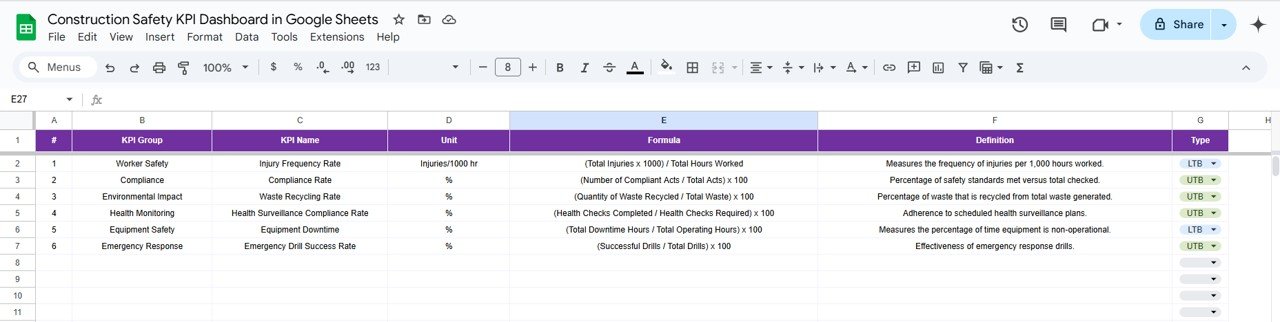
6. KPI Definition Sheet Tab
The KPI Definition Sheet provides definitions for each KPI, ensuring everyone involved understands the metrics being tracked.
-
KPI Definitions:
Each KPI is clearly defined, including its name, group, unit, formula, and the metric it tracks.
-
KPI Definition Sheet Tab
Advantages of Using the Construction Safety KPI Dashboard
Click to buy Construction Safety KPI Dashboard in Google Sheets
-
Real-Time Insights: Track critical safety KPIs in real time, ensuring that you can quickly identify safety issues and take corrective actions before they escalate.
-
Comprehensive Data Tracking: The dashboard tracks multiple aspects of safety, from incident rates and training completion to safety audits and near misses, giving you a complete view of your safety performance.
-
Visual Representation of Data: The charts and graphs in the Dashboard Sheet provide a visual representation of performance, making it easy to identify trends and areas for improvement.
-
Data-Driven Decision Making: With accurate and up-to-date data, the dashboard enables you to make informed decisions that improve workplace safety and reduce risks.
-
Customizable to Your Needs:The template can be easily customized to track additional safety metrics or adapt to the specific needs of your construction site or organization.
Best Practices for Using the Construction Safety KPI Dashboard
-
Update Data Regularly: Ensure that data is entered consistently and on time, so the dashboard reflects the latest performance metrics.
-
Monitor Critical KPIs: Regularly review KPIs such as Total Incidents, Lost Time Injury Rate, and Training Completion Rate to ensure the safety program is effective.
-
Use Trends for Improvement: Use insights from the KPI Trend Sheet to analyze long-term trends in your safety data and adjust your safety protocols accordingly.
-
Leverage Visuals for Communication: Use the Dashboard Sheet to communicate safety performance to stakeholders and make data-driven decisions.
Frequently Asked Questions (FAQs)
Click to buy Construction Safety KPI Dashboard in Google Sheets
1. How do I update the Construction Safety KPI Dashboard?
Simply enter the actual data for each KPI in the Actual Number Sheet. The dashboard will automatically update with the latest performance data.
2. Can I track multiple construction sites with this dashboard?
Yes, the dashboard is customizable. You can modify it to track data from multiple construction sites by adding new columns or creating separate sections for each site.
3. How do I compare year-over-year safety performance?
Enter last year’s data in the Previous Year Number Sheet to compare it with the current year’s performance and assess safety improvements or setbacks.
Conclusion
The Construction Safety KPI Dashboard in Google Sheets is an essential tool for managing safety performance on construction sites. With real-time insights into key safety metrics, such as incident rates, training completion, and compliance, this dashboard helps construction managers make data-driven decisions to improve safety and reduce risks. Whether you’re overseeing a single construction project or managing multiple sites, this dashboard provides the tools you need to ensure a safe and compliant workplace.
Visit our YouTube channel to learn step-by-step video tutorials
Youtube.com/@NeotechNavigators
Watch the step-by-step video Demo:
Click to buy Construction Safety KPI Dashboard in Google Sheets