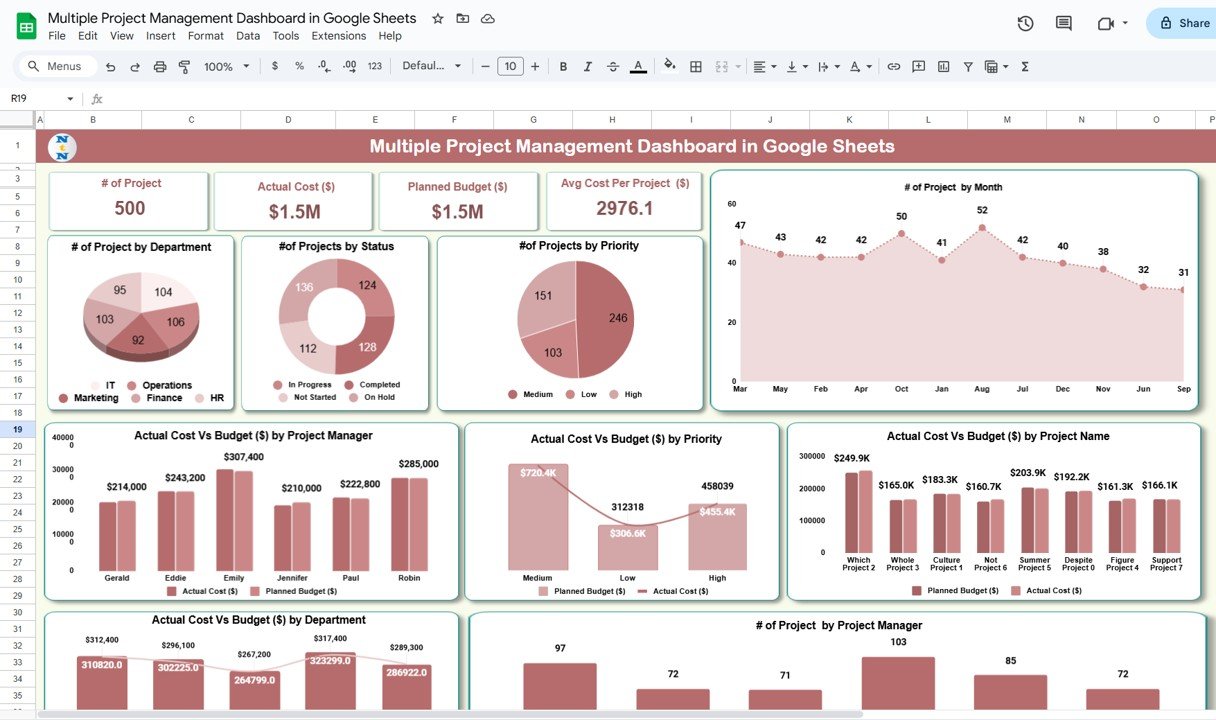
Managing multiple projects simultaneously requires efficient tracking, monitoring, and reporting. The Multiple Project Management Dashboard in Google Sheets is a ready-to-use tool designed to provide a comprehensive overview of project performance. This dashboard allows project managers to track budgets, costs, priorities, and status across various departments and projects in a visually appealing, easy-to-use interface.
What is the Multiple Project Management Dashboard in Google Sheets?
The Multiple Project Management Dashboard in Google Sheets is an interactive tool that enables project managers to monitor the progress of multiple projects at once. It allows for real-time tracking of key metrics such as budget vs. actual costs, project status, and performance by department, priority, and project manager. By using this dashboard, you can ensure your projects stay on track, within budget, and meet deadlines.
Key Features of the Multiple Project Management Dashboard
Click to buy Multiple Project Management Dashboard in Google Sheets
The Multiple Project Management Dashboard includes two key sheets: the Dashboard Sheet and the Data Sheet. Here are the main features:
1. Dashboard Sheet Tab
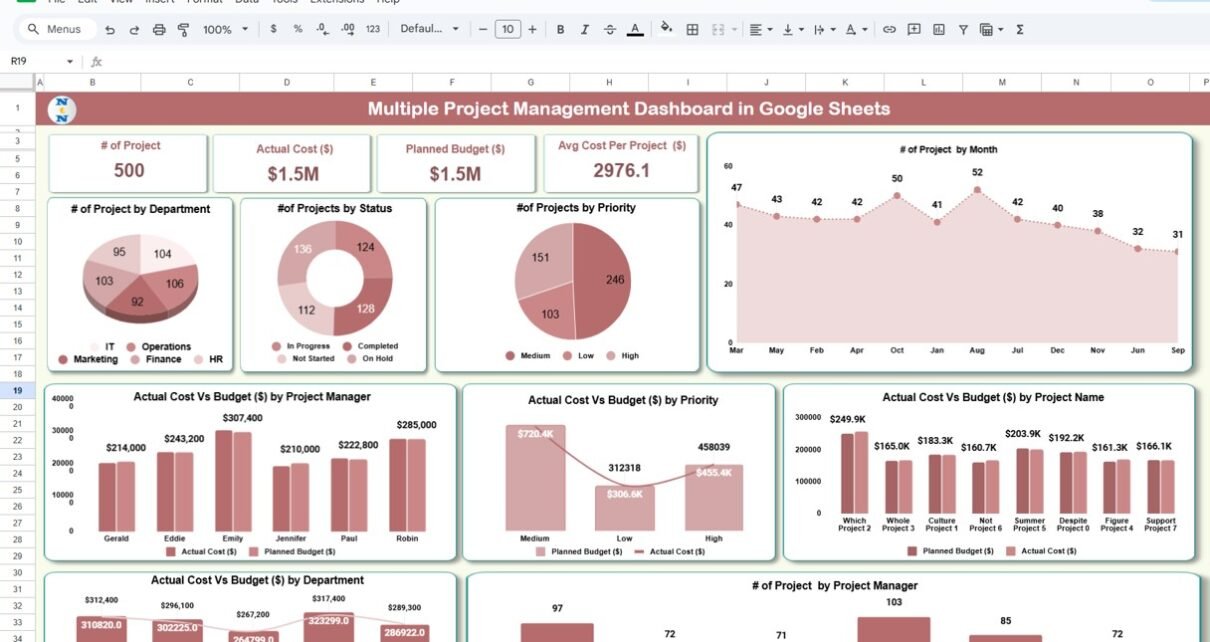
The Dashboard Sheet serves as the main interface where project data is visualized. Key features include:
Cards:
- # of Projects: Displays the total number of projects being tracked.
- Actual Cost ($): Tracks the total actual cost across all projects.
- Planned Budget ($): Displays the planned budget for all projects.
- Avg Cost Per Project ($): Shows the average cost for each project.
Charts:
- # of Projects by Department: Visualizes the number of projects by department (e.g., Marketing, Development, Operations).
- # of Projects by Status: Tracks the number of projects in different statuses (e.g., Not Started, In Progress, Completed).
- # of Projects by Priority: Displays the number of projects categorized by priority (e.g., High, Medium, Low).
- # of Projects by Month: Visualizes the number of projects that were initiated each month.
- Actual Cost vs Budget ($) by Project Manager: Compares the actual cost with the planned budget for each project manager.
- Actual Cost vs Budget ($) by Priority: Compares the actual cost and the budget based on project priority.
- Actual Cost vs Budget ($) by Project Name: Compares the actual cost and budget for each project.
- Actual Cost vs Budget ($) by Department: Compares the actual cost and budget for each department.
- # of Projects by Project Manager: Tracks the number of projects assigned to each project manager.
Click to buy Multiple Project Management Dashboard in Google Sheets
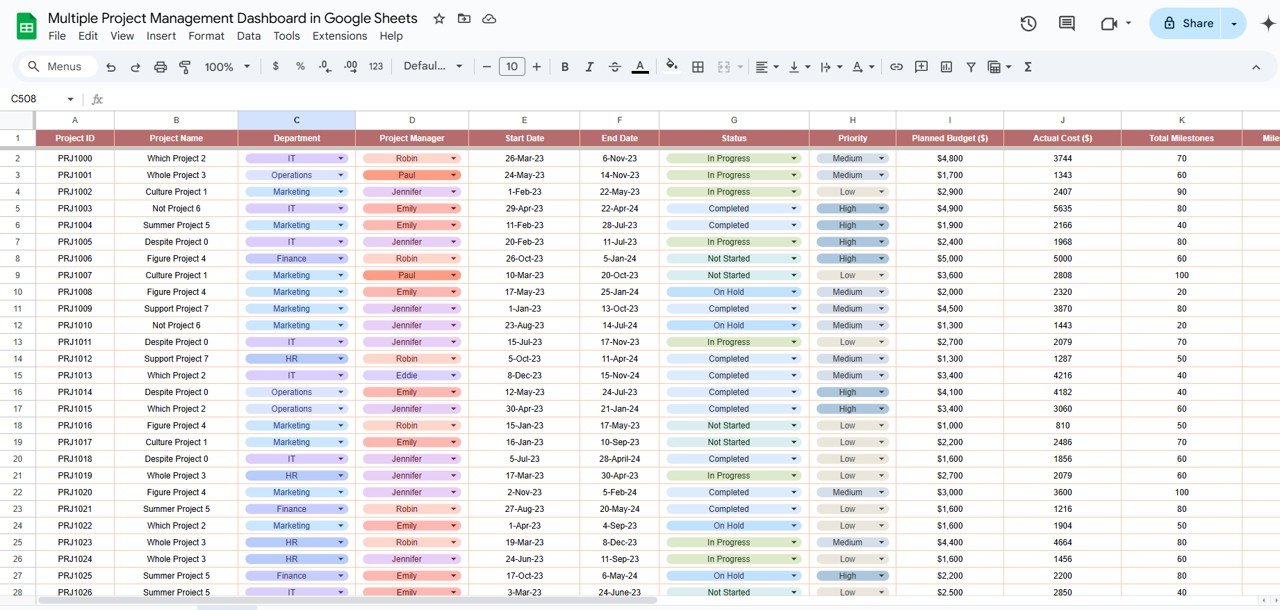
2. Data Sheet Tab
The Data Sheet is where you input detailed information for each project. This data feeds into the charts and metrics in the Dashboard Sheet. Key columns in the Data Sheet include:
Click to buy Multiple Project Management Dashboard in Google Sheets
Benefits of Using the Multiple Project Management Dashboard
-
Centralized Data: All project-related data is stored in one place, making it easy to manage and track multiple projects simultaneously.
-
Real-Time Monitoring: The dashboard provides real-time updates, allowing project managers to make timely adjustments and keep projects on track.
-
Budget Tracking: By comparing actual costs with the planned budget, managers can monitor project expenditures and ensure they stay within budget.
-
Performance Insights: The visual charts help managers identify trends and track key metrics, such as project completion rates and departmental performance.
-
Customizable: The dashboard can be easily customized to suit the specific needs of your projects, including adding new columns, metrics, or charts.
Advantages of Using the Multiple Project Management Dashboard
Click to buy Multiple Project Management Dashboard in Google Sheets
-
Efficient Project Tracking: Track multiple projects across various dimensions (department, priority, manager) with ease.
-
Improved Decision-Making: The dashboard provides actionable insights, enabling managers to make informed decisions and prioritize tasks.
-
Enhanced Accountability: By assigning responsibilities and tracking progress, the dashboard improves accountability across teams.
-
Data-Driven Performance Monitoring: The use of charts and graphs allows for quick analysis of project status and performance trends.
-
Time-Saving: With all project data in one centralized location, managers can quickly access and evaluate key metrics without manual tracking.
Best Practices for Using the Multiple Project Management Dashboard
- Keep Data Up-to-Date: Regularly update the Data Sheet with the latest project details to ensure accuracy in the dashboard.
- Monitor Key KPIs: Track important metrics like Actual Cost vs. Budget, Order Completion Rate, and Project Status to stay on top of project progress.
- Set Clear Deadlines: Ensure that each project has a defined start and end date to help manage timelines and expectations.
- Review Departmental and Manager Performance: Regularly assess performance by department and project manager to identify areas for improvement or further support.
- Use Charts for Trend Analysis: Utilize the charts to track trends over time and adjust strategies based on performance patterns.
Conclusion
The Multiple Project Management Dashboard in Google Sheets is a valuable tool for organizations looking to manage multiple projects effectively. By offering real-time tracking, performance insights, and budget comparisons, this dashboard empowers project managers to make data-driven decisions, improve efficiency, and ensure that projects are completed on time and within budget.
Frequently Asked Questions (FAQs)
Click to buy Multiple Project Management Dashboard in Google Sheets
1. How do I enter data into the Multiple Project Management Dashboard?
Data is entered into the Data Sheet tab, where you can input project details such as name, department, budget, costs, and deadlines.
2. Can I customize the Multiple Project Management Dashboard?
Yes, the dashboard is fully customizable. You can add or remove KPIs, adjust charts, and modify the layout as needed.
3. How does the Actual Cost vs. Budget chart help?
This chart compares the actual costs incurred for each project with the planned budget, helping managers stay on top of spending and avoid overspending.
4. Can I track performance by project manager?
Yes, the Dashboard Sheet includes charts that track project performance by project manager, making it easy to evaluate individual contributions.
5. How can I monitor project status?
The Dashboard Sheet provides charts that display the status of each project, including how many projects are Completed, In Progress, or Delayed.
Visit our YouTube channel to learn step-by-step video tutorials
Youtube.com/@NeotechNavigators
Watch the step-by-step video Demo:
Click to buy Multiple Project Management Dashboard in Google Sheets