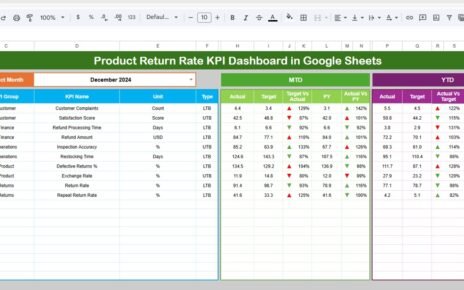
The SEO Performance KPI Dashboard in Google Sheets is a customizable spreadsheet that allows users to track, monitor, and analyze essential SEO metrics (KPIs) month-over-month and year-to-date (YTD). It presents critical data in a visual, organized way — making it easier to spot trends, track progress, and optimize SEO efforts.SEO Performance KPI Dashboard in Google Sheets
This dashboard comes with six dynamic worksheet tabs, built to simplify the tracking of actual performance, targets, previous year numbers, and overall KPI trends.SEO Performance KPI Dashboard in Google Sheets
Key features of SEO Performance KPI Dashboard in Google Sheets
Let’s dive into the heart of the dashboard — its 6 structured worksheet tabs, each designed for a unique purpose:
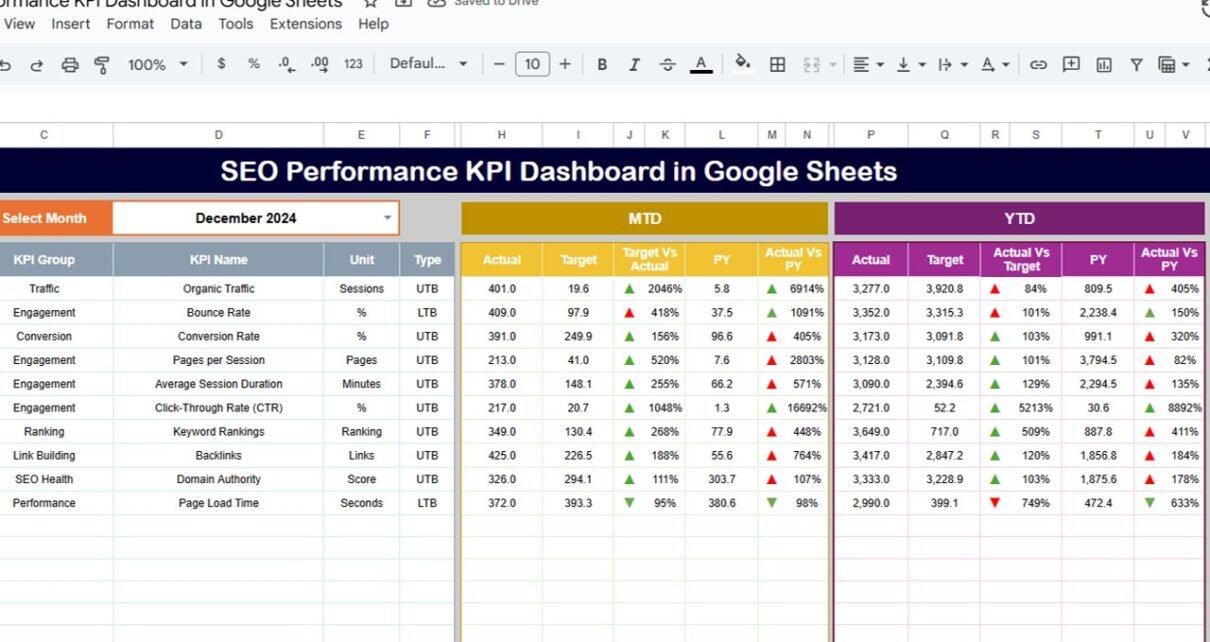
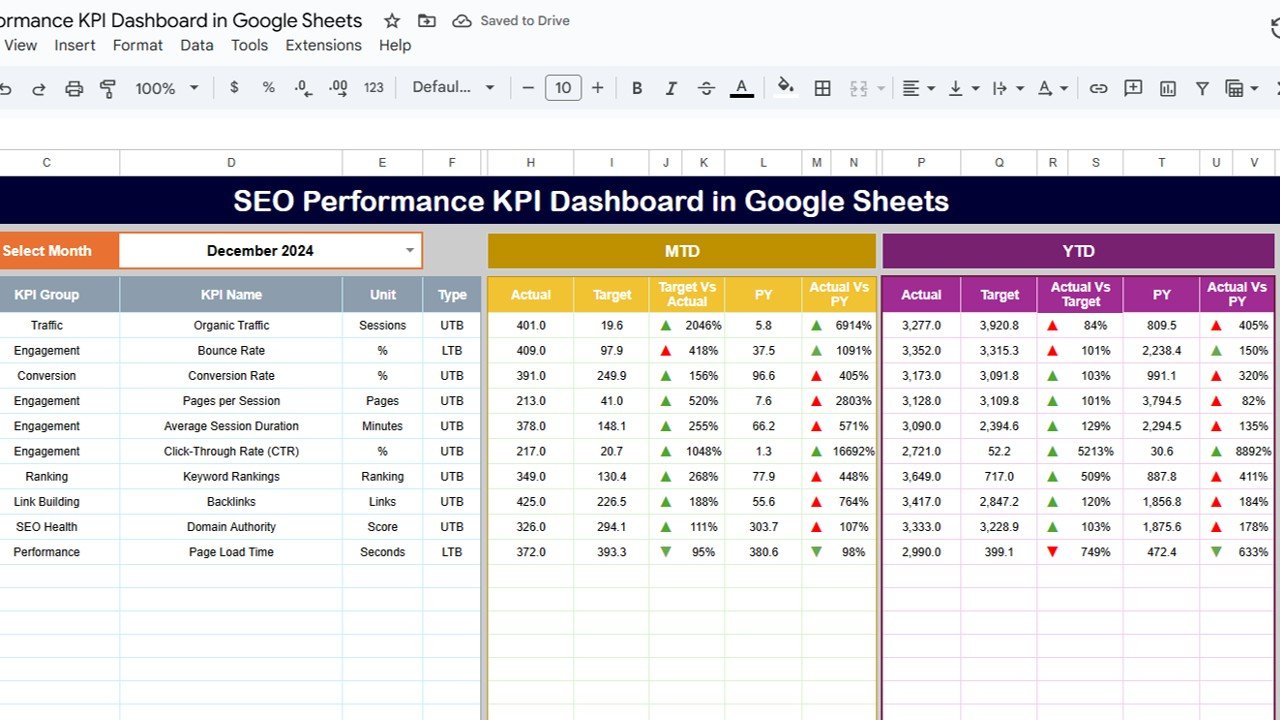
1. Dashboard Sheet Tab
This is the main view where performance is visualized.
A drop-down (Cell D3) allows users to select the month for review.
The dashboard updates automatically to reflect:
MTD (Month-to-Date) Actual vs. Target
MTD Actual vs. Previous Year
YTD (Year-to-Date) Actual vs. Target
YTD Actual vs. Previous Year
Visual up/down arrows (using conditional formatting) indicate performance.
Click to buy SEO Performance KPI Dashboard in Google Sheets
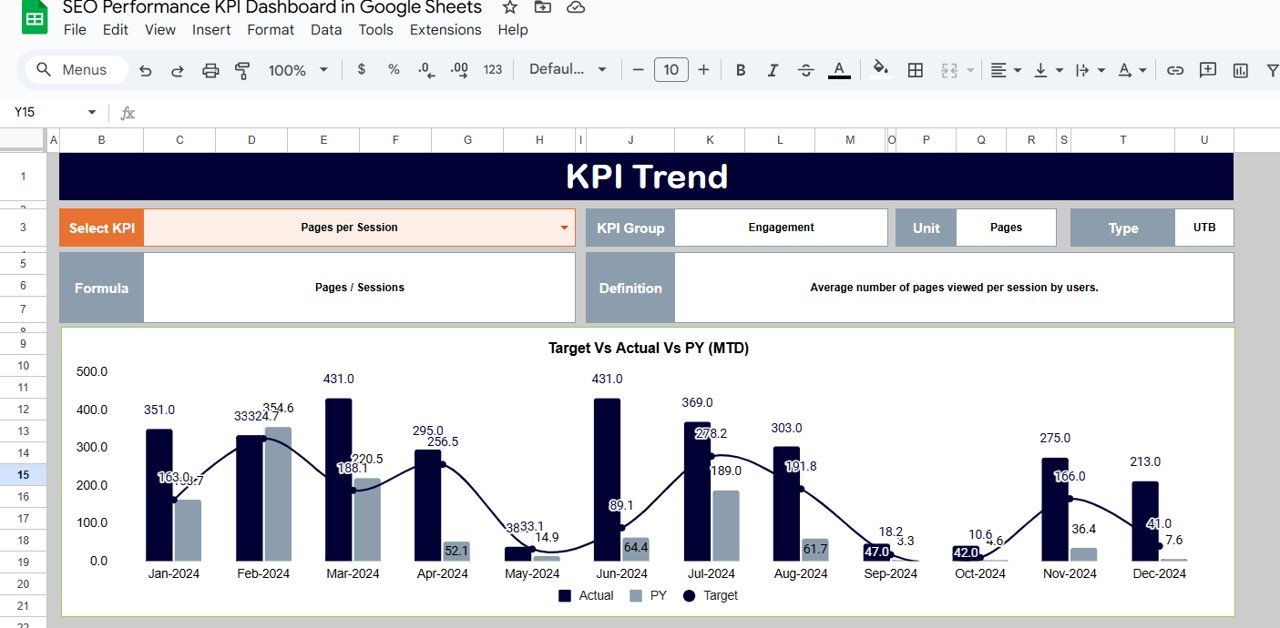
2. KPI Trend Sheet Tab
Select any KPI from a drop-down (Cell C3) to view its trend.
- KPI Group
- KPI Unit
- KPI Type (UTB or LTB)
- Formula
- Definition
Useful for historical analysis and pattern recognition.
Click to buy SEO Performance KPI Dashboard in Google Sheets
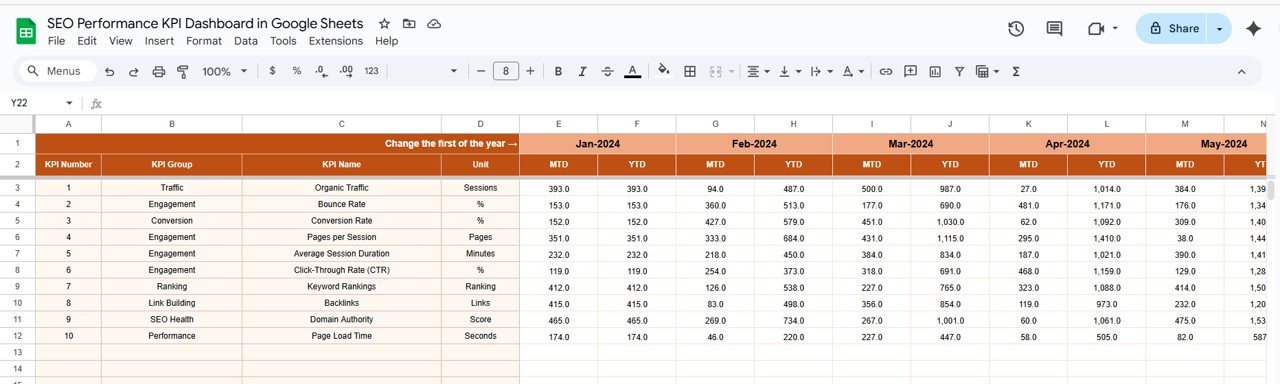
3. Actual Number Sheet Tab
-
Enter the actual KPI values here (MTD and YTD).
-
Month changes dynamically via Cell E1 (starting month of the year).
-
Supports real-time performance input.
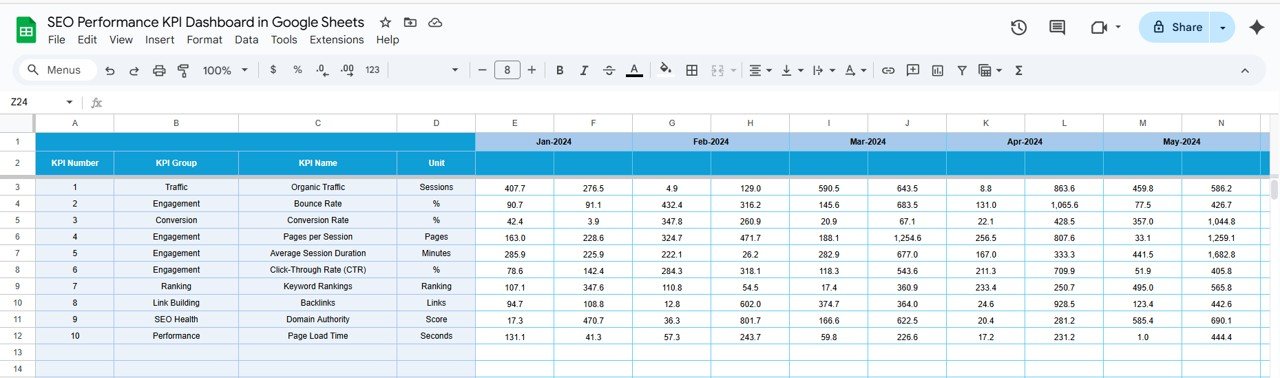
4. Target Sheet Tab
-
Define monthly MTD and YTD targets for each KPI.
-
These targets feed into the dashboard for variance analysis.
Click to buy SEO Performance KPI Dashboard in Google Sheets
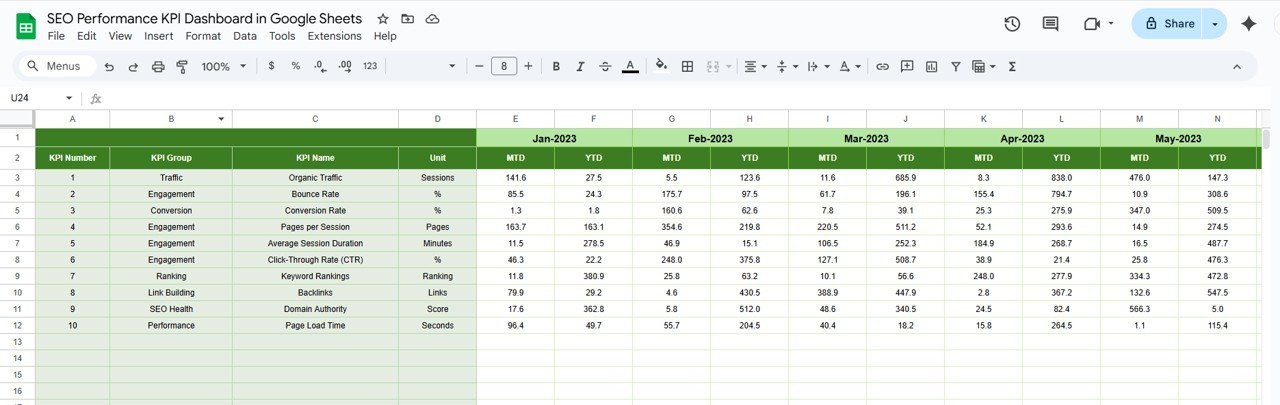
5. Previous Year Number Sheet Tab
-
Enter previous year’s actual performance for comparison.
-
Helps measure YoY (Year-over-Year) growth or decline.
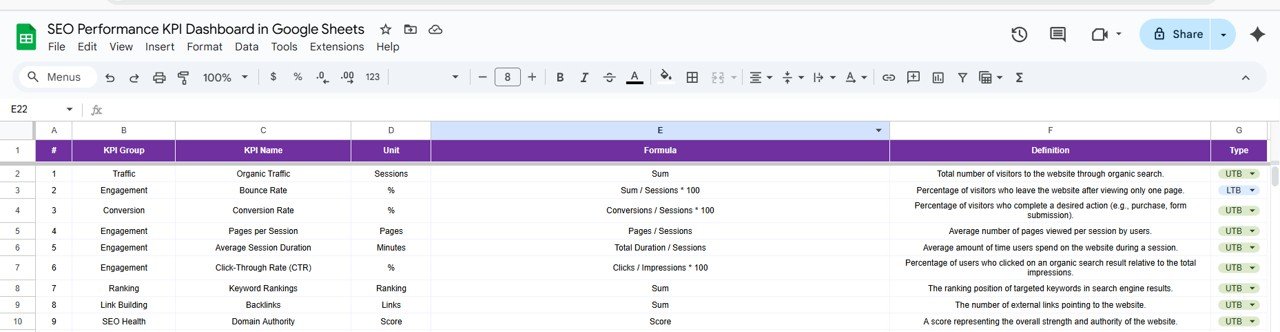
6. KPI Definition Sheet Tab
Enter full metadata for each KPI:
- KPI Name
- KPI Group
- Unit
- Formula
- Definition
- Type: LTB (Lower the Better) or UTB (Upper the Better)
Click to buy SEO Performance KPI Dashboard in Google Sheets
Advantages of SEO Performance KPI Dashboard
- Centralized SEO Monitoring: Track all your KPIs from one place. No need to switch between analytics tools and spreadsheets.
- Real-Time Data Insights: Update your performance numbers and instantly see visual changes — both MTD and YTD.
- Customizable Structure: The dashboard is fully editable. You can add, remove, or modify KPIs, targets, and formatting based on your business needs.
- Better Decision Making: With visibility into target vs. actual and YoY changes, you’ll always know what to prioritize next.
- Clear Visualization; Up/down arrows and conditional formatting make it easy to identify positive or negative trends at a glance.
- Accessible Anywhere; Being Google Sheets-based, you can access your dashboard from any device, anywhere.
Opportunities for Improvement in SEO KPI Tracking
While the dashboard is powerful, there’s always room to do better. Here’s where you can improve:
-
Automate Data Pulling: Use Google Apps Script or connectors like Supermetrics to automate the import of GA, GSC, or SEMrush data.
-
Refine KPI Selection: Not every KPI is equally valuable. Focus on KPIs that directly correlate with traffic and revenue.
-
Segment Your Data; Track KPIs by source (organic vs. paid), device (mobile vs. desktop), or location for deeper insights.
-
Add Predictive Metrics: Introduce forecasting using historical data to prepare for upcoming trends.
-
Schedule Regular Reviews; Set a weekly or monthly review process to ensure your KPIs stay aligned with goals.
est Practices for Using the SEO Performance KPI Dashboard
Click to buy SEO Performance KPI Dashboard in Google Sheets
To get the most out of your dashboard, follow these proven practices:
Keep Your KPI List Focused: Don’t overcomplicate. Stick to 10–15 metrics that matter.
Update Consistently; Update your actuals monthly. Consistency is key to reliable insights.
Visualize Variance: Highlight key variances using conditional formatting, arrows, or colored backgrounds.
Use Filters and Slicers: Enable slicers for months, KPI types, or traffic segments to make analysis flexible.
Conclusion
The SEO Performance KPI Dashboard in Google Sheets is more than a spreadsheet — it’s your digital command center. Whether you’re tracking organic traffic, keyword performance, or conversions, this tool makes your SEO data actionable and easy to understand.SEO Performance KPI Dashboard in Google Sheets
By following best practices, optimizing for improvement areas, and aligning KPIs with your goals, you’ll drive more value from your SEO strategy every month.SEO Performance KPI Dashboard in Google Sheets
So, don’t just track your progress — manage it smartly. With this dashboard in place, your path to better rankings, more traffic, and higher conversions becomes clearer than ever.SEO Performance KPI Dashboard in Google Sheets
Click to buy SEO Performance KPI Dashboard in Google Sheets
Frequently Asked Questions (FAQs)
1. What are SEO KPIs?
SEO KPIs (Key Performance Indicators) are measurable values that help you track the effectiveness of your search engine optimization efforts. Examples include organic traffic, bounce rate, and keyword rankings.
2. Can I customize the dashboard KPIs?
Yes! You can add, edit, or remove any KPI in the definition sheet, and the rest of the dashboard will update accordingly.
3. Is this dashboard suitable for agencies?
Absolutely. Agencies can use this for multiple clients by creating separate sheets or files for each campaign.
4. How often should I update the dashboard?
Ideally, update it once a month for MTD and YTD performance. Weekly updates can also help with tactical adjustments.
5. What tools do I need to pull the data?
Use Google Analytics, Search Console, Ahrefs, SEMrush, or other SEO platforms. For automation, consider Google Apps Script or third-party connectors like Supermetrics.
6. Can this dashboard be shared with my team?
Yes. As it’s built in Google Sheets, you can easily share it via email or a link, and set viewing or editing permissions.
7. How is this better than using Google Data Studio?
While Data Studio is great for live dashboards, this sheet gives you manual control, better customization, and a deeper ability to manage formulas, logic, and backup data.SEO Performance KPI Dashboard in Google Sheets
Visit our YouTube channel to learn step-by-step video tutorials
Youtube.com/@NeotechNavigators
Watch the step-by-step video Demo: