Managing inventory efficiently is vital for any business to avoid stockouts, reduce holding costs, and streamline operations. The Inventory Management Dashboard in Google Sheets offers a ready-to-use solution to monitor your stock levels, values, and reorder status with ease.Inventory Management Dashboard in Google Sheets
This article explains the features and functionalities of this dashboard, designed to help you stay on top of your inventory management through clear insights and actionable data.Inventory Management Dashboard in Google Sheets
Key Features of the Inventory Management Dashboard in Google Sheets
Click to buy Inventory Management Dashboard in Google Sheets
This dashboard is organized into three main sheet tabs to provide comprehensive visibility of your inventory data:
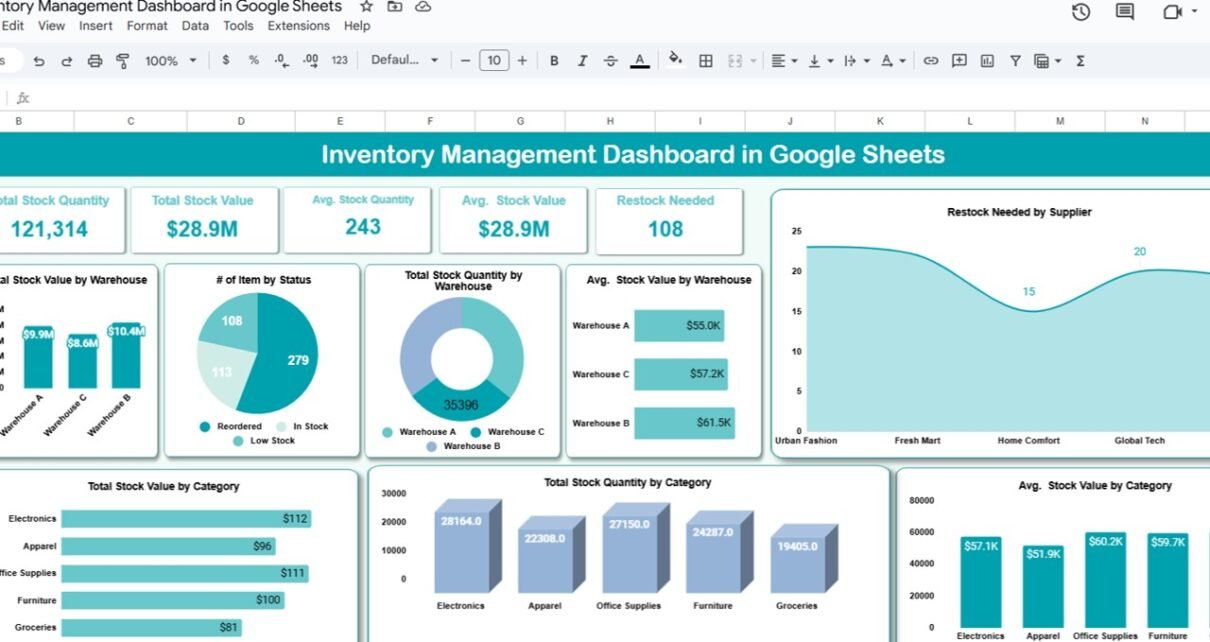
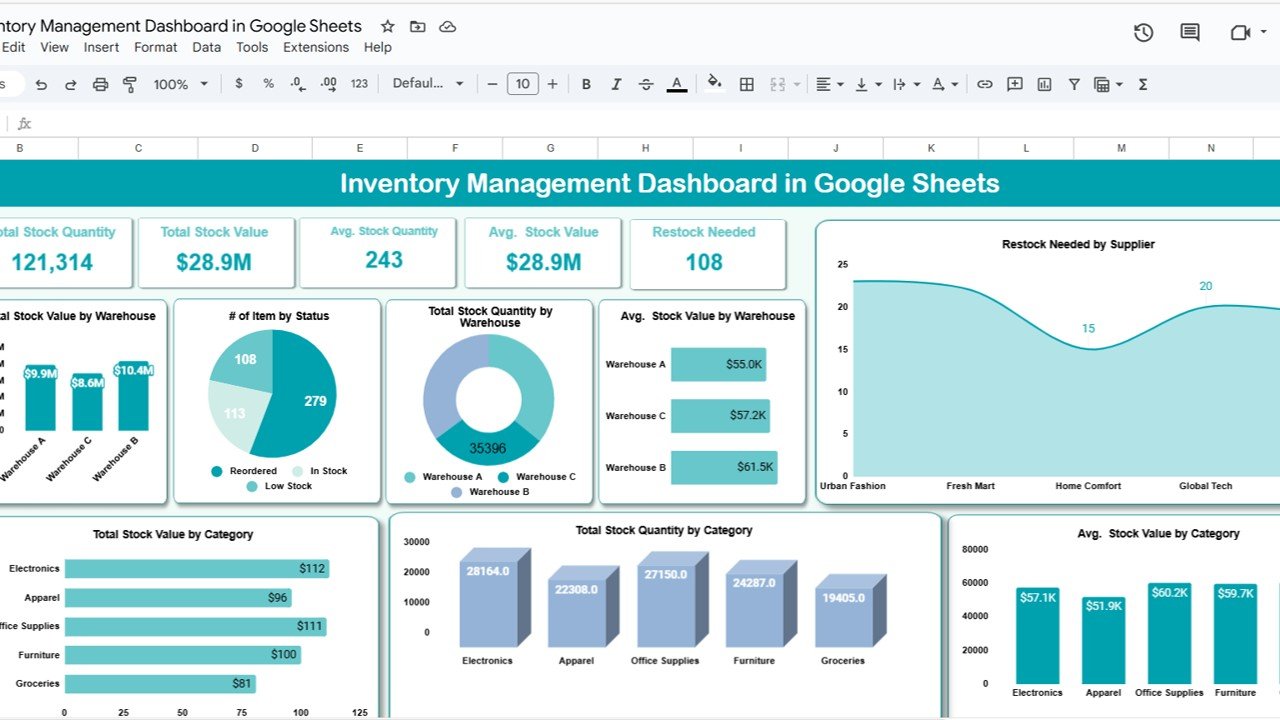
1. Dashboard Sheet Tab: Overview and Analysis
The Dashboard tab serves as the central hub with key metrics and visualizations:
Cards (Key Metrics):
-
Total Stock Quantity: The sum of all stock units currently available.
-
Total Stock Value: The total monetary value of all inventory on hand.
-
Average Stock Quantity: The average quantity per product/item.
-
Average Stock Value: The average value per product/item.
-
Restock Needed: Number of items flagged as needing restock (below reorder level).
Charts (Visual Insights):
-
Total Stock Value by Warehouse: See which warehouses hold the most inventory value.
-
Number of Items by Status: Visualize items marked as “In Stock,” “Low Stock,” or “Out of Stock.”
-
Total Stock Quantity by Warehouse: Track stock volumes by warehouse location.
-
Average Stock Value by Warehouse: Understand value distribution across warehouses.
-
Restock Needed by Supplier: Identify suppliers with the most items needing restocking.
-
Total Stock Value by Category: View inventory value segmented by product categories.
-
Total Stock Quantity by Category: Understand quantity distribution across categories.
-
Average Stock Value by Category: Track average stock value for each category.
Click to buy Inventory Management Dashboard in Google Sheets
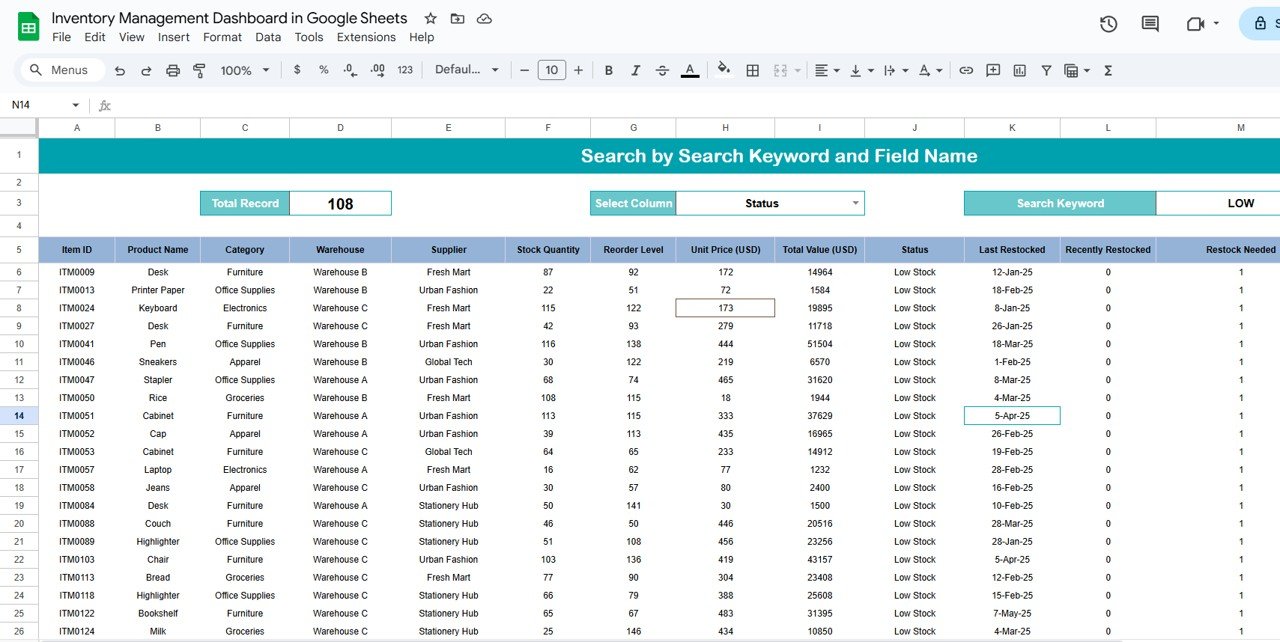
2. Search Sheet Tab: Quick Data Lookup
This sheet offers a dynamic search functionality to filter and find inventory data quickly based on:
-
Search Keyword: Enter specific terms or numbers related to product names, statuses, warehouses, or suppliers.
-
Field/Column Selector: Choose which column to search in, such as “Status,” “Product Name,” or “Supplier.”
This feature helps inventory managers swiftly locate critical information without scrolling through large datasets.Inventory Management Dashboard in Google Sheets
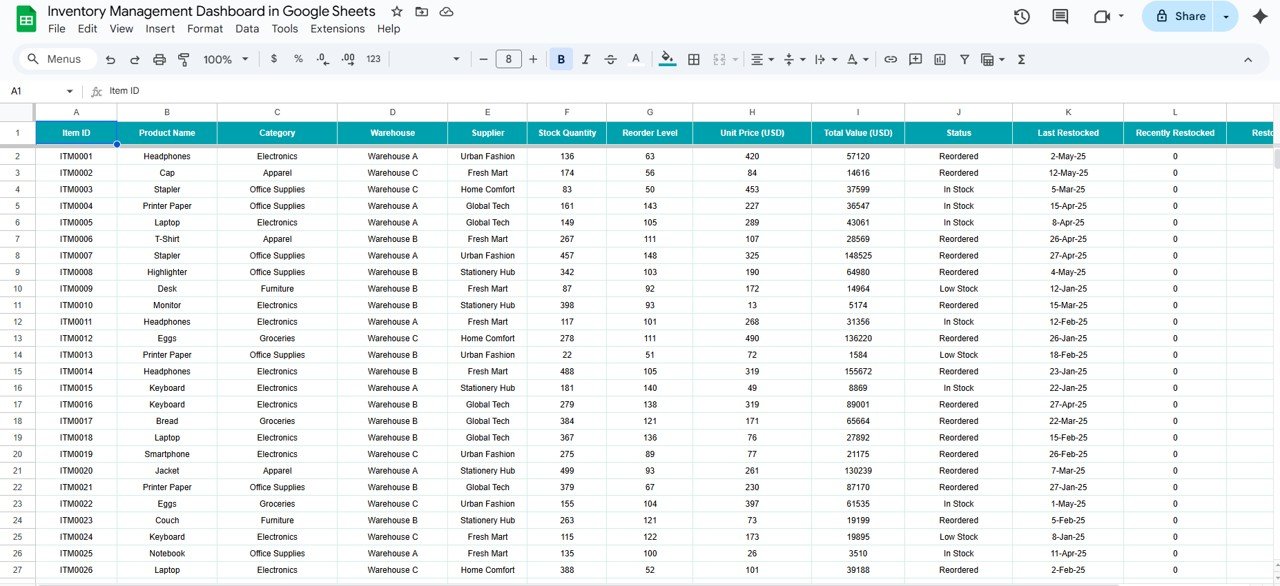
3. Data Sheet Tab: Inventory Data Input
The Data sheet is where you input and maintain all your inventory records. Key columns include:
Click to buy Inventory Management Dashboard in Google Sheets
How to Use the Inventory Management Dashboard
-
Data Input: Enter or update your inventory data in the Data Sheet regularly to keep information current.
-
Monitor KPIs: Use the Dashboard Sheet to track stock quantities, values, and restock needs through the cards and charts.
-
Search Efficiently: Utilize the Search Sheet to quickly find items by status, supplier, or category.
-
Make Decisions: Analyze restock alerts and warehouse performance to optimize your inventory ordering and management.
-
Track Trends: Use category and warehouse charts to identify trends and potential inventory risks.
Advantages of the Inventory Management Dashboard in Google Sheets
Click to buy Inventory Management Dashboard in Google Sheets
-
User-Friendly Interface: Simple layout that is easy to understand and operate.
-
Real-Time Data Update: Instant updates in dashboard visuals when you update the data sheet.
-
Cost-Effective: Leverages Google Sheets, a free tool, avoiding expensive software.
-
Accessible Anywhere: Cloud-based solution accessible from any device with internet.
-
Customizable: Easily modify columns, charts, or KPIs to suit your business needs.
-
Enhanced Decision-Making: Visual insights enable quick decisions on stock levels and procurement.
Best Practices for Using the Inventory Management Dashboard
-
Regular Data Entry: Keep the Data Sheet up to date daily or weekly to maintain accuracy.
-
Set Reorder Levels Thoughtfully: Adjust reorder levels based on historical sales data and supplier lead times.
-
Review Dashboard Metrics Weekly: Monitor key metrics regularly to avoid stockouts or overstocking.
-
Utilize Search Feature Often: Quickly respond to inventory queries using the Search Sheet.
-
Backup Your Data: Periodically export your Google Sheet or use version history to avoid data loss.
-
Train Your Team: Ensure staff using the dashboard understand how to input data and interpret metrics.
Frequently Asked Questions (FAQs)
Click to buy Inventory Management Dashboard in Google Sheets
Q1: Can I customize the dashboard to include my own KPIs?
A1: Yes, Google Sheets dashboards are highly customizable. You can add or modify KPIs by updating the data input sheet and adjusting formulas and charts accordingly.
Q2: How often should I update the inventory data?
A2: Ideally, update your inventory data daily or at least weekly to ensure the dashboard reflects accurate and timely information.
Q3: Can I share this dashboard with my team?
A3: Yes, Google Sheets allows you to share your dashboard with team members and set permissions for editing or viewing.
Q4: Is this dashboard suitable for large inventories?
A4: While Google Sheets is versatile, very large datasets might slow down performance. For very large inventories, consider specialized software or Power BI dashboards.
Q5: How does the dashboard identify items that need restocking?
A5: The dashboard flags items where the current stock quantity falls below the reorder level, marking them as “Restock Needed.”
Visit our YouTube channel to learn step-by-step video tutorials
Youtube.com/@NeotechNavigators
Click to buy Inventory Management Dashboard in Google Sheets