Running a CrossFit gym involves managing memberships, class attendance, trainer performance, and financial metrics. The CrossFit Gym KPI Dashboard in Google Sheets provides a ready-to-use tool to monitor all critical performance indicators, track trends, and make data-driven decisions.
In this article, we will explain the dashboard features, advantages, best practices, and frequently asked questions.
What Is a CrossFit Gym KPI Dashboard?
A CrossFit Gym KPI Dashboard is a digital tool that consolidates key metrics into a single Google Sheets file, allowing gym owners and managers to:
-
Track monthly and yearly performance (MTD & YTD)
-
Compare actual numbers with targets and previous year data
-
Monitor trends across different KPIs
-
Optimize operations, memberships, and revenue
The dashboard provides visual insights for gym operations and allows for easy collaboration among managers and staff.
Key Features of the CrossFit Gym KPI Dashboard
Click to Buy CrossFit Gym KPI Dashboard in Google Sheets
This dashboard contains 6 worksheets, each designed for specific tracking and analysis:
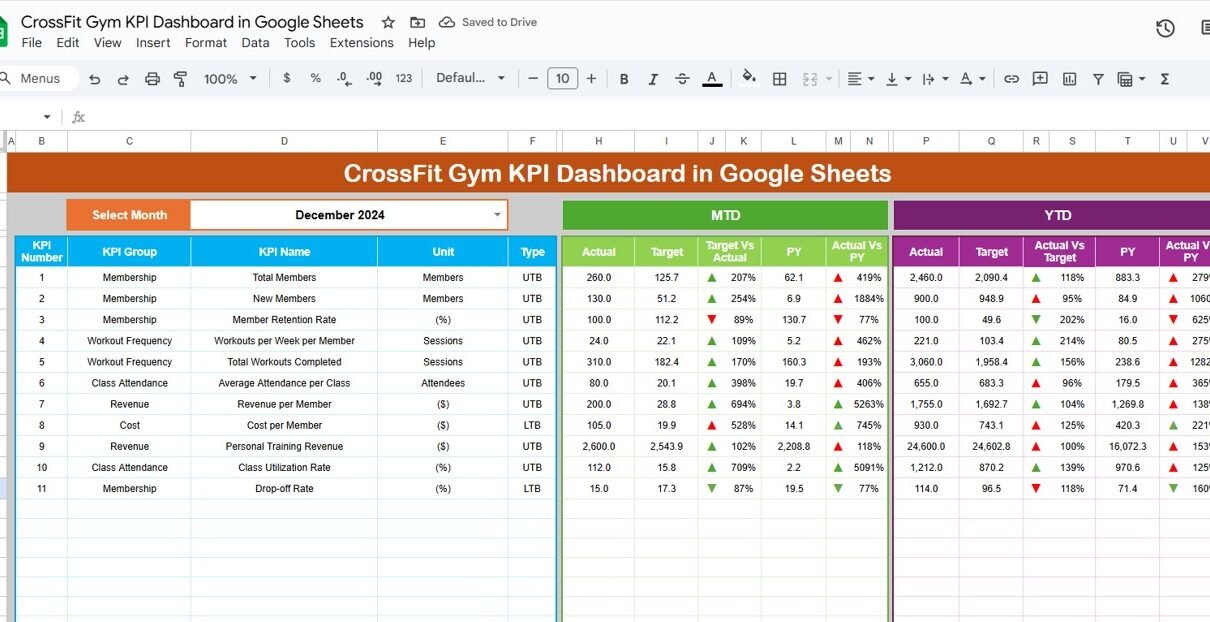
1. Dashboard Sheet Tab
The Dashboard Sheet is the main page for monitoring all KPIs:
-
Month Selection (Range D3): Update the dashboard dynamically for any month
-
MTD Metrics: Actual, target, and previous year values with conditional formatting (up/down arrows)
-
YTD Metrics: Track cumulative performance for the year with similar visual indicators
This sheet provides a high-level overview of gym operations and member performance.

Click to Buy CrossFit Gym KPI Dashboard in Google Sheets
2. KPI Trend Sheet Tab
The KPI Trend Sheet allows deep-dive analysis for individual metrics:
-
Select a KPI from the dropdown in Range C3
-
View KPI Group, Unit, and Type (Lower-the-Better or Upper-the-Better)
-
Check KPI Formula and Definition
-
Visualize trends over time to identify areas needing improvement

3. Actual Number Sheet Tab
-
Enter actual numbers for MTD and YTD for each KPI
-
Select the first month of the year in Range E1 to adjust calculations automatically
This ensures the dashboard reflects real-time performance accurately.

Click to Buy CrossFit Gym KPI Dashboard in Google Sheets
4. Target Sheet Tab
-
Enter monthly and yearly targets for each KPI
-
Track whether gym operations are meeting goals and objectives

5. Previous Year Numbers Sheet Tab
-
Input last year’s KPI numbers for comparison
-
Allows year-over-year trend analysis and performance benchmarking

Click to Buy CrossFit Gym KPI Dashboard in Google Sheets
6. KPI Definition Sheet Tab
-
Document KPI Name, KPI Group, Unit, Formula, Definition, and Type (Upper/Lower-the-Better)
-
Ensures clarity and consistency in measurement and reporting

Advantages of Using the CrossFit Gym KPI Dashboard
-
Centralized Tracking: Monitor all KPIs in one Google Sheet
-
Real-Time Insights: Update actual numbers to see immediate impact on dashboards
-
Visual Analysis: Conditional formatting and trend charts provide actionable insights
-
Identify Performance Gaps: Track underperforming trainers, classes, or membership programs
-
Data-Driven Decisions: Allocate resources and plan marketing campaigns effectively
-
Customizable: Add or adjust KPIs to align with your gym’s unique goals
Best Practices for Using the Dashboard
Click to Buy CrossFit Gym KPI Dashboard in Google Sheets
-
Update Actual Data Regularly: Ensure accurate MTD and YTD tracking
-
Set Realistic Targets: Define measurable goals for each KPI
-
Analyze Trends: Use KPI Trend Sheet to spot growth opportunities and underperforming areas
-
Segment Data: Track KPIs by trainer, class type, or membership plan
-
Review Monthly: Monitor progress and make adjustments to marketing, retention, and operations
How This Dashboard Helps Gym Owners
-
Track Membership Growth: Monitor new sign-ups and retention rates
-
Evaluate Class Attendance: Identify popular classes and peak times
-
Assess Trainer Performance: Track feedback and success metrics
-
Optimize Revenue: Monitor revenue per member and operational costs
-
Make Strategic Decisions: Use data to improve marketing, scheduling, and retention initiatives
Frequently Asked Questions (FAQs)
Click to Buy CrossFit Gym KPI Dashboard in Google Sheets
Q1: Can I add more KPIs to this dashboard?
Yes, you can customize the KPI Definition sheet and update other sheets to track additional metrics.
Q2: How often should data be updated?
Monthly updates are ideal, but weekly updates provide more precise tracking for active gyms.
Q3: Can I track class attendance and membership separately?
Yes, you can segment KPIs by class type, membership plan, or trainer for detailed analysis.
Q4: Does the dashboard support trend analysis?
Yes, the KPI Trend sheet visualizes MTD and YTD trends over time for each metric.
Q5: Is this dashboard suitable for multiple gym locations?
Yes, you can create separate tabs for each location or include a location column in your data for filtering.
Conclusion
Click to Buy CrossFit Gym KPI Dashboard in Google Sheets
The CrossFit Gym KPI Dashboard in Google Sheets provides a comprehensive, interactive way to monitor gym performance, track memberships, assess trainer performance, and optimize operations. With real-time MTD and YTD tracking, trend analysis, and clear KPI definitions, gym managers can make data-driven decisions to improve performance, retention, and profitability.
Visit our YouTube channel to learn step-by-step video tutorials