Wildlife conservation is one of the most critical global priorities today. From protecting endangered species to restoring habitats, organizations, governments, and NGOs must track progress and measure outcomes with precision. However, managing scattered reports or spreadsheets often creates inefficiencies. That is why a Wildlife Conservation KPI Dashboard in Google Sheets can make a huge difference.
This ready-to-use template provides a structured, visual, and interactive way to measure key performance indicators (KPIs) related to conservation efforts. Instead of relying on lengthy reports, users can instantly view data trends, compare targets with actual achievements, and identify areas that need urgent attention.Wildlife Conservation KPI Dashboard in Google Sheets
In this article, we will explore:
- What the Wildlife Conservation KPI Dashboard in Google Sheets is.
- The structure of the dashboard and its six worksheet tabs.
- Advantages of using this tool for conservation management.
- Best practices for setting up and maintaining the dashboard.
- Real-world use cases.
- Frequently asked questions to guide new users.Wildlife Conservation KPI Dashboard in Google Sheets
Click to buy Wildlife Conservation KPI Dashboard in Google Sheets
By the end, you’ll see why this dashboard is an invaluable tool for wildlife organizations, researchers, and policymakers.
What Is a Wildlife Conservation KPI Dashboard in Google Sheets?
A Wildlife Conservation KPI Dashboard in Google Sheets is a digital tool designed to track, analyze, and visualize important conservation metrics. It consolidates all KPIs into one centralized platform, allowing teams to measure progress toward targets, monitor trends, and make informed decisions.
Unlike static reports, this dashboard updates dynamically based on user input. Whether it’s tracking species population trends, habitat restoration targets, or funding utilization, the dashboard ensures data is presented in an easy-to-read and interactive format.
With its Google Sheets base, the dashboard is:
- Cloud-based: Access it anytime, anywhere.
- Collaborative: Share with multiple stakeholders in real time.
- Customizable: Add or modify KPIs to fit your specific project needs.
Structure of the Wildlife Conservation KPI Dashboard
The dashboard includes six worksheets, each with a unique role. Let’s break them down:
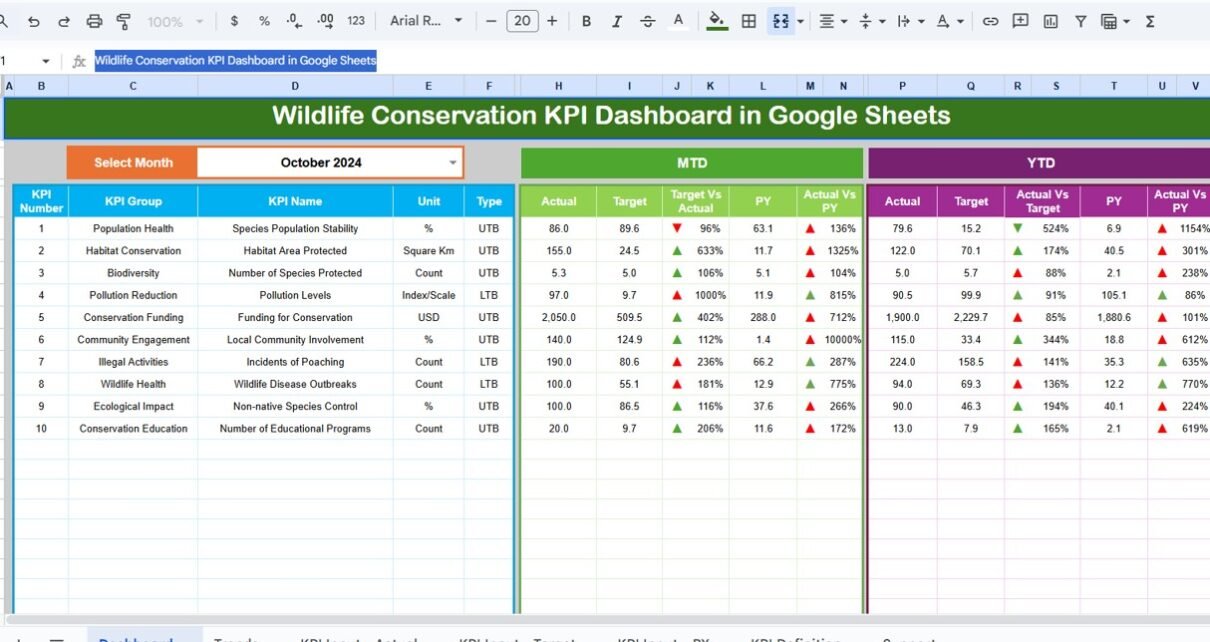
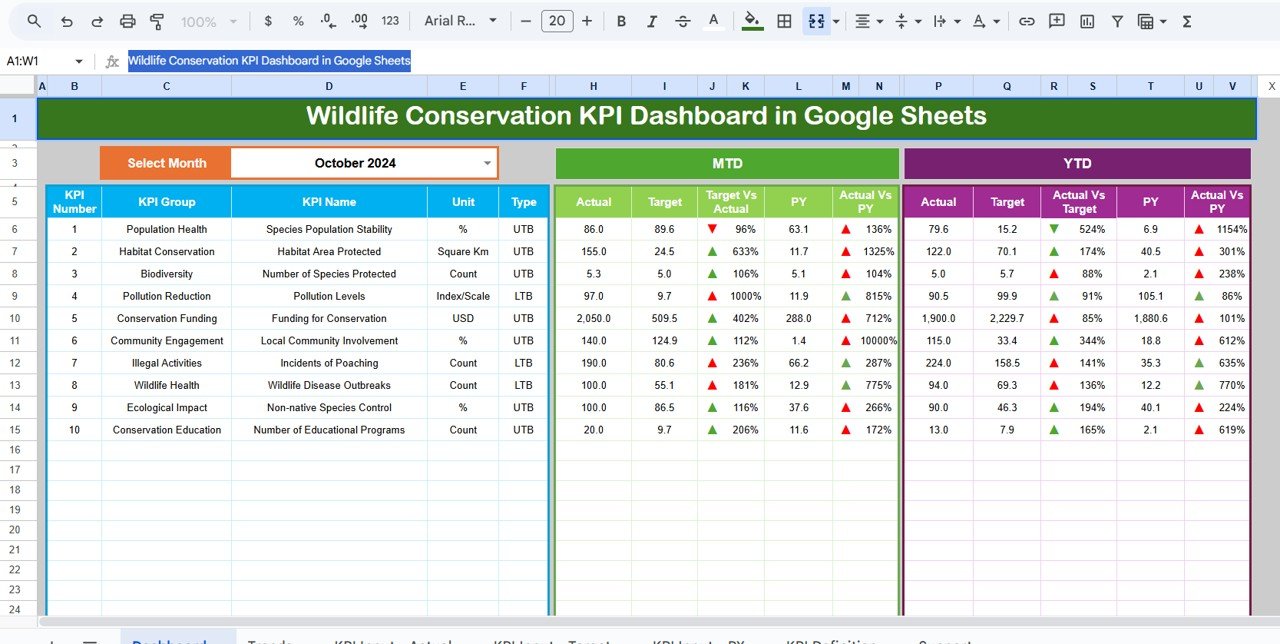
Dashboard Sheet Tab
This is the main control panel of the entire system.
- A drop-down menu in range D3 allows users to select a specific month.
- Once selected, the dashboard automatically refreshes to display metrics for that period.
- It shows:
- MTD (Month-to-Date) actual, target, and previous year (PY) data.
- YTD (Year-to-Date) actual, target, and PY data.
- Target vs. Actual and PY vs. Actual comparisons.
- Conditional formatting with up/down arrows highlights whether performance improved or declined.
Click to buy Wildlife Conservation KPI Dashboard in Google Sheets
This sheet gives stakeholders a bird’s-eye view of conservation progress at a glance.
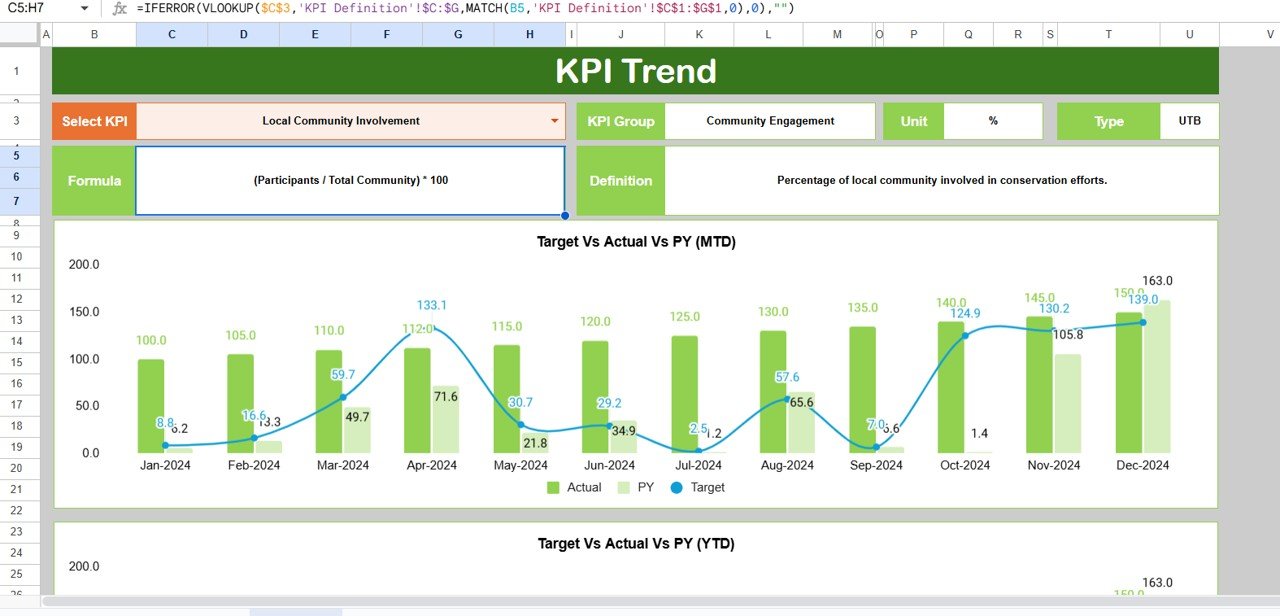
Trend Sheet Tab
The Trend tab allows in-depth analysis of KPIs over time.
- A drop-down in range C3 lets users select a specific KPI.
- It displays:
- KPI Group (e.g., Biodiversity, Funding, Habitat).
- Unit of KPI (e.g., % growth, count, hectares).
- Type of KPI (LTB – Lower the Better or UTB – Upper the Better).
- Formula used to calculate the KPI.
- Definition for clarity.
- Trend charts display MTD and YTD comparisons for Actual, Target, and PY values.
Click to buy Wildlife Conservation KPI Dashboard in Google Sheets
This helps conservationists identify seasonal patterns, progress gaps, and long-term trends.Wildlife Conservation KPI Dashboard in Google Sheets
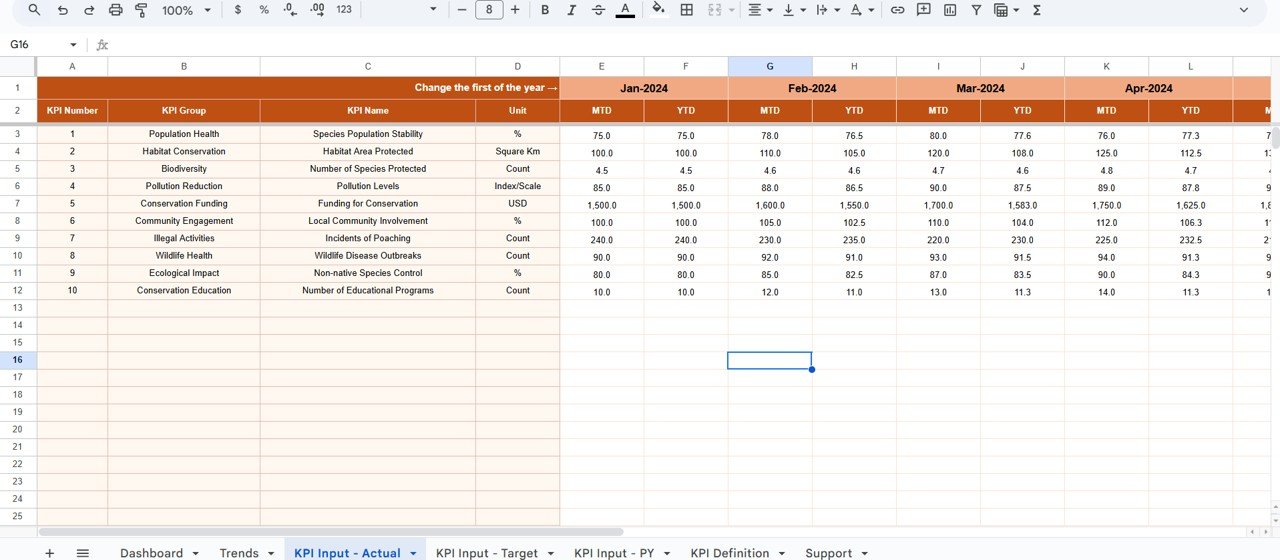
Actual Numbers Input Sheet
This is where raw data entry takes place.
- Users input actual KPI values for both MTD and YTD.
- The E1 range allows users to set the starting month of the year.
- Data entered here automatically feeds into the dashboard, ensuring accuracy and consistency.
This sheet ensures that real-world data aligns with reported outcomes.
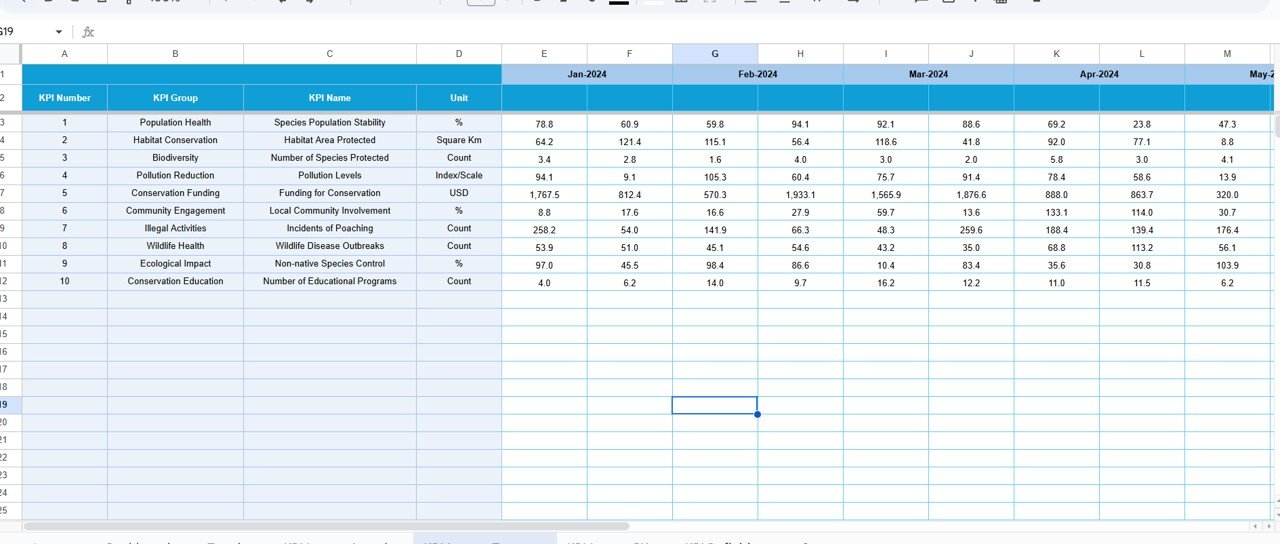
Target Sheet Tab
Conservation efforts always require measurable targets.
- This tab allows entry of monthly and yearly KPI targets.
- Both MTD and YTD values can be specified.
- Targets serve as a benchmark for comparison against actual achievements.
It helps managers answer: Are we on track to achieve our wildlife conservation goals?
Click to buy Wildlife Conservation KPI Dashboard in Google Sheets
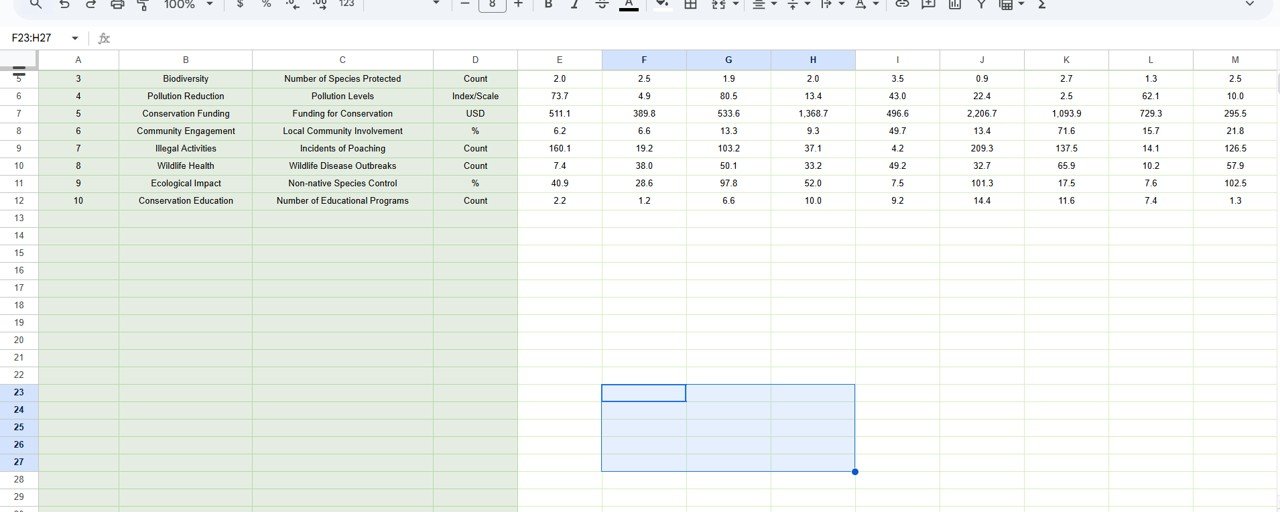
Previous Year Numbers Sheet
Tracking progress requires context.
- This sheet stores KPI data from the previous year.
- Just like actual and target values, it covers MTD and YTD numbers.
- By comparing with last year, organizations can measure growth, decline, or stability.
This feature provides historical insight, ensuring decisions are based on evidence rather than assumptions.
KPI Definition Sheet Tab
Clarity is essential when tracking conservation data.
- This sheet records:
- KPI Name.
- KPI Group.
- Unit.
- Formula.
- Definition.
- It acts as a reference library, ensuring every team member interprets KPIs consistently.
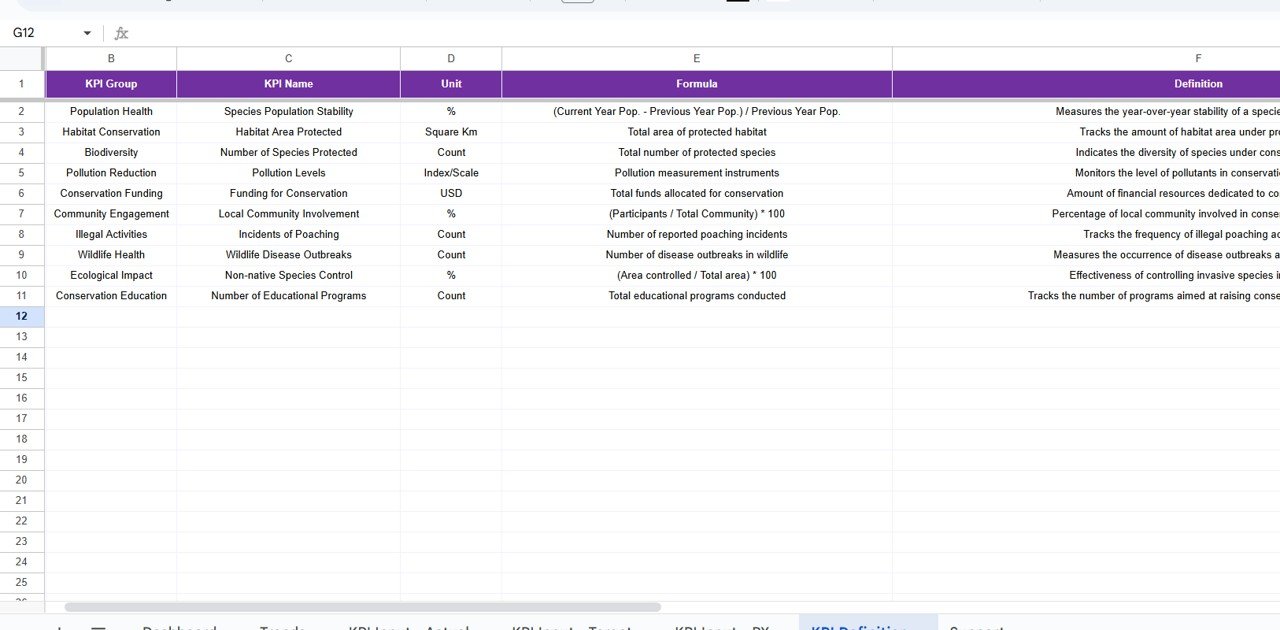
By standardizing definitions, organizations avoid miscommunication or misinterpretation of performance results.
Advantages of a Wildlife Conservation KPI Dashboard
Using this dashboard offers several benefits:
- Centralized Data: All KPIs in one place.
- Real-Time Updates: Changes reflect instantly.
- Collaboration: Multiple stakeholders can work together.
- Clarity and Transparency: Easy-to-read visuals with arrows and charts.
- Goal Alignment: Compare actual results with targets.
- Evidence-Based Decisions: Historical trends guide future strategies.
- Flexibility: Add, remove, or modify KPIs based on project needs.
Best Practices for Wildlife Conservation KPI Dashboards
To get the most out of your dashboard:
- Define Clear KPIs: Ensure each KPI has a specific purpose and formula.
- Update Data Regularly: Input actual numbers consistently.
- Set Realistic Targets: Use past trends and expert input.
- Leverage Conditional Formatting: Highlight critical changes.
- Encourage Team Use: Train staff to use and interpret dashboard data.
- Review KPIs Annually: Modify or add new KPIs as conservation needs evolve.
Real-World Use Cases
- NGOs: Track endangered species recovery.
- Governments: Monitor national wildlife reserves and habitats.
- Research Institutions: Measure biodiversity changes over time.
- Community Programs: Evaluate the impact of awareness campaigns.
- Donors & Sponsors: Assess funding utilization and conservation ROI.
Conclusion
Wildlife conservation requires precision, consistency, and accountability. With the Wildlife Conservation KPI Dashboard in Google Sheets, organizations gain a powerful tool to monitor, analyze, and improve conservation efforts. By centralizing data, enabling comparisons, and offering trend insights, this dashboard ensures better decision-making and stronger results for global biodiversity protection.
Frequently Asked Questions (FAQs)
- What is a Wildlife Conservation KPI Dashboard?
It is a Google Sheets-based tool designed to track, measure, and visualize key conservation performance indicators.
- Can I customize the KPIs in the dashboard?
Yes, you can add or edit KPIs in the KPI Definition sheet to fit your project needs.
- Who can use this dashboard?
Wildlife NGOs, government agencies, researchers, community projects, and donors.
- How often should I update the dashboard?
It is best to update it monthly for accuracy, though weekly or quarterly updates are also possible.
- Does this dashboard work offline?
Yes, Google Sheets has an offline mode, but full collaboration requires an internet connection.
- Why compare with the previous year?
It helps identify whether conservation outcomes are improving or declining over time.
- Is this dashboard suitable for small projects?
Yes, it can scale from small local initiatives to large national programs.
Visit our YouTube channel to learn step-by-step video tutorials
Youtube.com/@NeotechNavigators
Watch the step-by-step video tutorial:
Click to buy Wildlife Conservation KPI Dashboard in Google Sheets