Managing energy consumption is a key part of reducing operational costs and supporting sustainability initiatives. The Office Energy Consumption Dashboard in Google Sheets provides a ready-to-use solution to monitor energy usage, track costs, and evaluate efficiency across departments and locations.Office Energy Consumption Dashboard in Google Sheets
In this article, we will explain the features, benefits, and best practices for using this dashboard to optimize office energy consumption.Office Energy Consumption Dashboard in Google Sheets
What Is an Office Energy Consumption Dashboard?
An Office Energy Consumption Dashboard is a visual and interactive tool that consolidates energy usage and cost data in a single Google Sheet. It enables facility managers, sustainability teams, and finance departments to:
-
Track energy consumption (kWh) and costs (USD)
-
Evaluate efficiency and sustainability ratings
-
Monitor trends by department, office location, or energy source
-
Make data-driven decisions to reduce costs and improve energy efficiency
Key Features of the Dashboard
This dashboard includes three main sheets:
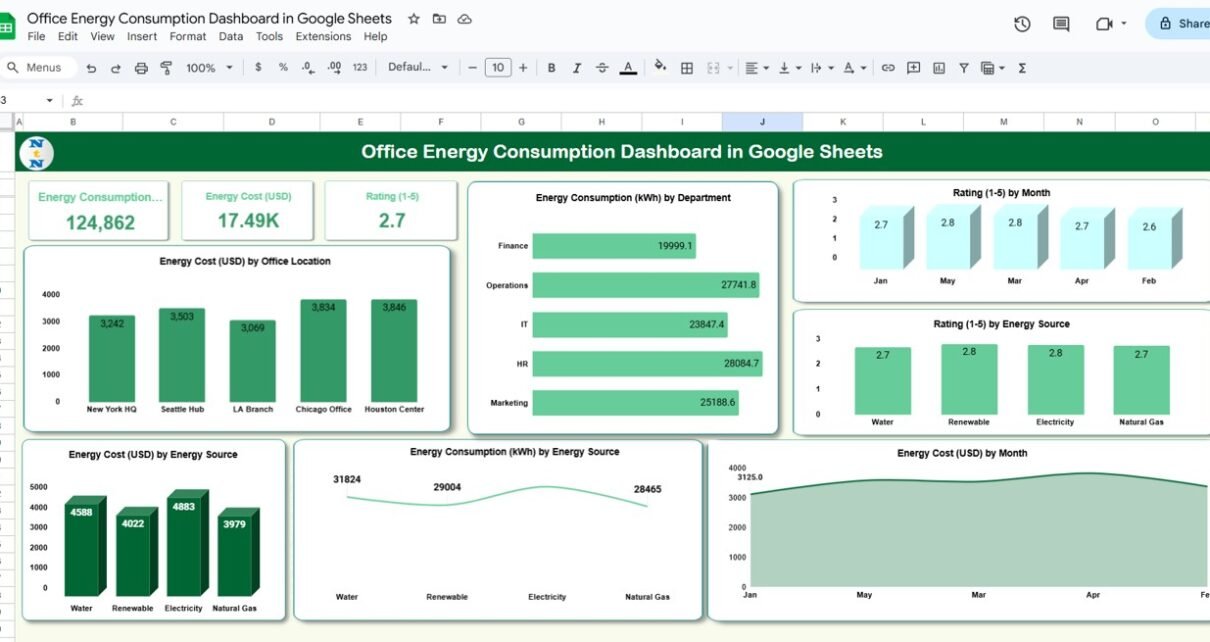
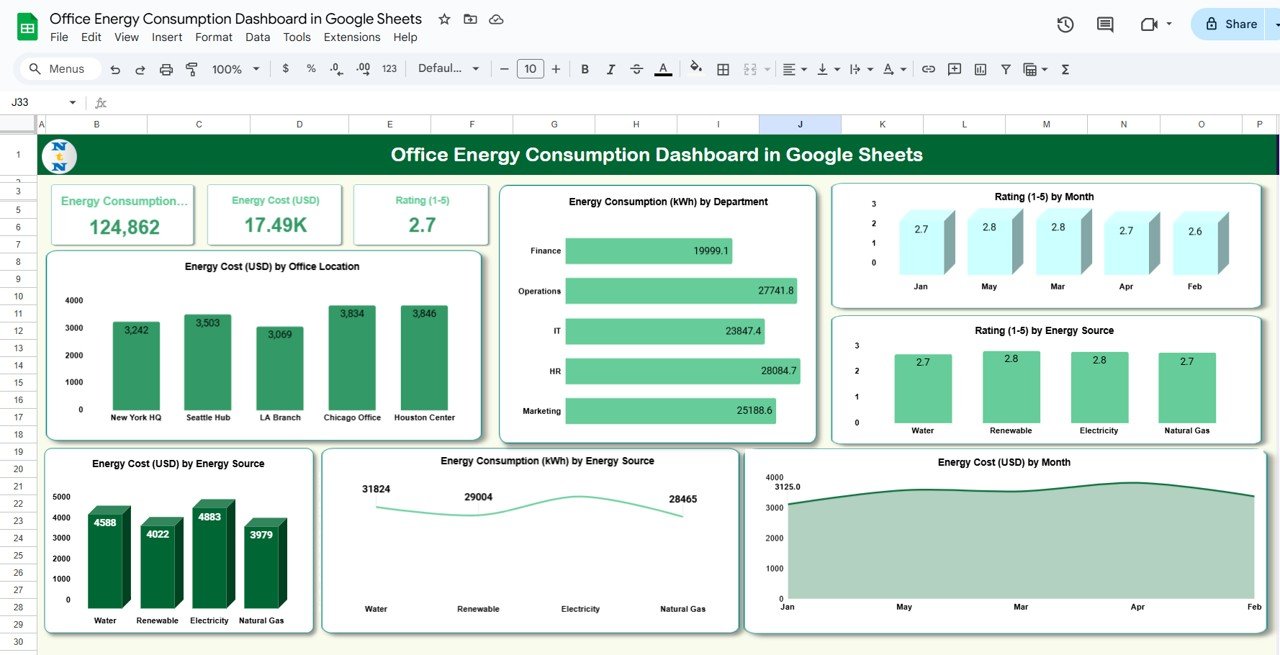
1. Dashboard Sheet Tab
The Dashboard sheet provides a high-level overview using cards and charts:
Cards:
-
Energy Consumption (kWh): Total energy used
-
Energy Cost (USD): Total cost of energy consumption
-
Rating (1-5): Efficiency or sustainability rating
Charts:
-
Energy Cost by Office Location: Compare costs across different offices
-
Energy Consumption by Department: Visualize departmental energy usage
-
Rating by Month: Track efficiency rating trends over time
-
Rating by Energy Source: Compare performance across electricity, gas, solar, etc.
-
Energy Cost by Month: Monitor monthly energy spending
-
Energy Consumption by Energy Source: Understand which sources consume the most energy
-
Energy Cost by Energy Source: Identify costly energy sources
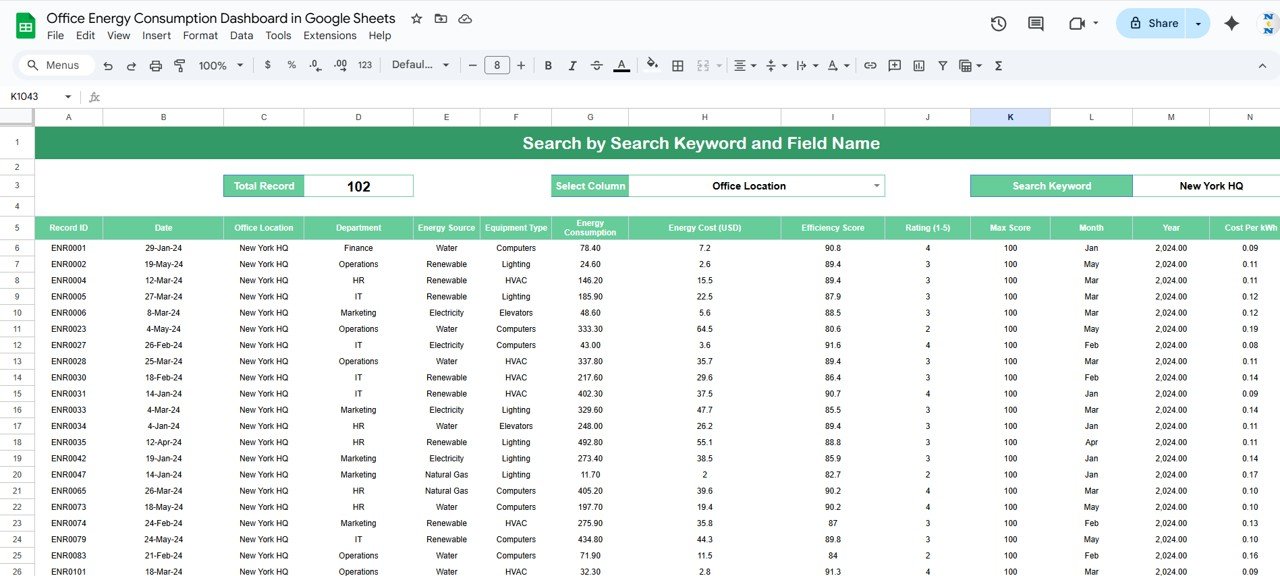
2. Search Sheet Tab
The Search sheet allows users to:
-
Search by keyword or field name
-
Quickly retrieve records based on location, department, or equipment type
This makes it easy to analyze specific energy consumption data without manually scanning through all entries.
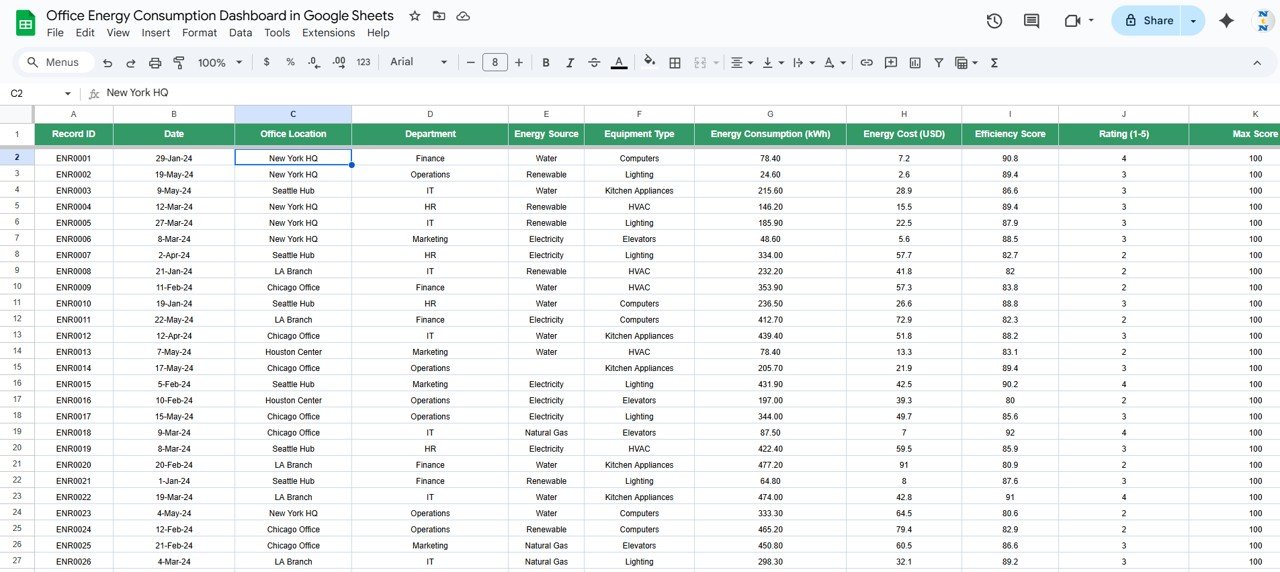
3. Data Sheet Tab
The Data sheet is the input sheet where all energy-related data is recorded.
Advantages of Using the Dashboard
-
Centralized Tracking: All energy data in one place for easy monitoring
-
Cost Savings: Identify high-consumption areas to reduce energy costs
-
Sustainability Monitoring: Track efficiency ratings and energy source performance
-
Trend Analysis: Analyze monthly, departmental, and source-based trends
-
Data-Driven Decisions: Allocate resources and implement energy-saving measures
-
Easy to Use: Google Sheets allows collaborative editing and real-time updates
Best Practices for Using the Dashboard
-
Regularly Update Data: Enter energy consumption and cost records promptly
-
Segment by Department and Location: Identify high-usage areas for targeted efficiency improvements
-
Monitor Energy Sources: Compare consumption and costs for electricity, gas, solar, and other sources
-
Track Trends: Use charts to identify seasonal or monthly spikes in energy usage
-
Set Benchmarks: Use efficiency scores and ratings to measure performance against goals
-
Collaborate: Share the dashboard with relevant departments to support energy-saving initiatives
How This Dashboard Helps Organizations
-
Optimize Energy Usage: Identify inefficient equipment and high-consumption areas
-
Reduce Operational Costs: Track energy expenses and implement cost-saving measures
-
Support Sustainability Goals: Monitor energy efficiency and source usage
-
Improve Resource Allocation: Focus efforts on departments or locations with high energy usage
-
Generate Reports: Quickly create visual reports for management or sustainability audits
Frequently Asked Questions (FAQs)
Q1: Can I add new energy sources to the dashboard?
Yes, you can customize the energy source field in the Data sheet and update charts accordingly.
Q2: How often should data be updated?
Ideally, update energy consumption and cost data daily, weekly, or monthly depending on reporting needs.
Q3: Can I track energy efficiency by department?
Yes, the dashboard includes charts for departmental energy consumption and ratings.
Q4: Is this dashboard suitable for multiple office locations?
Absolutely. You can filter data by office location to compare energy usage and costs.
Q5: Can I calculate cost per kWh automatically?
Yes, the Data sheet includes a column for cost per kWh, which can be calculated from energy consumption and cost.
Conclusion
The Office Energy Consumption Dashboard in Google Sheets is a comprehensive tool for tracking energy usage, costs, and efficiency across offices and departments. By consolidating data, visualizing trends, and enabling data-driven decisions, organizations can optimize energy consumption, reduce operational costs, and support sustainability goals.
Watch the step-by-step video Demo:
Visit our YouTube channel to learn step-by-step video tutorials