Maintaining a safe and compliant workplace is essential for every organization. The Safety and Compliance Dashboard in Google Sheets provides a ready-to-use solution to monitor incidents, track resolution times, and ensure adherence to compliance standards.
This article explains the features, benefits, and best practices for using this dashboard effectively.
What Is a Safety and Compliance Dashboard?
A Safety and Compliance Dashboard is an interactive tool that consolidates workplace incident and compliance data into a single view. It helps organizations:
-
Track total incidents reported
-
Monitor resolution times and escalation rates
-
Analyze incident trends by severity, type, and location
-
Make data-driven decisions to improve workplace safety
Using Google Sheets, this dashboard is accessible, easy to update, and collaborative for team members.
Key Features of the Safety and Compliance Dashboard
Click to Buy Safety and Compliance Dashboard in Google Sheets
This dashboard is designed with three key worksheets:
1. Dashboard Sheet Tab
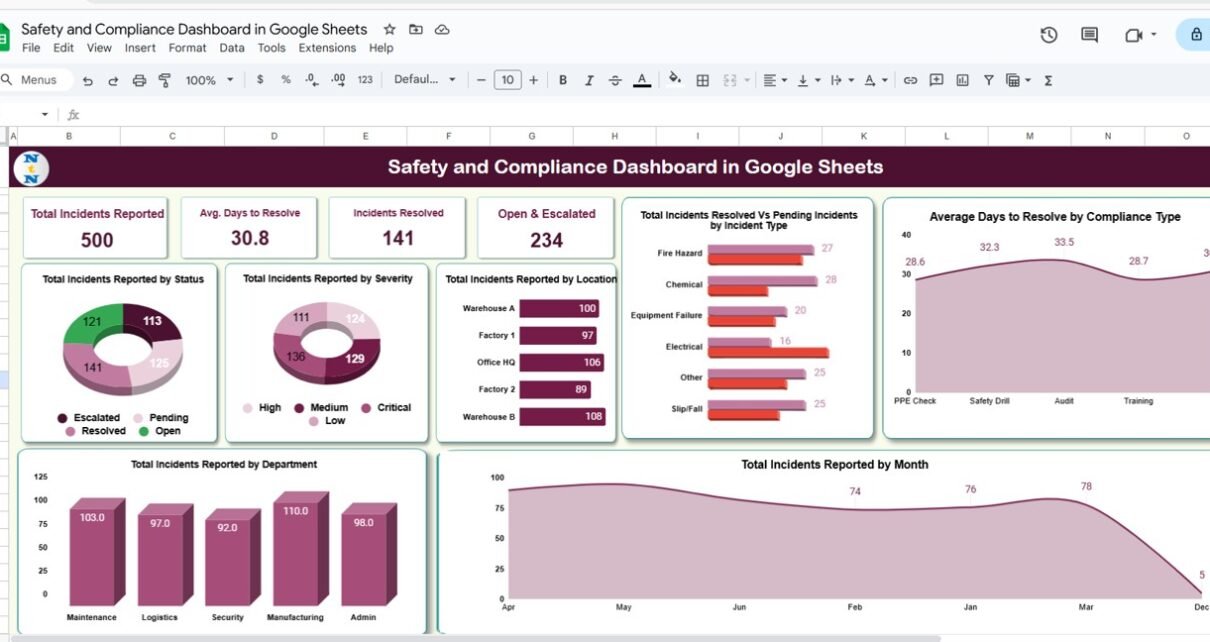
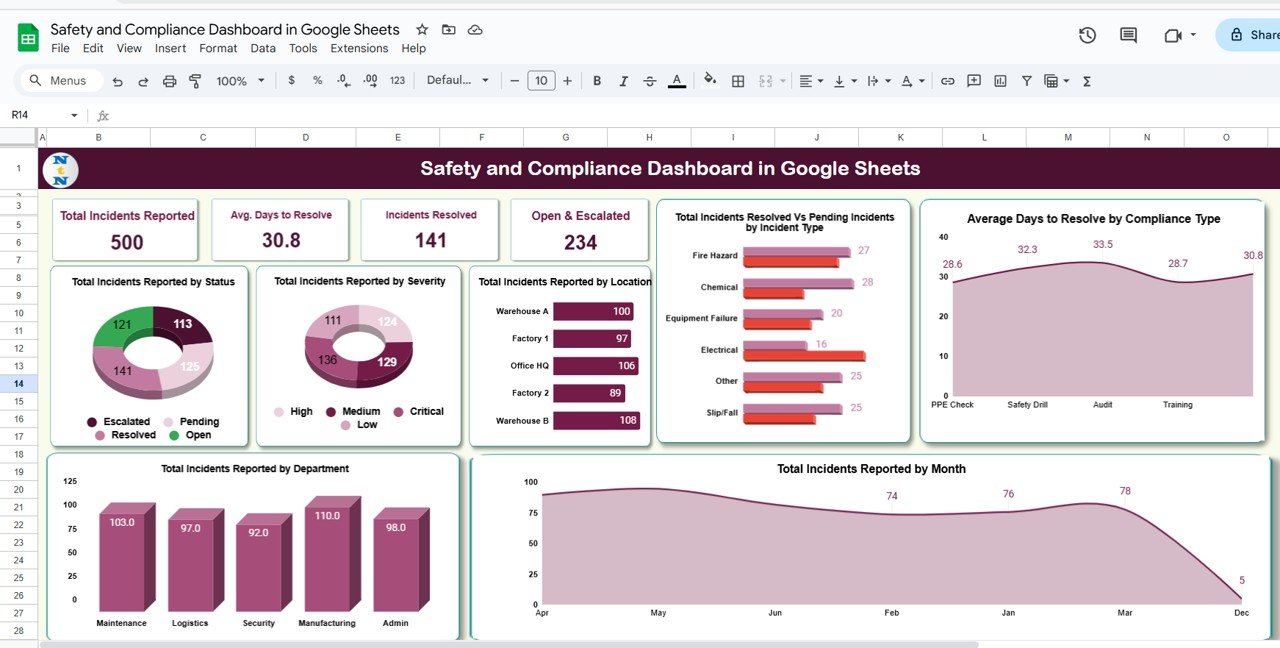
The Dashboard sheet provides a comprehensive overview of incidents and compliance metrics.
Cards Section:
-
Total Incidents Reported – Total number of incidents recorded
-
Avg. Days to Resolve – Average time taken to resolve incidents
-
Incidents Resolved – Number of incidents successfully resolved
-
Open & Escalated – Incidents pending resolution or escalated
Charts Section:
-
Total Incidents Reported by Status – Tracks incidents by status (Open, Closed, Escalated)
-
Total Incidents Reported by Severity – Categorizes incidents by severity level
-
Total Incidents Reported by Location – Tracks incidents across different locations
-
Total Incidents Resolved Vs Pending Incidents by Incident Type – Visualizes resolution performance per type
-
Average Days to Resolve by Compliance Type – Monitors efficiency in resolving incidents by category
-
Total Incidents Reported by Month – Trend analysis for incidents over time
-
Total Incidents Reported by Department – Identifies high-risk departments for proactive action
Click to Buy Safety and Compliance Dashboard in Google Sheets
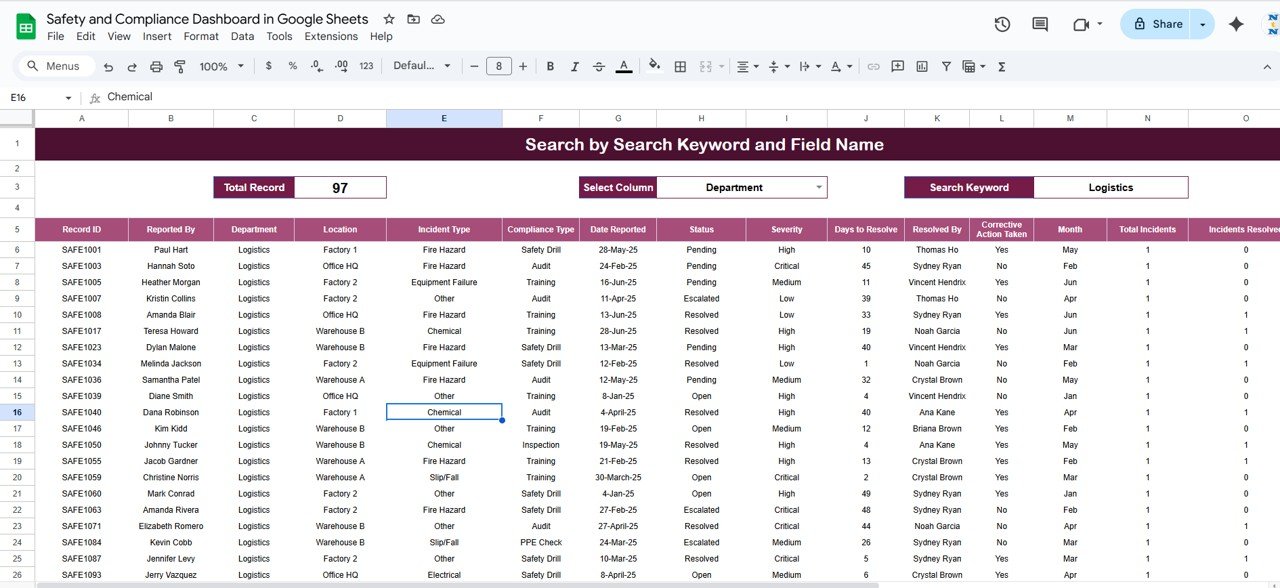
2. Search Sheet Tab
The Search Sheet allows quick retrieval of specific incident records:
-
Search by keyword or field name
-
Provides instant access to detailed information about incidents, including date, type, severity, and responsible department
This feature ensures faster decision-making and incident tracking.
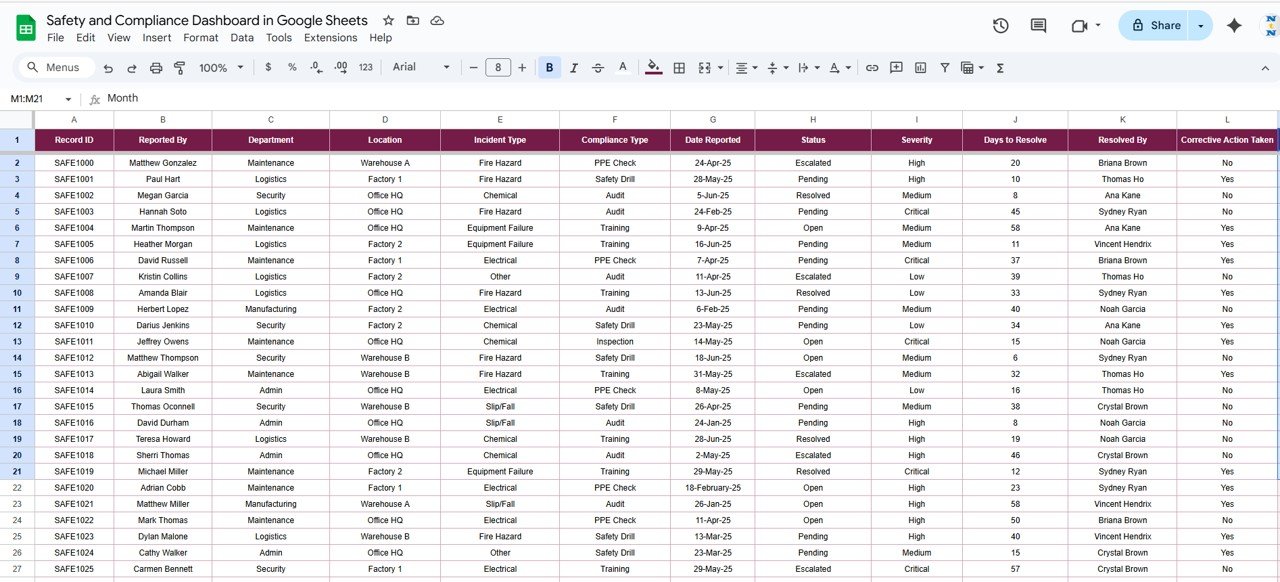
3. Data Sheet Tab
The Data Sheet serves as the input hub for all incident and compliance data:
-
Capture details such as Incident ID, Date, Type, Severity, Location, Department, Status, and Resolution Time
-
All dashboard charts and cards are automatically updated based on the data entered
This structured data ensures accuracy, reliability, and real-time reporting.
Click to Buy Safety and Compliance Dashboard in Google Sheets
Advantages of Using the Safety and Compliance Dashboard
-
Centralized Tracking: All incidents and compliance metrics in one sheet
-
Visual Insights: Easy-to-read charts and cards provide instant insights
-
Proactive Management: Identify high-risk areas and departments to prevent incidents
-
Efficiency Monitoring: Track resolution times and escalation percentages
-
Collaboration: Google Sheets allows multiple team members to update data simultaneously
-
Data Accuracy: Structured input reduces errors and ensures reliable reporting
Best Practices for Using the Dashboard
-
Update Data Regularly: Enter incidents as soon as they occur for real-time monitoring
-
Segment Data: Use filters by department, location, severity, and compliance type for detailed insights
-
Monitor Trends: Review monthly and YTD trends to identify recurring issues
-
Track Resolution Efficiency: Focus on reducing average days to resolve incidents
-
Review Escalation Rates: Address high escalation rates by analyzing root causes
-
Use Conditional Formatting: Highlight critical incidents for quick attention
How This Dashboard Helps Organizations
Click to Buy Safety and Compliance Dashboard in Google Sheets
-
Enhances Workplace Safety: Provides visibility into safety incidents and trends
-
Improves Compliance: Monitors adherence to internal and regulatory standards
-
Optimizes Resource Allocation: Prioritize high-risk areas and allocate resources effectively
-
Reduces Response Time: Identify bottlenecks in incident resolution
-
Supports Reporting: Generate accurate reports for management or audits
Frequently Asked Questions (FAQs)
Click to Buy Safety and Compliance Dashboard in Google Sheets
Q1: Can I customize the incident types in the dashboard?
Yes, you can add, remove, or rename incident types in the Data sheet to match your organization’s needs.
Q2: How often should the data be updated?
Ideally, update the data daily or weekly, depending on the frequency of incidents.
Q3: Can I track incidents by department or location?
Yes, the dashboard includes charts to monitor incidents by both department and location.
Q4: Does the dashboard show trends over time?
Yes, monthly and YTD charts allow trend analysis for incident reporting and resolution.
Q5: Can multiple team members update this dashboard simultaneously?
Absolutely. Google Sheets supports real-time collaboration, so multiple users can input and update data at the same time.
Conclusion
The Safety and Compliance Dashboard in Google Sheets is a comprehensive, easy-to-use tool for monitoring workplace safety and compliance. By providing real-time insights into incidents, resolution times, and escalation rates, this dashboard helps organizations improve safety, ensure compliance, and take proactive action to prevent future issues.
Visit our YouTube channel to learn step-by-step video tutorials
Youtube.com/@NeotechNavigators
Watch the step-by-step video Demo:
Click to Buy Safety and Compliance Dashboard in Google Sheets